. 2020 Feb 24;52(4):413-428.e6.
doi: 10.1016/j.devcel.2020.01.034.

Single-Chromosomal Gains Can Function as Metastasis Suppressors and Promoters in Colon Cancer

Affiliations

Single-Chromosomal Gains Can Function as Metastasis Suppressors and Promoters in Colon Cancer

Anand Vasudevan et al. Dev Cell. .

Abstract

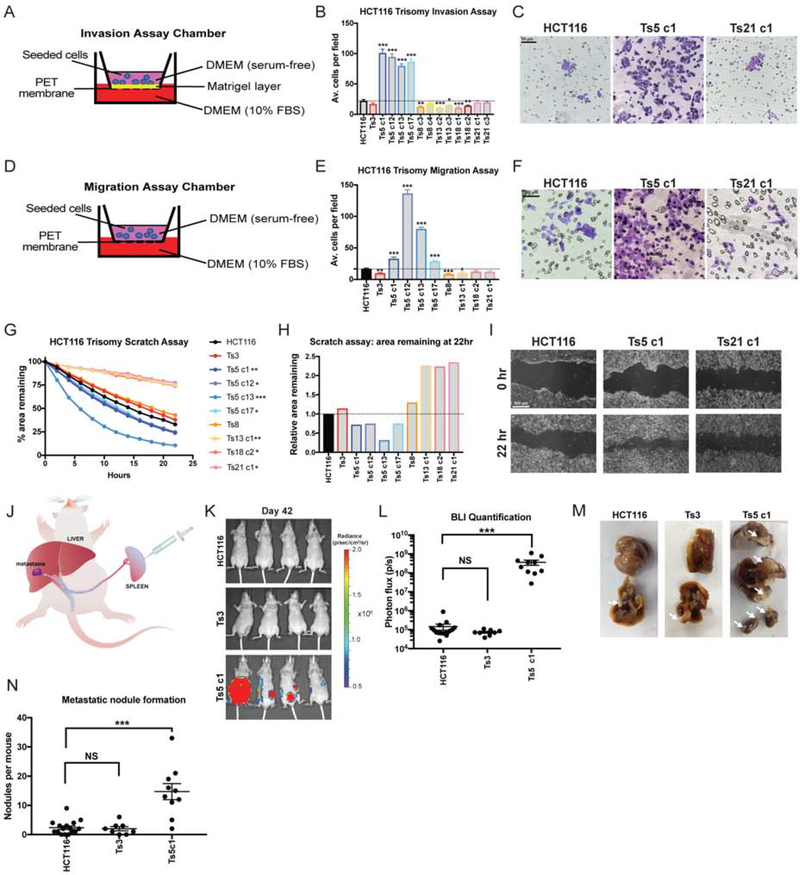
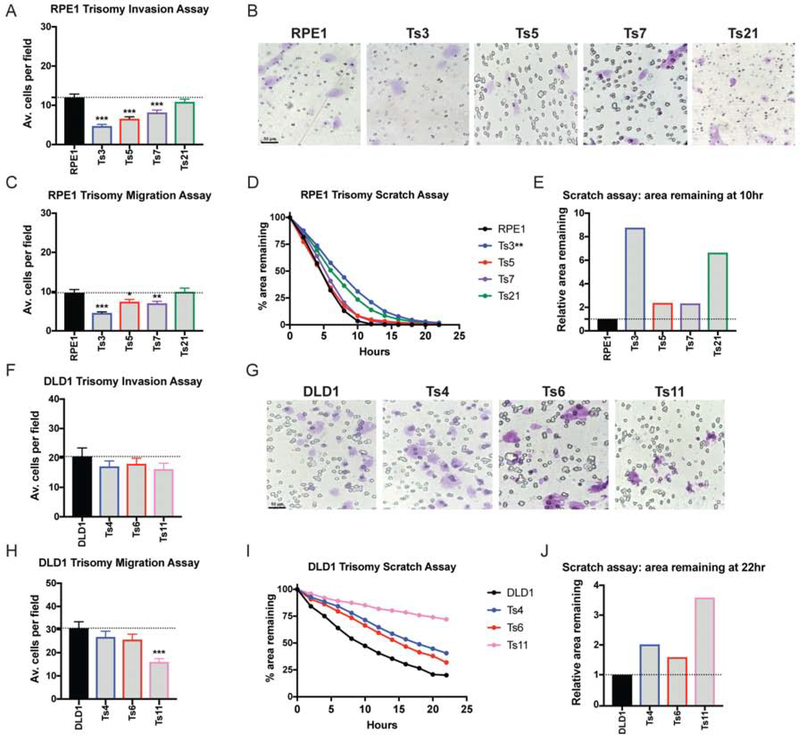
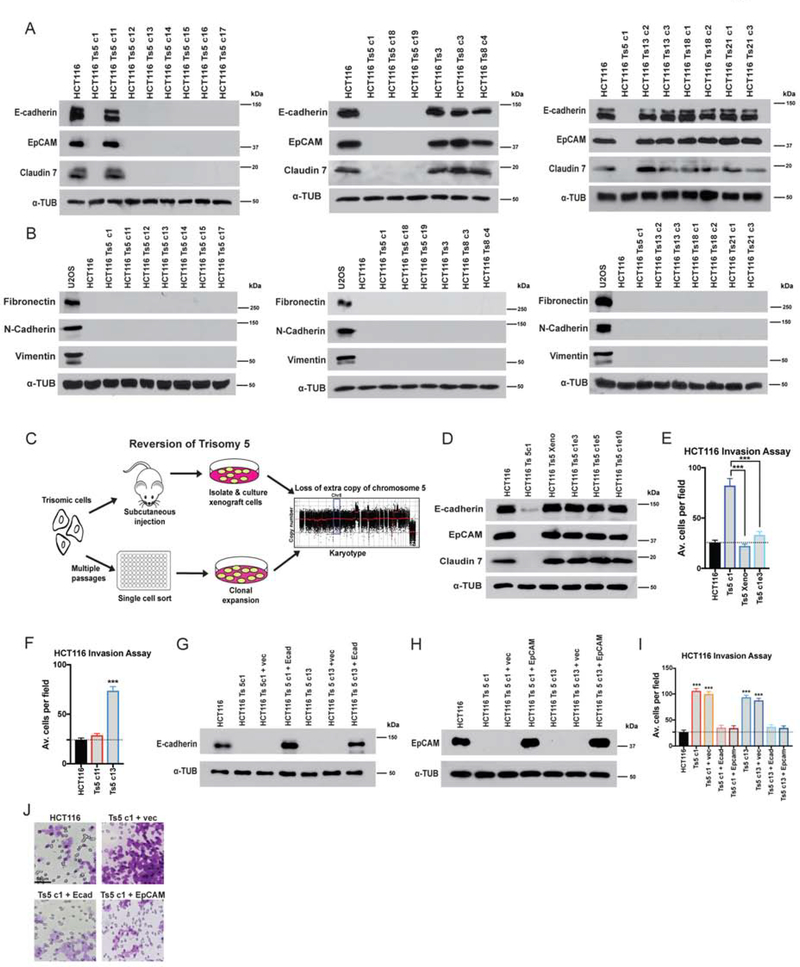
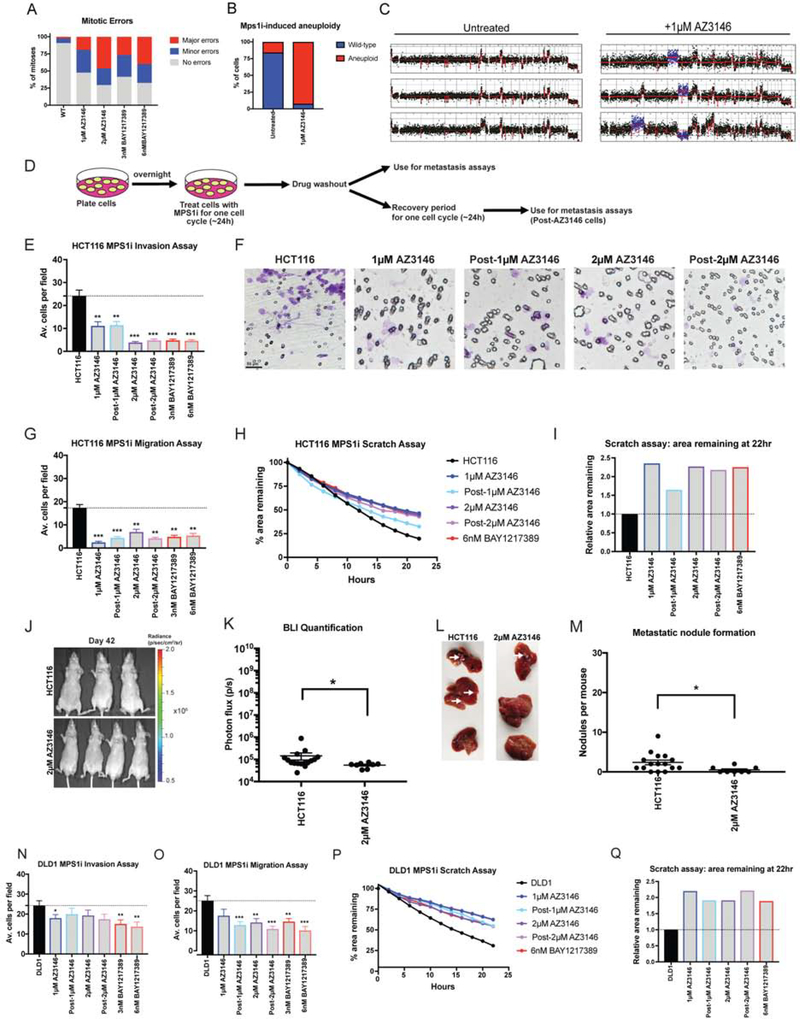
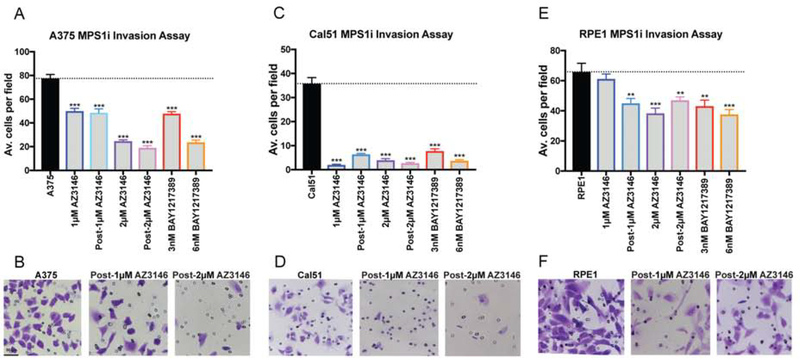
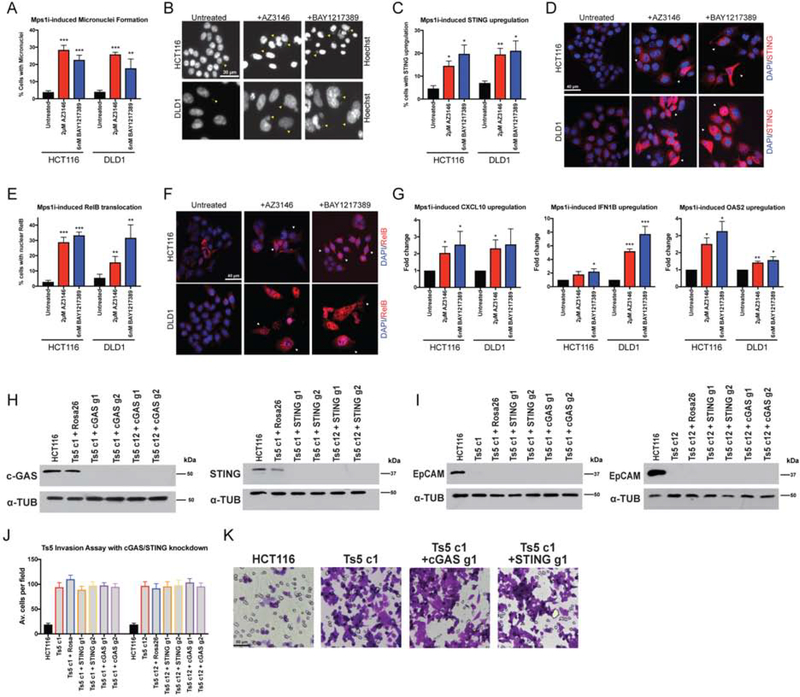
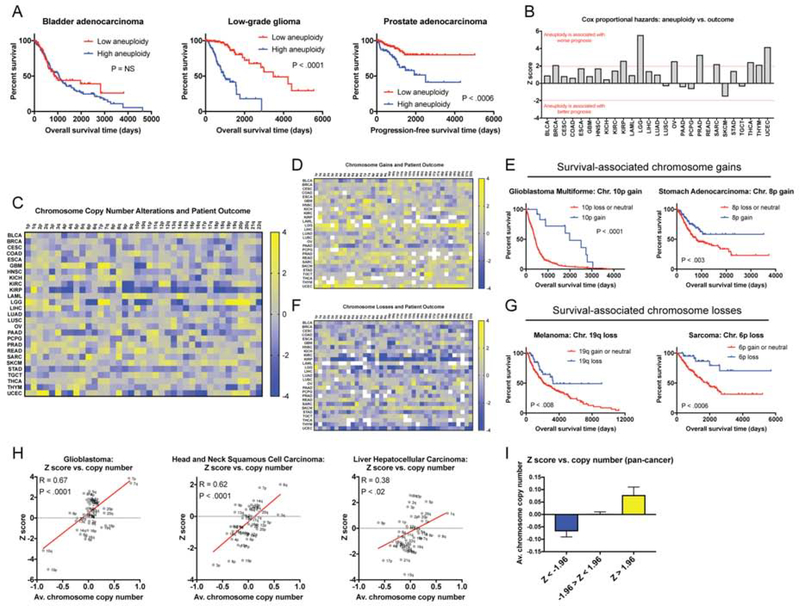
High levels of cancer aneuploidy are frequently associated with poor prognosis. To examine the relationship between aneuploidy and cancer progression, we analyzed a series of congenic cell lines that harbor single extra chromosomes. We found that across 13 different trisomic cell lines, 12 trisomies suppressed invasiveness or were largely neutral, while a single trisomy increased metastatic behavior by triggering a partial epithelial-mesenchymal transition. In contrast, we discovered that chromosomal instability activates cGAS/STING signaling but strongly suppresses invasiveness. By analyzing patient copy-number data, we demonstrate that specific aneuploidies are associated with distinct outcomes, and the acquisition of certain aneuploidies is in fact linked with a favorable prognosis. Thus, aneuploidy is not a uniform driver of malignancy, and different aneuploidies can uniquely influence tumor progression. At the same time, the gain of a single chromosome is capable of inducing a profound cell state transition, thereby linking genomic plasticity, phenotypic plasticity, and metastasis.

Keywords: EMT; aneuploidy; cGAS/STING; chromosome missegregation; copy number variation; metastasis.


Conflict of interest statement

Declaration of Interests J.M.S. has received consulting fees from Ono Pharmaceutical Co. and is a member of the Advisory Board of Tyra Biosciences.

Figures

Figure 1.
Figure 1.. Gaining chromosome 5 increase invasion, migration, and motility in colon cancer cells.
(A) Schematic diagram of the invasion assay. Cells are seeded in the upper chamber in serum-free media while the bottom chamber contains media supplemented with 10% FBS. (B) Quantification of the average number of cells per field that were able to cross the membrane in the invasion assay. Averages represent three independent trials in which 15–20 fields were counted. (C) Representative images of HCT116, HCT116 Ts5 c1, and HCT116 Ts21 c1 invasion stained with crystal violet. (D) Schematic diagram of migration assay. The setup is similar to the invasion assay except that the membrane does not have a matrigel layer. (E) Quantification of the average number of cells per field that were able to cross the membrane in the migration assay. Averages represent three independent trials in which 15–20 fields were counted. (F) Representative images of HCT116, HCT116 Ts5 c1, and HCT116 Ts21 c1 migration stained with crystal violet. (G) Quantification of cell motility in a scratch assay. The percent area remaining between two monolayers separated by a pipette tip-induced scratch was monitored for 22 hours. Minimum of 2 trials per cell line. (H) The ratio of the area remaining at 22 hours after the scratch is plotted relative to the HCT116 parental cell line. A ratio less than 1 indicates faster scratch closure relative to wild-type, while a ratio greater than 1 indicates slower scratch closure. (I) Representative images of the scratch closure assay immediately after the scratch (0h) and at the end of the assay (22h) for HCT116, HCT116 Ts5 c1, and HCT116 Ts21 c1. Bars represent mean ± SEM. * p<0.05; ** p<0.005 *** p<0.0005. Scale bar, 50 and 200 μm (J) A schematic of the colon cancer metastasis assay. Luciferase-expressing cells are injected into the mouse spleen, and then metastatic nodule formation in other organs is quantified. (K) Luciferase imaging of mice injected with HCT116 or HCT116 Ts5 cells 42 days post-injection. (L) Bioluminescence imaging quantification of the luciferase signal in mice injected with HCT116, HCT116 Ts3, and HCT116 Ts5 cells. (M) Images of metastatic nodule formation from mice euthanized 42 days post-injection. White arrows indicate metastases. (N) Quantification of the number of nodules per mouse (HCT116 n = 16, HCT116 Ts3 n = 8, HCT116 Ts5 c1 n = 10). Bars represent mean ± SEM. Unpaired t-test * p<0.05; ** p<0.005 *** p<0.0005. Scale bar, 50 and 200 μm.
Figure 2.
Figure 2.. Single chromosome gains in RPE1 and DLD1 commonly suppress metastatic behavior.
(A, F) Quantification of the average number of cells per field that were able to cross the membrane in the invasion assay in RPE1 and DLD1. Averages represent three independent trials in which 15–20 fields were counted. (B, G) Representative images of RPE1 and DLD1 invasion. (C, H) Quantification of the average number of cells per field that were able to cross the membrane in the migration assay. Averages represent three independent trials in which 15–20 fields were counted. (D, I) Quantification of cell motility in a scratch assay. The percent area remaining between two monolayers separated by a pipette tip-induced scratch was monitored for 22 hours. (E, J) The ratio of the area remaining at 22 hours after the scratch is plotted relative to the RPE1 or DLD1 parental cell line. A ratio less than 1 indicates faster scratch closure relative to wild-type, while a ratio greater than 1 indicates slower scratch closure. Bars represent mean ± SEM. Unpaired t-test * p<0.05; ** p<0.005 *** p<0.0005. Scale bar, 50 μm
Figure 3.
Figure 3.. Gaining chromosome 5 induces a cell state transition in colon cancer cells.
(A) Western blot analysis of epithelial marker expression in HCT116 trisomies. Alpha-tubulin was used as a loading control. (B) Western blot analysis for Fibronectin, Vimentin, and N-cadherin indicates that HCT116 trisomies do not express mesenchymal genes. The sarcoma cell line U2OS was analyzed as a positive control. (C) Schematic of two strategies to select for HCT116 Ts5 chromosome-loss revertants. (D) Western blot analysis of epithelial marker expression in trisomy 5 cells that lost the extra copy of chromosome 5. “Xeno”: cells isolated after xenograft growth. Ts5 c1 e3, e5, e10: clones isolated from high-passage cells. (E-F) Quantification of the average number of cells per field that were able to cross the membrane in the invasion assay. Averages represent three independent trials in which 15–20 fields were counted. (G-H) Verification of E-cadherin and EpCAM overexpression in two HCT116 Ts5 clones transfected with the indicated plasmids. (I) Quantification of the average number of cells per field that were able to cross the membrane in the invasion assay. Averages represent three independent trials in which 15–20 fields were counted. (J) Representative images of invasion in the indicated cell lines. Bars represent mean ± SEM. Unpaired t-test *** p<0.0005. Scale bar, 50 μm
Figure 4.
Figure 4.. Chromosomal instability is insufficient to drive metastasis.
(A) Quantification of mitotic error frequency after Mps1 inhibitor treatment. A mitosis with “minor errors” exhibited a single lagging chromosome, anaphase bridge, or micronucleus, while a mitosis with “major errors” displayed more than one of these phenomena. (B) The percent of cells with whole-chromosome aneuploidies in HCT116 cells +/− 1 μM AZ3146 are displayed. (C) Representative karyotypes of single cells +/− 1 μM AZ3146. (D) Schematic diagram of MPS1 inhibitor treatment and drug washout prior to metastasis assays. (E, N) Quantification of the average number of cells per field that were able to cross the membrane in the invasion assay in either HCT116 or DLD1. Averages represent three independent trials in which 15–20 fields were counted. (F) Representative images of invasion in the indicated Mps1i-treated cell lines. (G, O) Quantification of the average number of cells per field that were able to cross the membrane in the migration assay in either HCT116 or DLD1. (H, P) Quantification of the percent area remaining in the scratch assay after Mps1 inhibitor treatment. (I, Q) The ratio of the area remaining at 22 hours after the scratch is plotted relative to the untreated parental cell line. (J) Luciferase imaging of mice injected with HCT116 or AZ3146 treated cells 42 days post-injection. (K) Bioluminescence imaging quantification of the luciferase signal in mice injected with HCT116 cells and HCT116 cells treated with 2 μM AZ3146. (L) Images of metastatic nodule formation from mice euthanized 42 days post-injection. White arrows indicate metastases. (M) Quantification of the number of nodules per mouse (HCT116 n = 16, AZ3146 n = 8). The animals injected with HCT116 cells are the same batch used in Figure 1N. Bars represent mean ± SEM. Unpaired t-test * p<0.05; ** p<0.005 *** p<0.0005. Scale bar, 50 μm
Figure 5.
Figure 5.. The effects of Mps1 inhibitor treatment on invasive behavior.
(A, C, E) Quantification of the average number of cells per field that were able to cross the membrane in the invasion assay in A375, Cal51 and RPE1. Averages represent two independent trials in which 15–20 fields were counted. (B, D, F) Representative images of invasion in the indicated Mps1i-treated cell lines. Bars represent mean ± SEM. Unpaired t-test * p<0.05; ** p<0.005 *** p<0.0005. Scale bar, 50 μm.
Figure 6.
Figure 6.. Mps1 inhibition activates cGAS/STING signaling.
(A) Quantification of the percent of cells with micronuclei after Mps1 inhibitor treatment in HCT116 and DLD1. (B) Representative images of micronuclei after Mps1 inhibitor treatment. Yellow arrows indicate certain visible micronuclei. (C) Quantification of the percent of cells with STING upregulation after Mps1 inhibitor treatment. (D) Representative images of cells with STING upregulation after Mps1 inhibitors treatment. White arrows indicate certain cells with STING upregulation. (E) Quantification of the percent of cells with nuclear RelB after Mps1 inhibitor treatment. (F) Representative images of cells after Mps1 inhibitor treatment. White arrows indicate certain cells with nuclear RelB. (G) qPCR quantification of several NFκB target genes. (H) Western blot demonstrating the CRISPRi-induced knockdown of cGAS and STING in two HCT116 Ts5 clones. (I) EpCAM expression after knockdown of cGAS and STING with CRISPRi in HCT116 Ts5 clones. (J) Quantification of the average number of cells per field that were able to cross the membrane in the invasion assay after cGAS or STING knockdown. (K) Representative images of the invasion assay in the indicated cell lines. Bars represent mean ± SEM. Unpaired t-test * p<0.05; ** p<0.005 *** p<0.0005. Scale bar, 30, 40 and 50 μm
Figure 7.
Figure 7.. A pan-cancer analysis of chromosome copy number changes associated with patient survival.
(A) The total number of aneuploid chromosomes in each tumor was calculated according to (Taylor et al. 2018). In each cancer type, patients were subdivided into two groups: low aneuploidy (≤ 20th percentile aneuploidy score) and high aneuploidy (≥ 80th percentile aneuploidy score). Kaplan-Meier curves are shown for three cancer types. (B) Z scores from Cox-proportional hazards analysis based on the aneuploidy scores, as described above, are displayed. Note that Z > 1.96 indicates a significant association between higher aneuploidy and death, while Z < −1.96 indicates a significant association between higher aneuploidy and survival. (C) A heatmap comparing chromosome arm copy number vs. patient outcome across 10,133 patients with 27 different types of cancer. The color-bar indicates the Z score from the Cox analysis. For visualization purposes, Z scores were capped at 4 and −4. (D) A heatmap comparing dichotomized chromosome arm copy number vs. patient outcome across 10,133 patients with 27 different types of cancer. In this analysis, survival was compared between patients in which a given arm was gained and patients in which a given arm was either lost or was copy-neutral. The color-bar indicates the Z score from the Cox analysis. For visualization purposes, Z scores were capped at 4 and −4. (E) Representative Kaplan-Meier curves of two instances in which chromosome gains are associated with improved patient prognosis. (F) A heatmap comparing dichotomized chromosome arm copy number vs. patient outcome across 10,133 patients with 27 different types of cancer. In this analysis, survival was compared between patients in which a given arm was lost and patients in which a given arm was either gained or was copy-neutral. The color-bar indicates the Z score from the Cox analysis. For visualization purposes, Z scores were capped at 4 and −4. (G) Representative Kaplan-Meier curves of two instances in which chromosome losses are associated with improved patient prognosis. (H) Scatter plots comparing the average chromosome copy number vs. the Z score obtained from Cox analysis for three different cancer types. (I) A bar graph displaying the average chromosome copy number across all 27 cancer types, binned based on the Z score from the Cox model.

Comment in

References

    1. Andrews P 2017. MUMdex Software. MUMdex Genome Alignment Anal Softw. https://mumdex.com/ (Accessed February 27, 2019).
    1. Andrews PA, Iossifov I, Kendall J, Marks S, Muthuswamy L, Wang Z, Levy D, Wigler M. 2016. MUMdex: MUM-based structural variation detection. bioRxiv 078261.
    1. Bailey MH, Tokheim C, Porta-Pardo E, Sengupta S, Bertrand D, Weerasinghe A, Colaprico A, Wendl MC, Kim J, Reardon B, et al. 2018. Comprehensive Characterization of Cancer Driver Genes and Mutations. Cell 173: 371–385.e18. - PMC - PubMed
    1. Bakhoum SF, Ngo B, Laughney AM, Cavallo J-A, Murphy CJ, Ly P, Shah P, Sriram RK, Watkins TBK, Taunk NK, et al. 2018. Chromosomal instability drives metastasis through a cytosolic DNA response. Nature 553: 467–472. - PMC - PubMed
    1. Baslan T, Kendall J, Rodgers L, Cox H, Riggs M, Stepansky A, Troge J, Ravi K, Esposito D, Lakshmi B, et al. 2012. Genome-wide copy number analysis of single cells. Nat Protoc 7: 1024–1041. - PMC - PubMed

Publication types

MeSH terms