

A multi-resolution air temperature model for France from MODIS and Landsat thermal data
- PMID: 32097815
- PMCID: PMC7167357
- DOI: 10.1016/j.envres.2020.109244
A multi-resolution air temperature model for France from MODIS and Landsat thermal data
Abstract
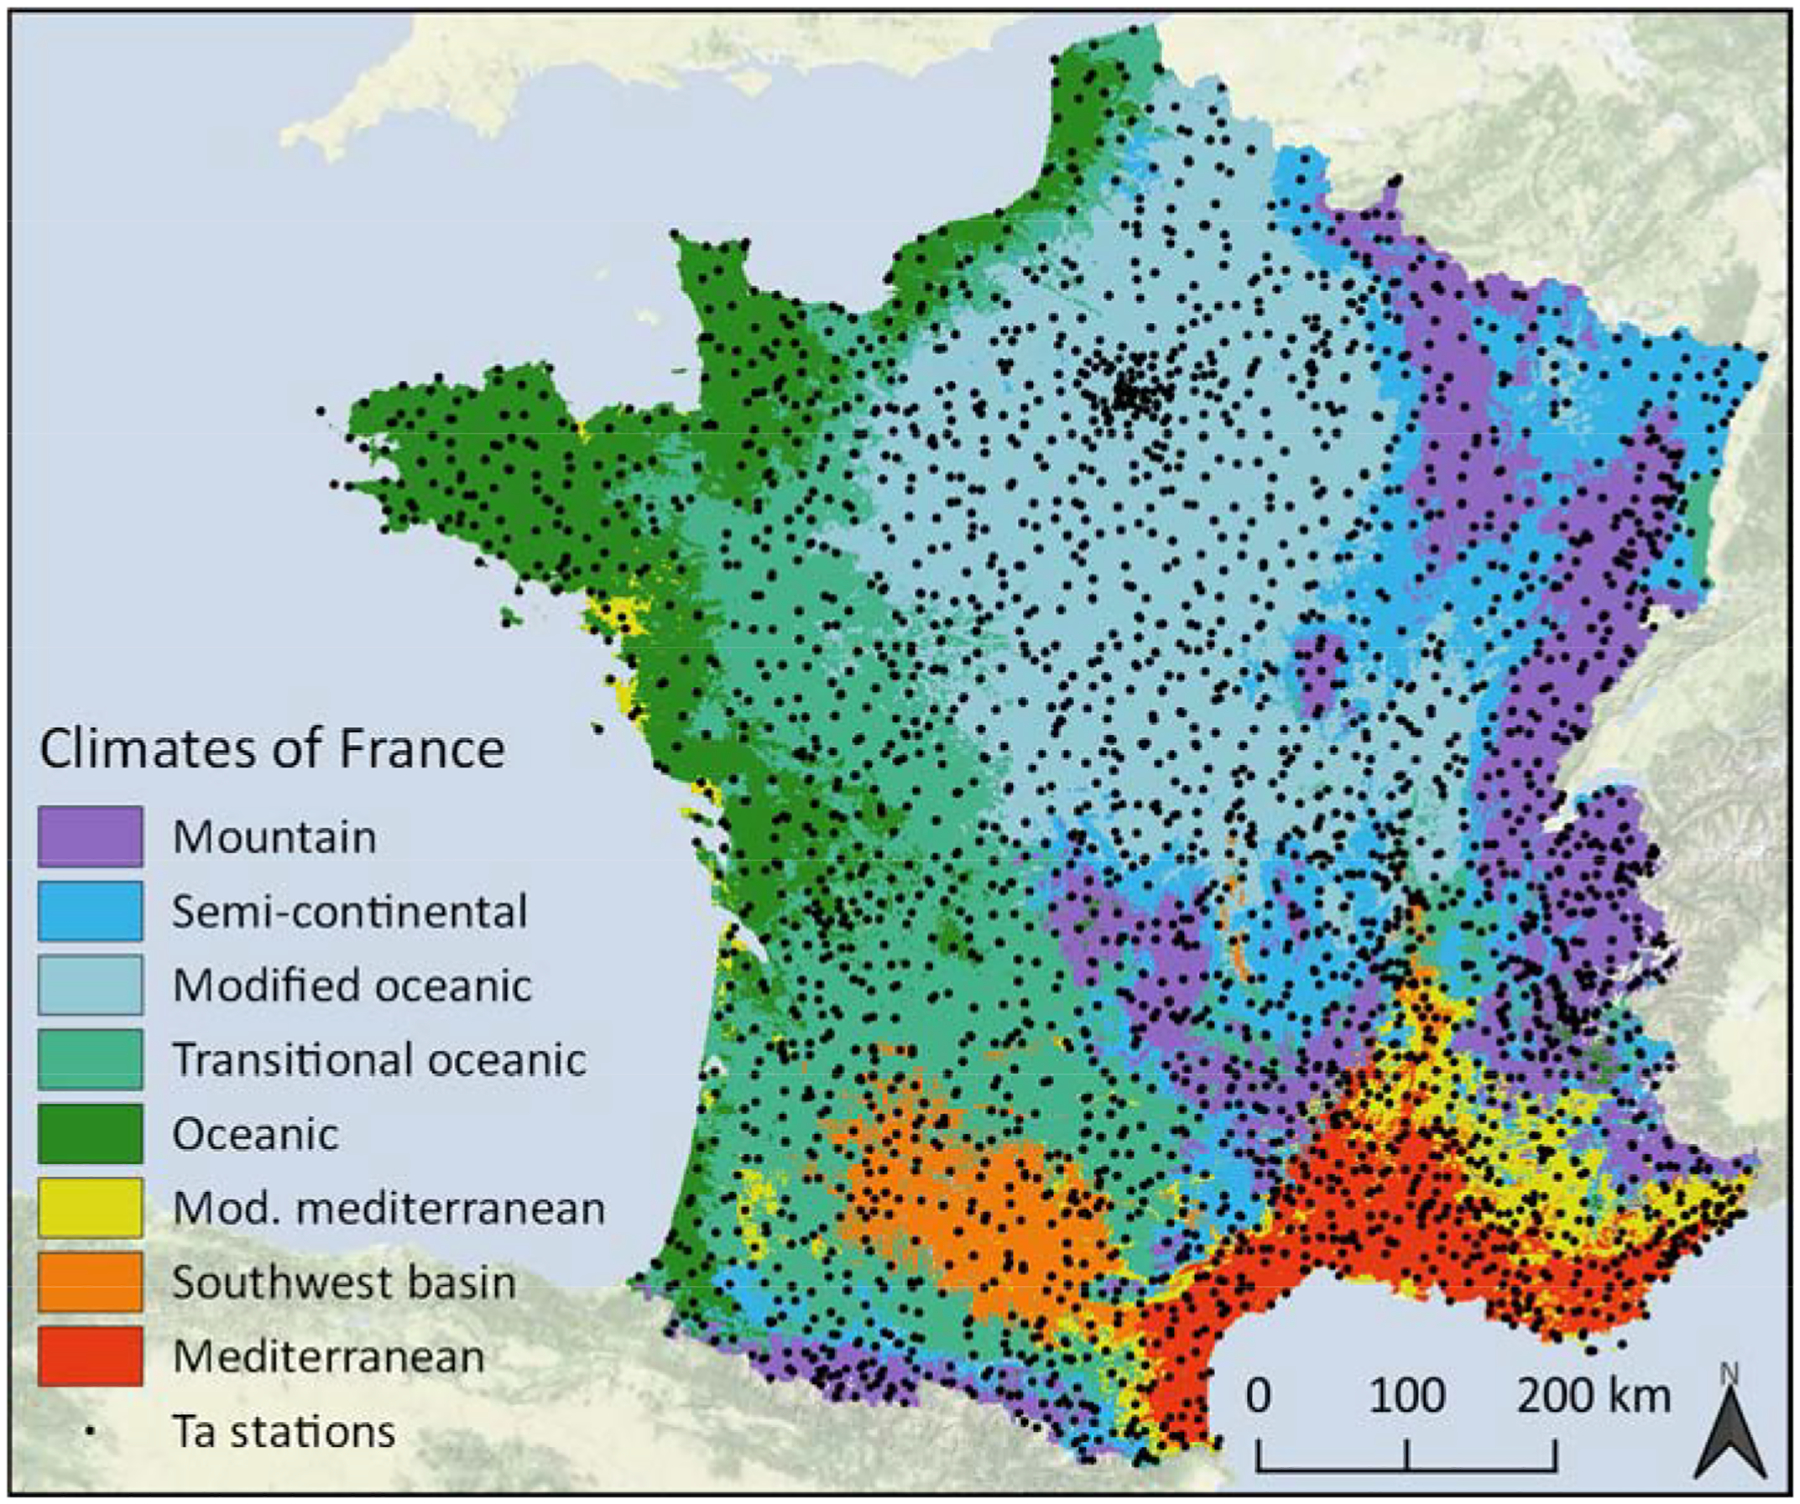
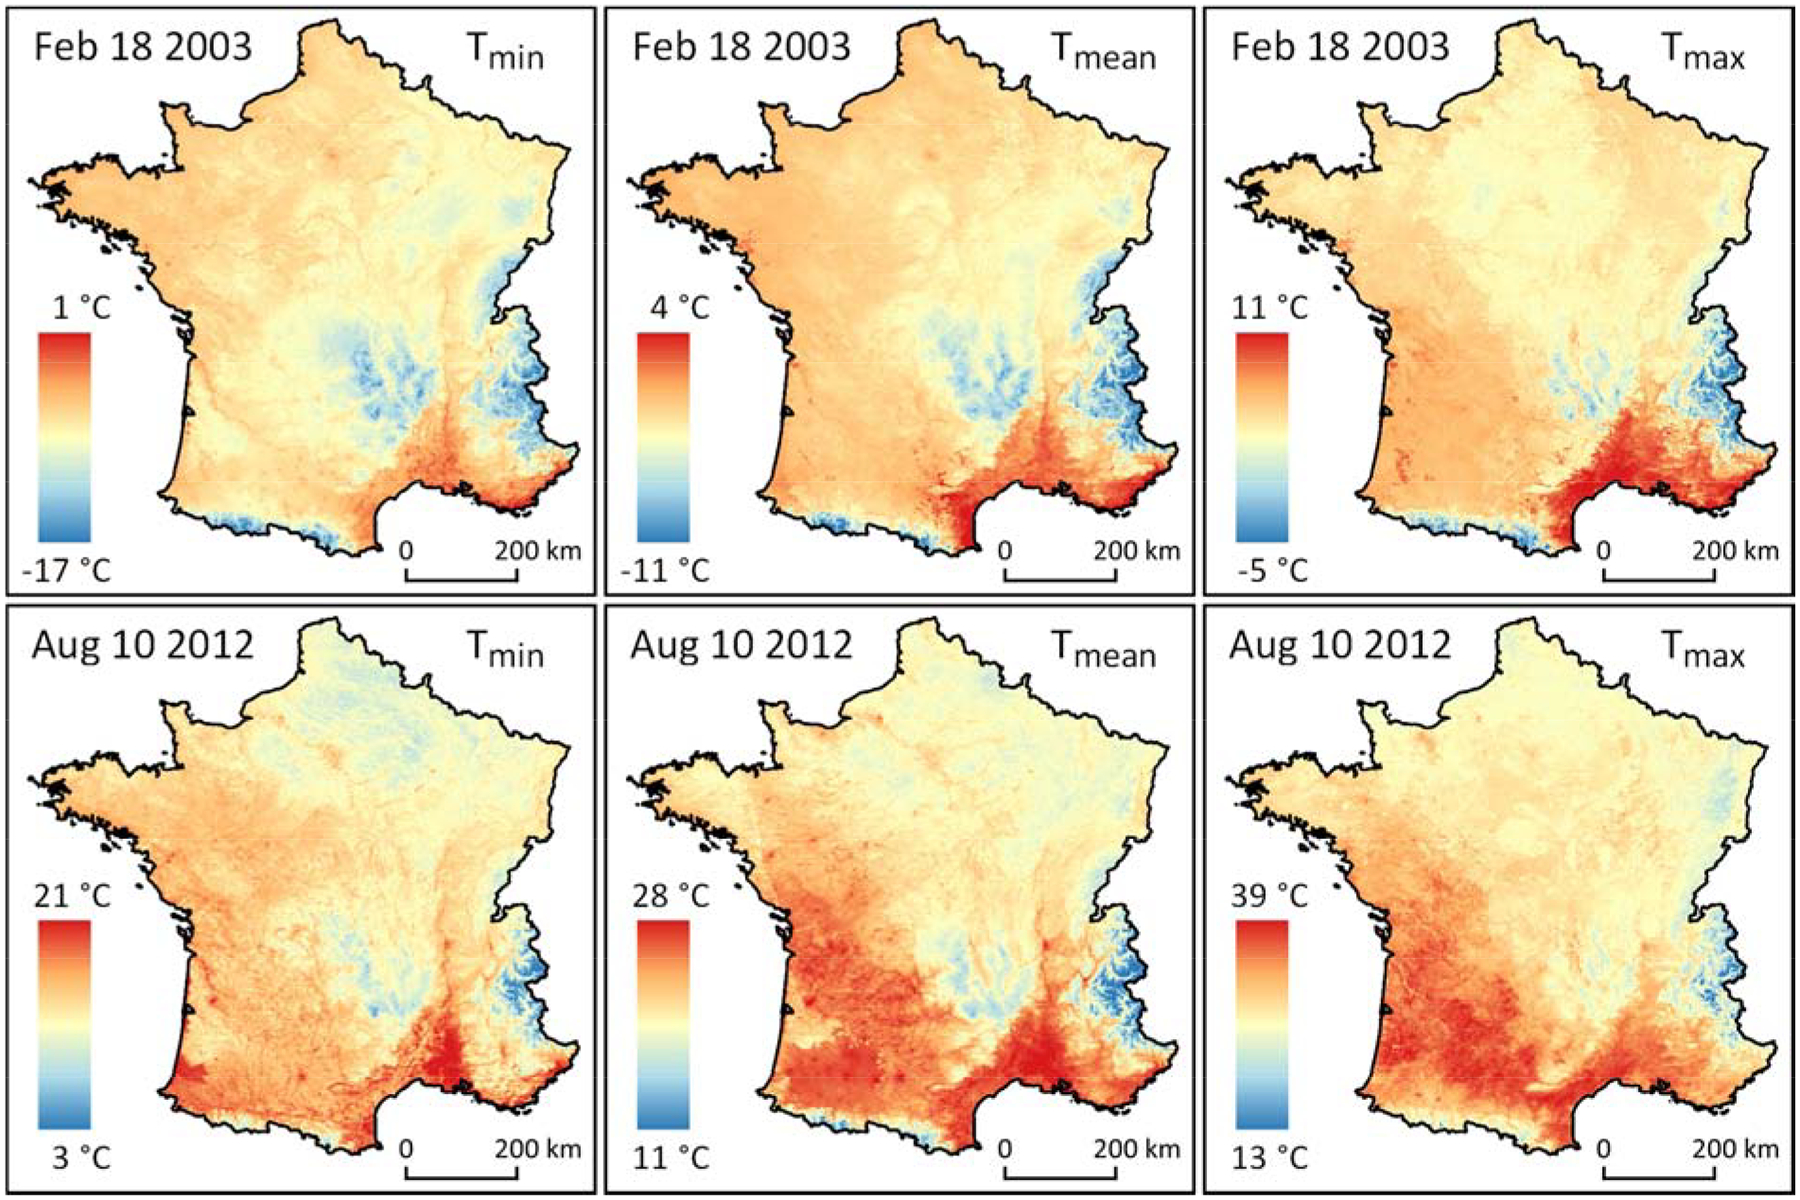
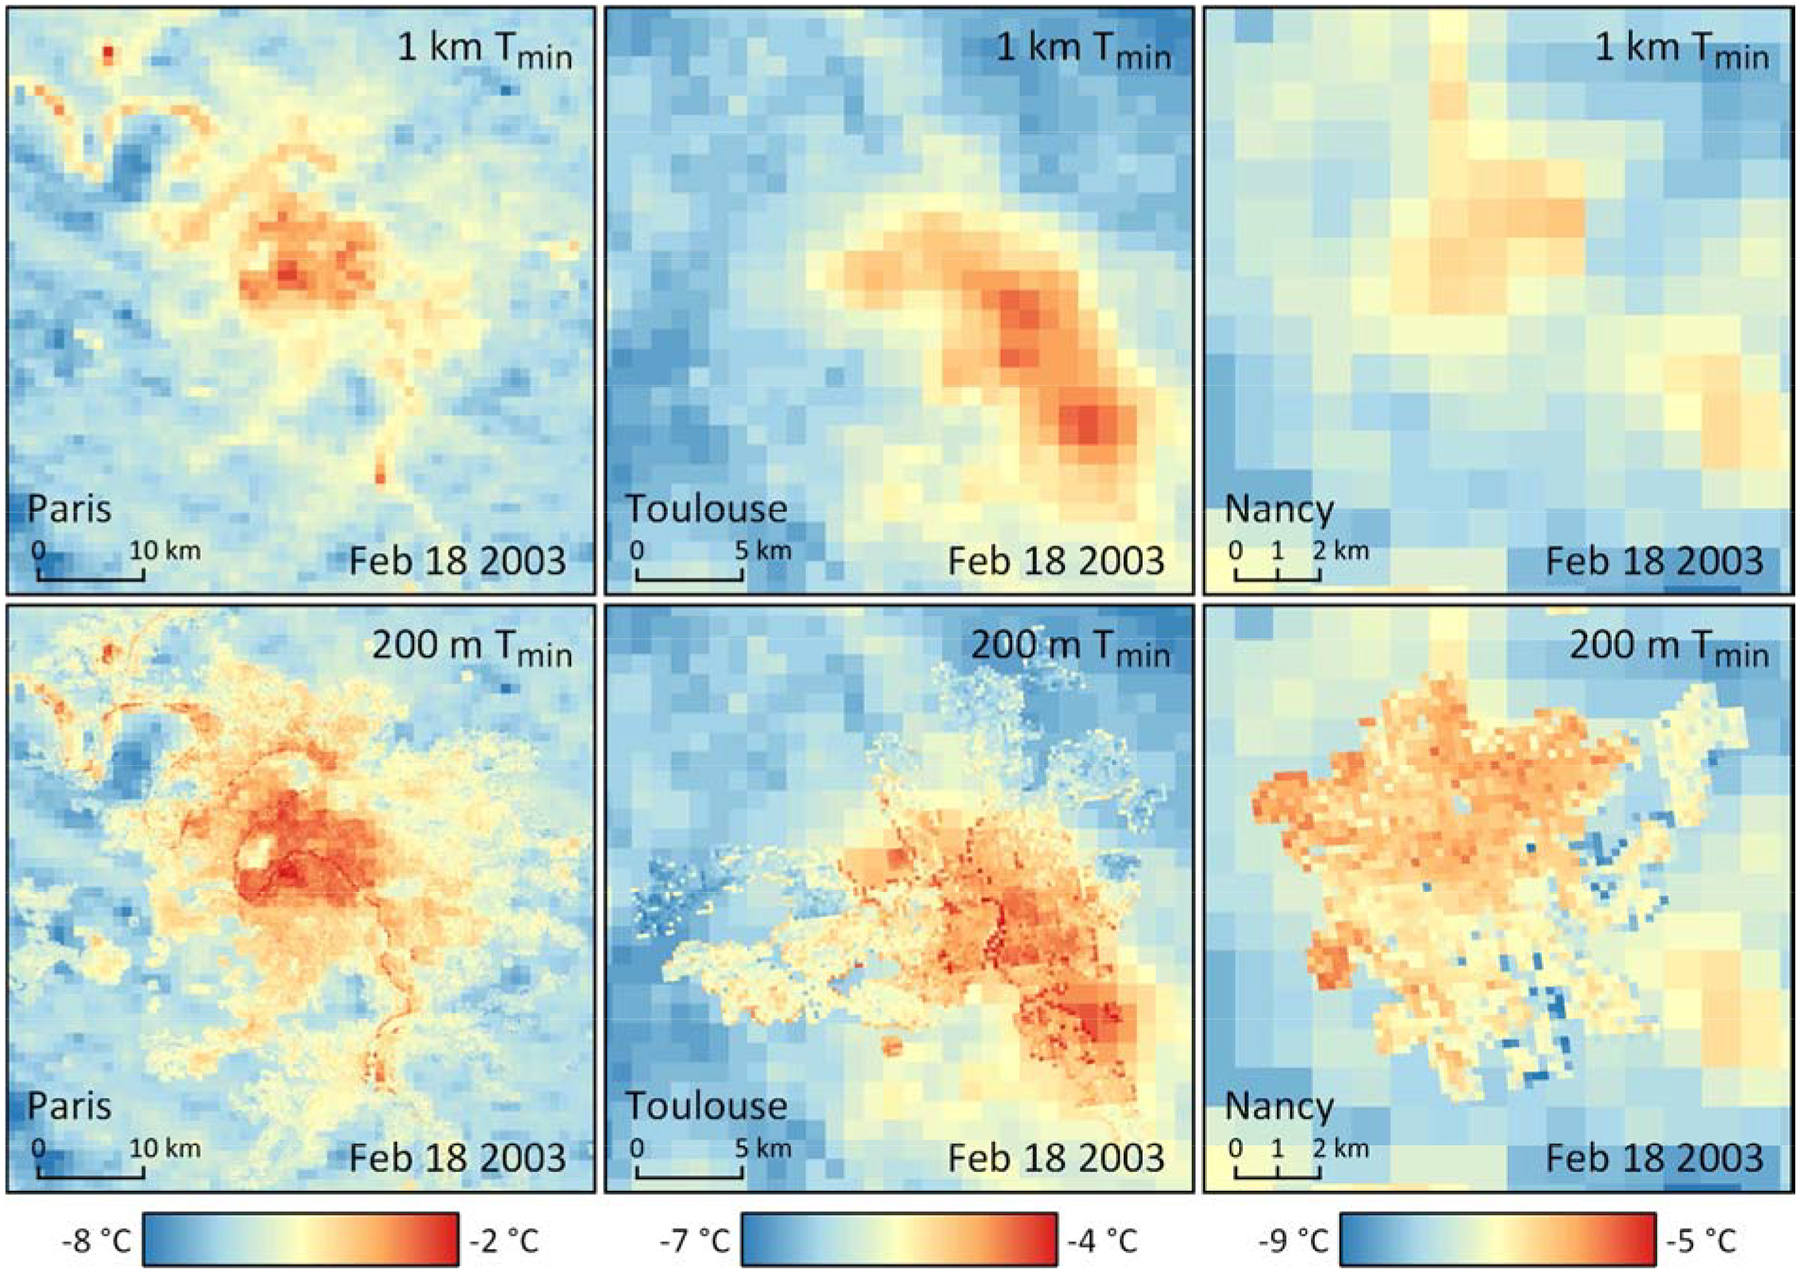
Understanding and managing the health effects of ambient temperature (Ta) in a warming, urbanizing world requires spatially- and temporally-resolved Ta at high resolutions. This is challenging in a large area like France which includes highly variable topography, rural areas with few weather stations, and heterogeneous urban areas where Ta can vary at fine spatial scales. We have modeled daily Ta from 2000 to 2016 at a base resolution of 1 km2 across continental France and at a 200 × 200 m2 resolution over large urban areas. For each day we predict three Ta measures: minimum (Tmin), mean (Tmean), and maximum (Tmax). We start by using linear mixed models to calibrate daily Ta observations from weather stations with remotely sensed MODIS land surface temperature (LST) and other spatial predictors (e.g. NDVI, elevation) on a 1 km2 grid. We fill gaps where LST is missing (e.g. due to cloud cover) with additional mixed models that capture the relationship between predicted Ta at each location and observed Ta at nearby weather stations. The resulting 1 km Ta models perform very well, with ten-fold cross-validated R2 of 0.92, 0.97, and 0.95, mean absolute error (MAE) of 1.4 °C, 0.9 °C, and 1.4 °C, and root mean square error (RMSE) of 1.9 °C, 1.3 °C, and 1.8 °C (Tmin, Tmean, and Tmax, respectively) for the initial calibration stage. To increase the spatial resolution over large urban areas, we train random forest and extreme gradient boosting models to predict the residuals (R) of the 1 km Ta predictions on a 200 × 200 m2 grid. In this stage we replace MODIS LST and NDVI with composited top-of-atmosphere brightness temperature and NDVI from the Landsat 5, 7, and 8 satellites. We use a generalized additive model to ensemble the random forest and extreme gradient boosting predictions with weights that vary spatially and by the magnitude of the predicted residual. The 200 m models also perform well, with ten-fold cross-validated R2 of 0.79, 0.79, and 0.85, MAE of 0.4, 0.3, and 0.3, and RMSE of 0.6, 0.4, and 0.5 (Rmin, Rmean, and Rmax, respectively). Our model will reduce bias in epidemiological studies in France by improving Ta exposure assessment in both urban and rural areas, and our methodology demonstrates that MODIS and Landsat thermal data can be used to generate gap-free timeseries of daily minimum, maximum, and mean Ta at a 200 × 200 m2 spatial resolution.
Keywords: Air temperature; Exposure error; Land surface temperature; Landsat; MODIS.
Copyright © 2020 Elsevier Inc. All rights reserved.
Conflict of interest statement
Declaration of competing interest None.
Figures
References
-
- Arnfield AJ, 2003. Two decades of urban climate research: A review of turbulence, exchanges of energy and water, and the urban heat island. Int. J. Climatol 23, 1–26. 10.1002/joc.859 - DOI
-
- Bechtel B, Zakšek K, Oßenbrügge J, Kaveckis G, Böhner J, 2017. Towards a satellite based monitoring of urban air temperatures. Sustain. Cities Soc 34, 22–31. 10.1016/j.scs.2017.05.018 - DOI
-
- Bischl B, Lang M, Kotthoff L, Schiffner J, Richter J, Studerus E, Casalicchio G, Jones ZM, 2016. Mlr: Machine learning in R. J. Mach. Learn. Res 17, 1–5.
-
- Bischl B, Richter J, Bossek J, Horn D, Thomas J, Lang M, 2017. mlrMBO: A Modular Framework for Model-Based Optimization of Expensive Black-Box Functions. 10.13140/RG.2.2.11865.31849 - DOI
Publication types
MeSH terms
Grants and funding
LinkOut - more resources
Full Text Sources
Miscellaneous
