. 2020 May:87:102181.
doi: 10.1016/j.ceca.2020.102181. Epub 2020 Feb 22.

Divalent cation influx and calcium homeostasis in germinal vesicle mouse oocytes

Affiliations

Divalent cation influx and calcium homeostasis in germinal vesicle mouse oocytes

Goli Ardestani et al. Cell Calcium. 2020 May.

Abstract

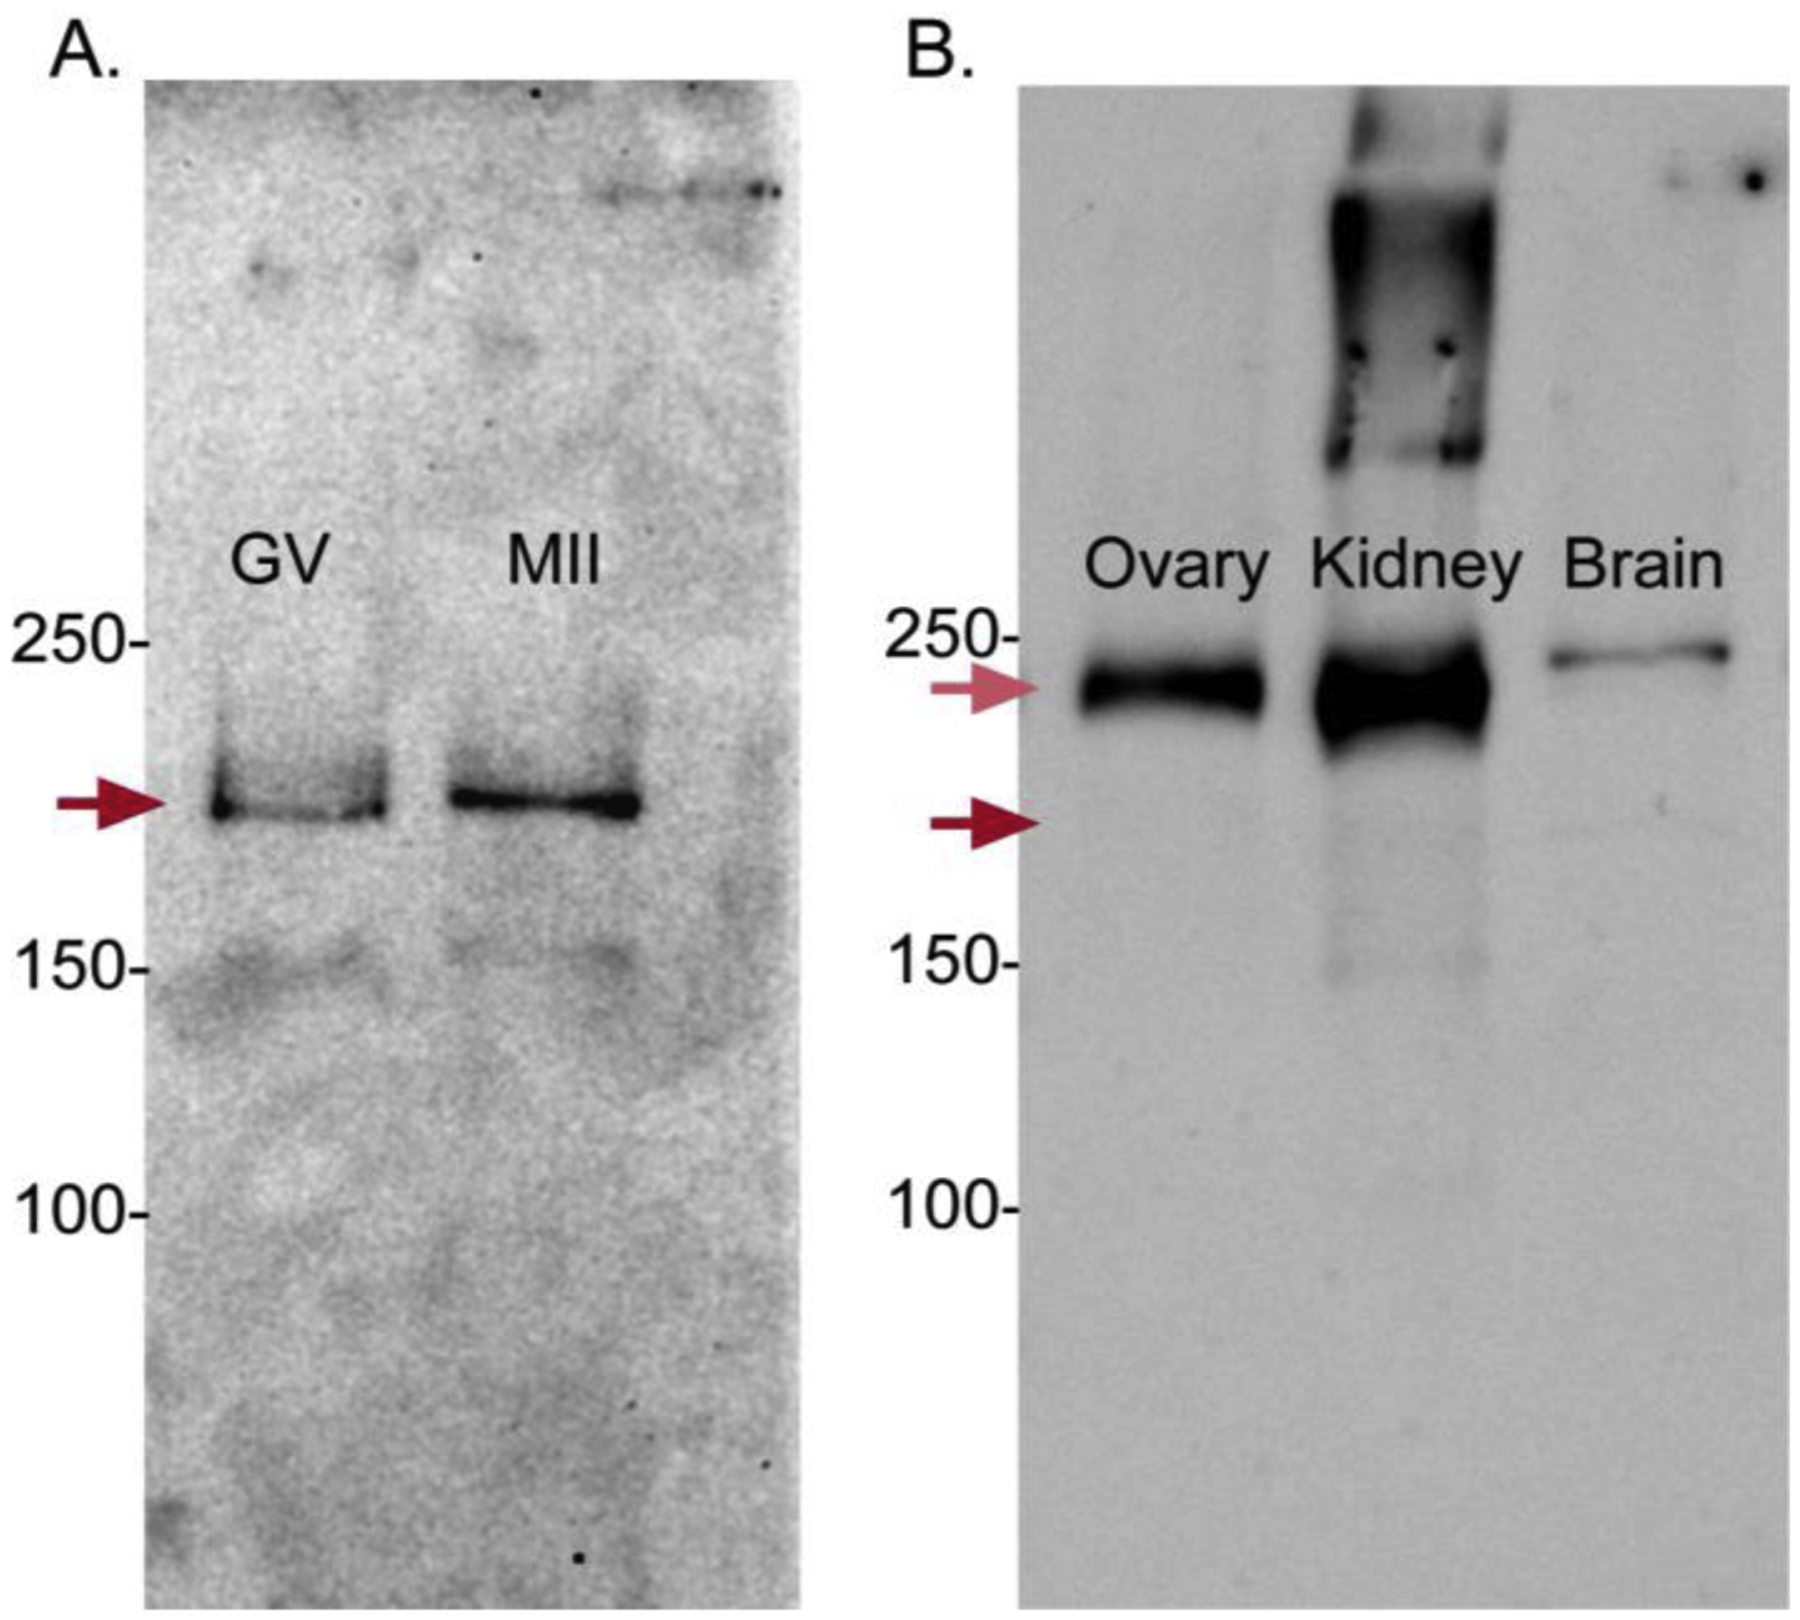
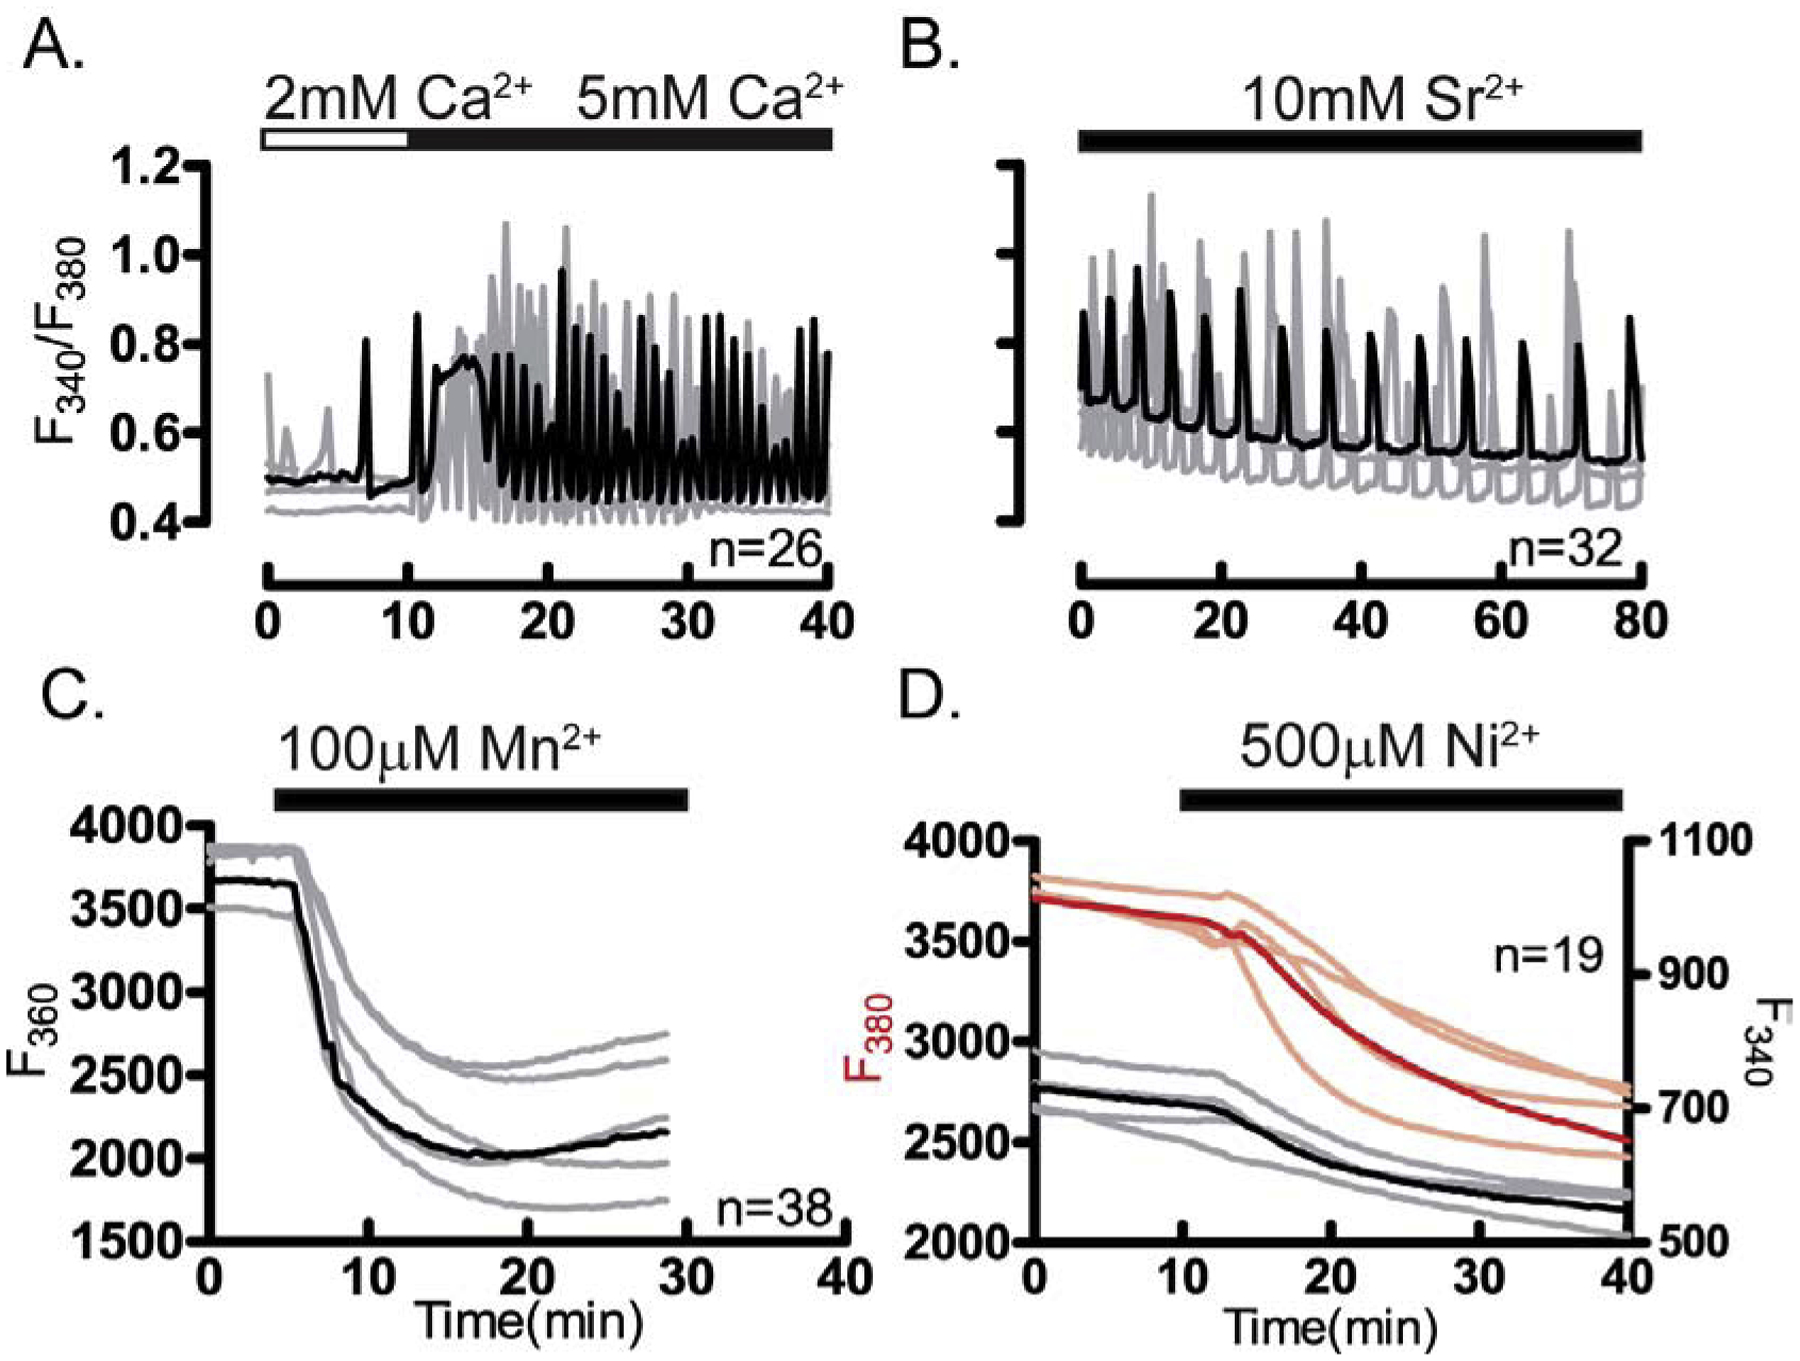
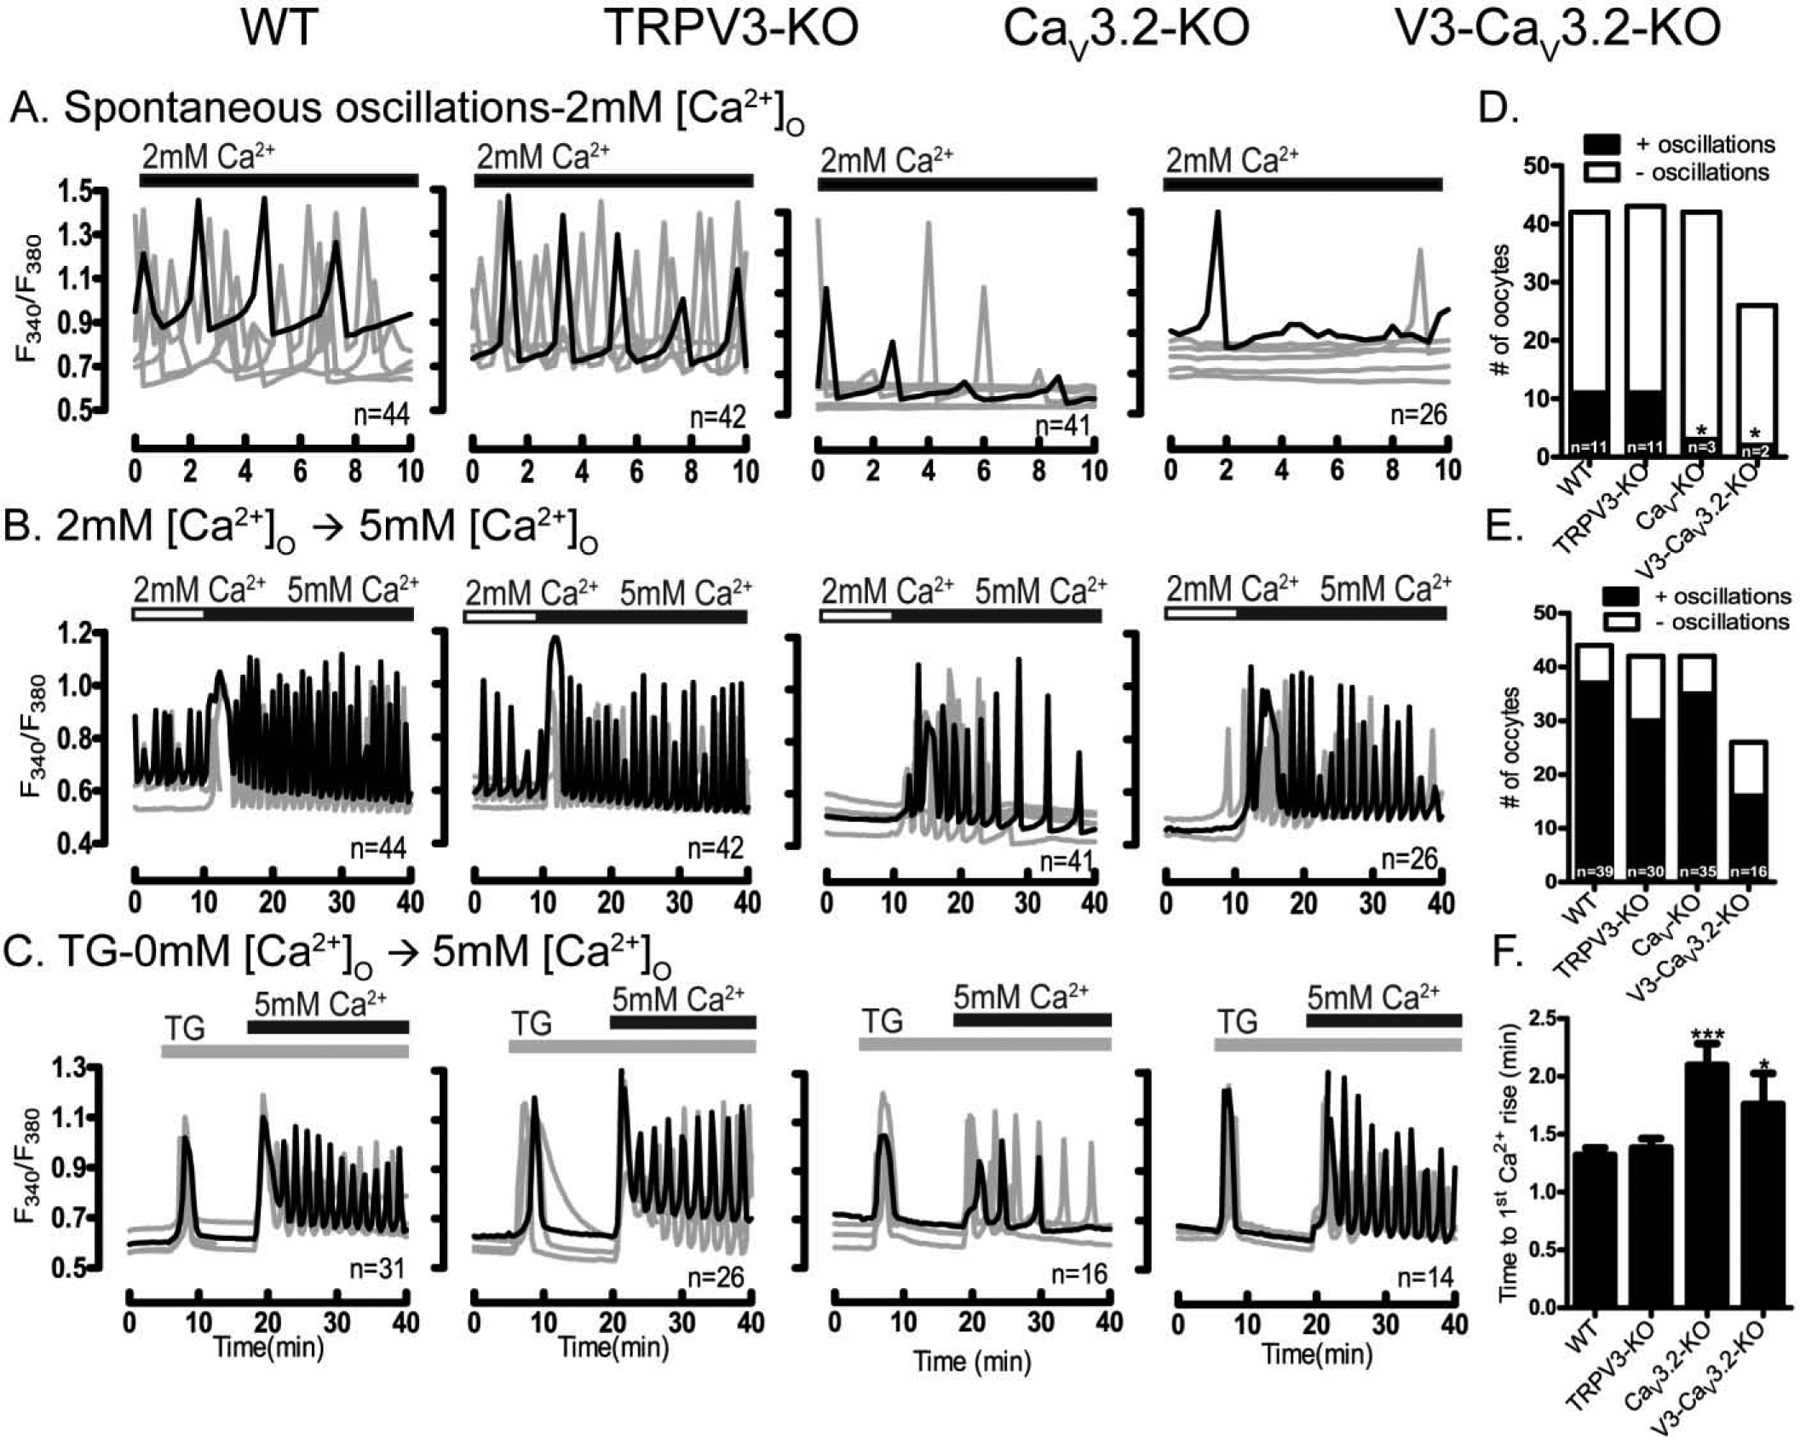
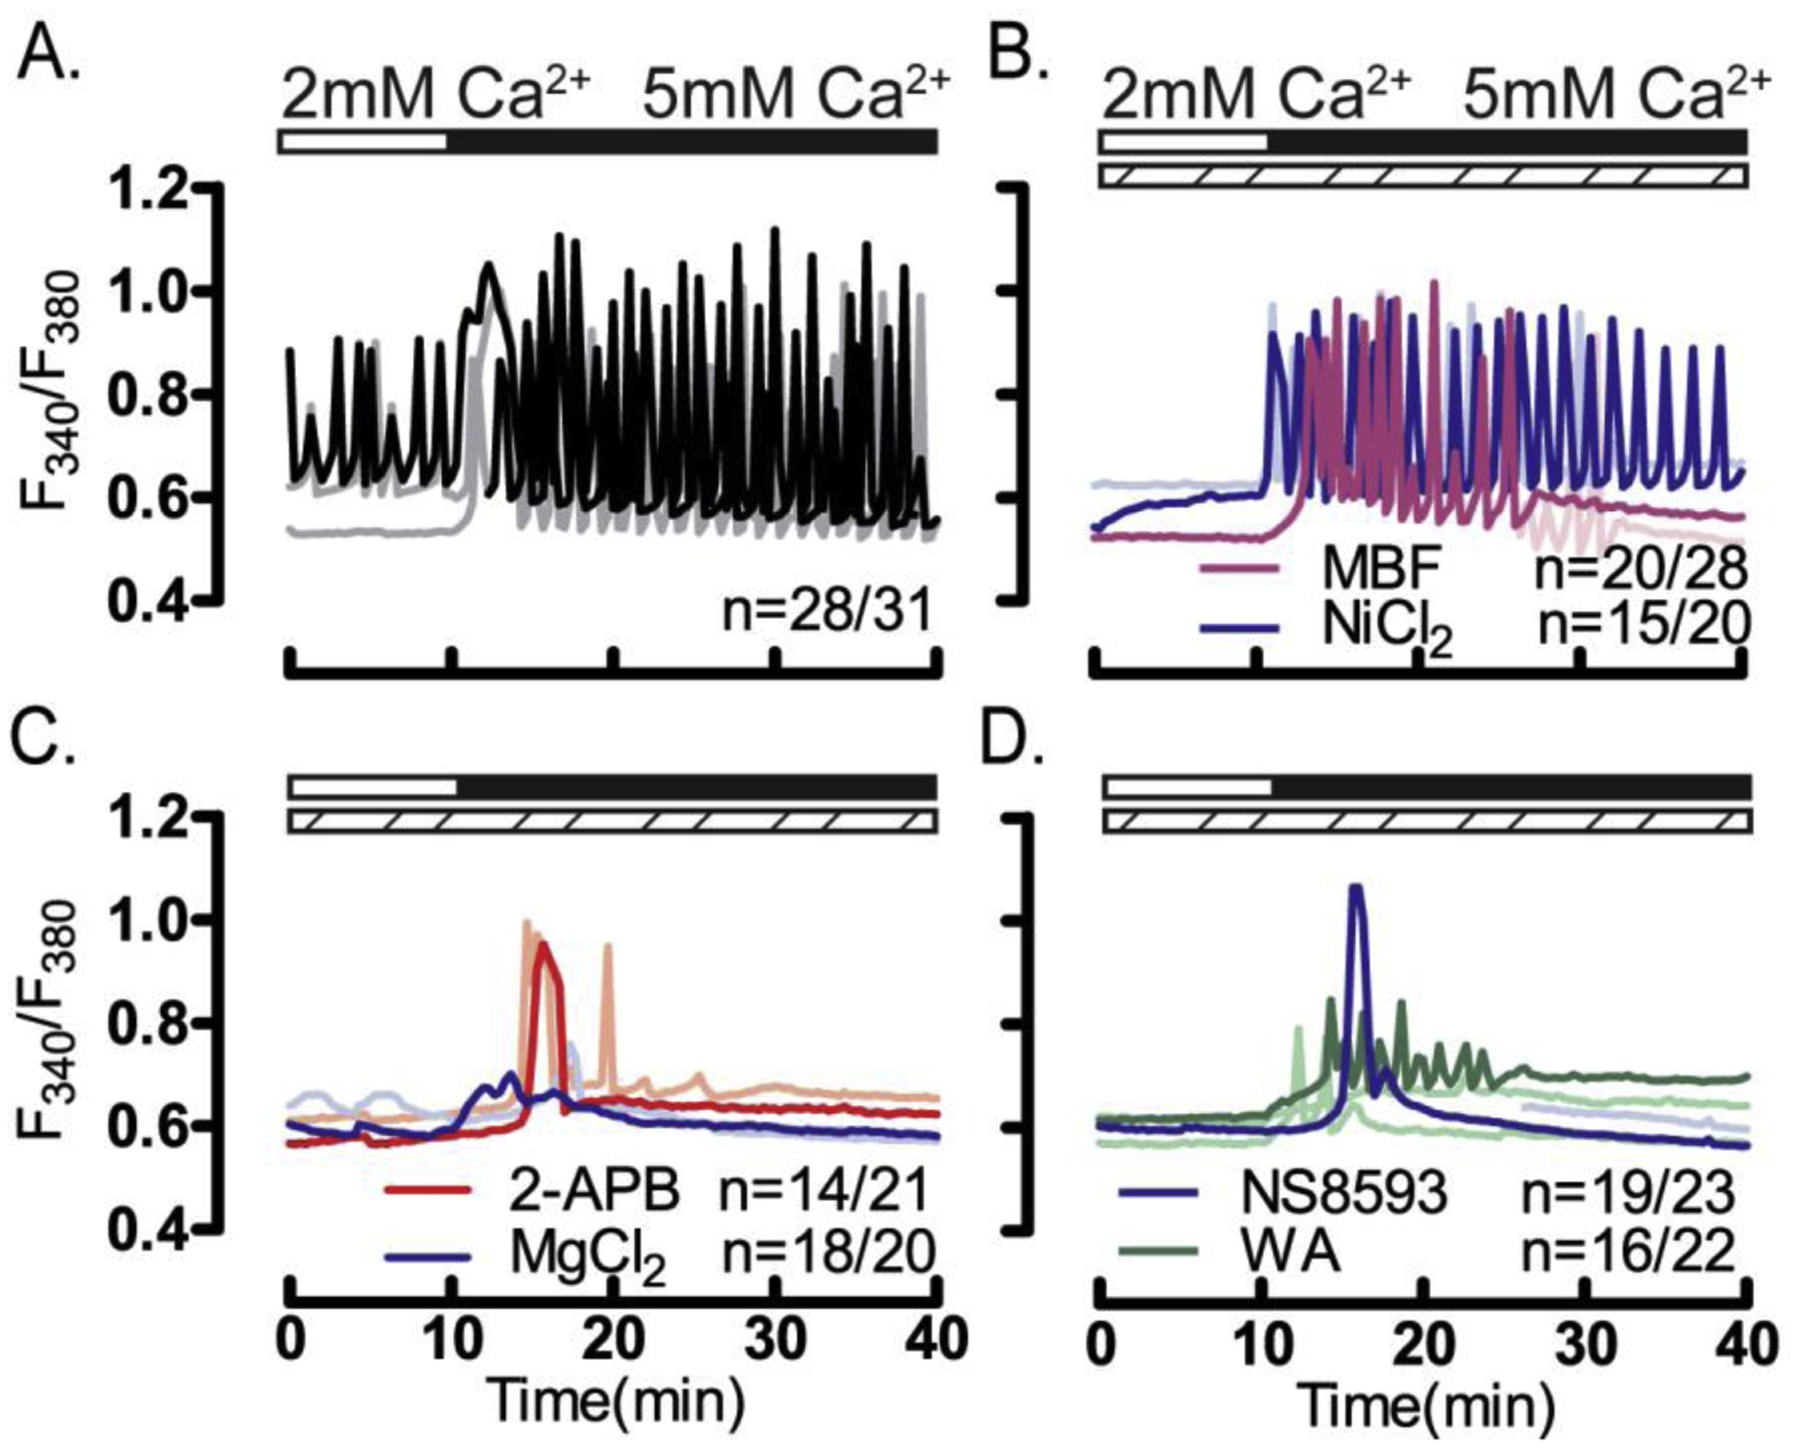
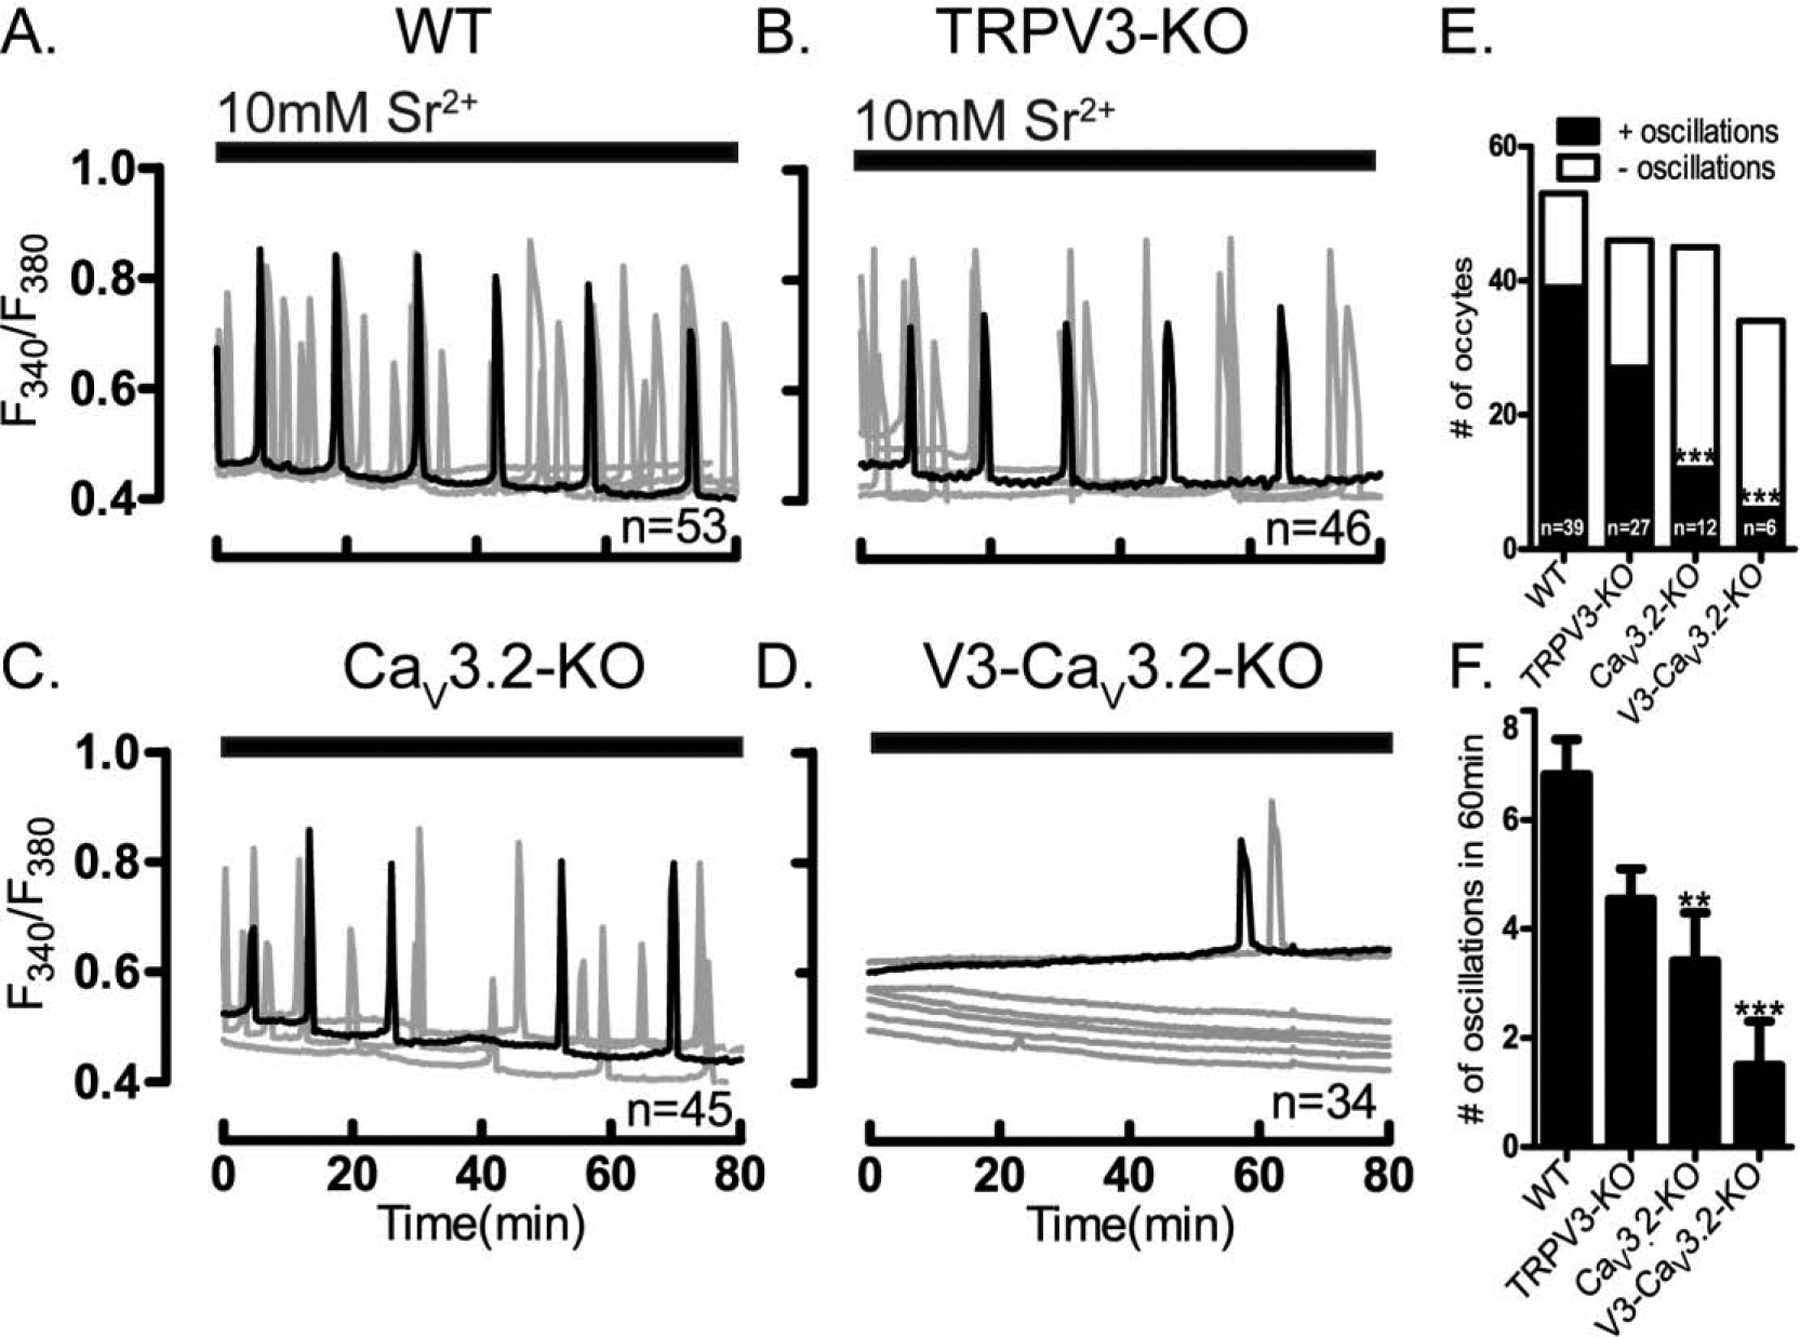
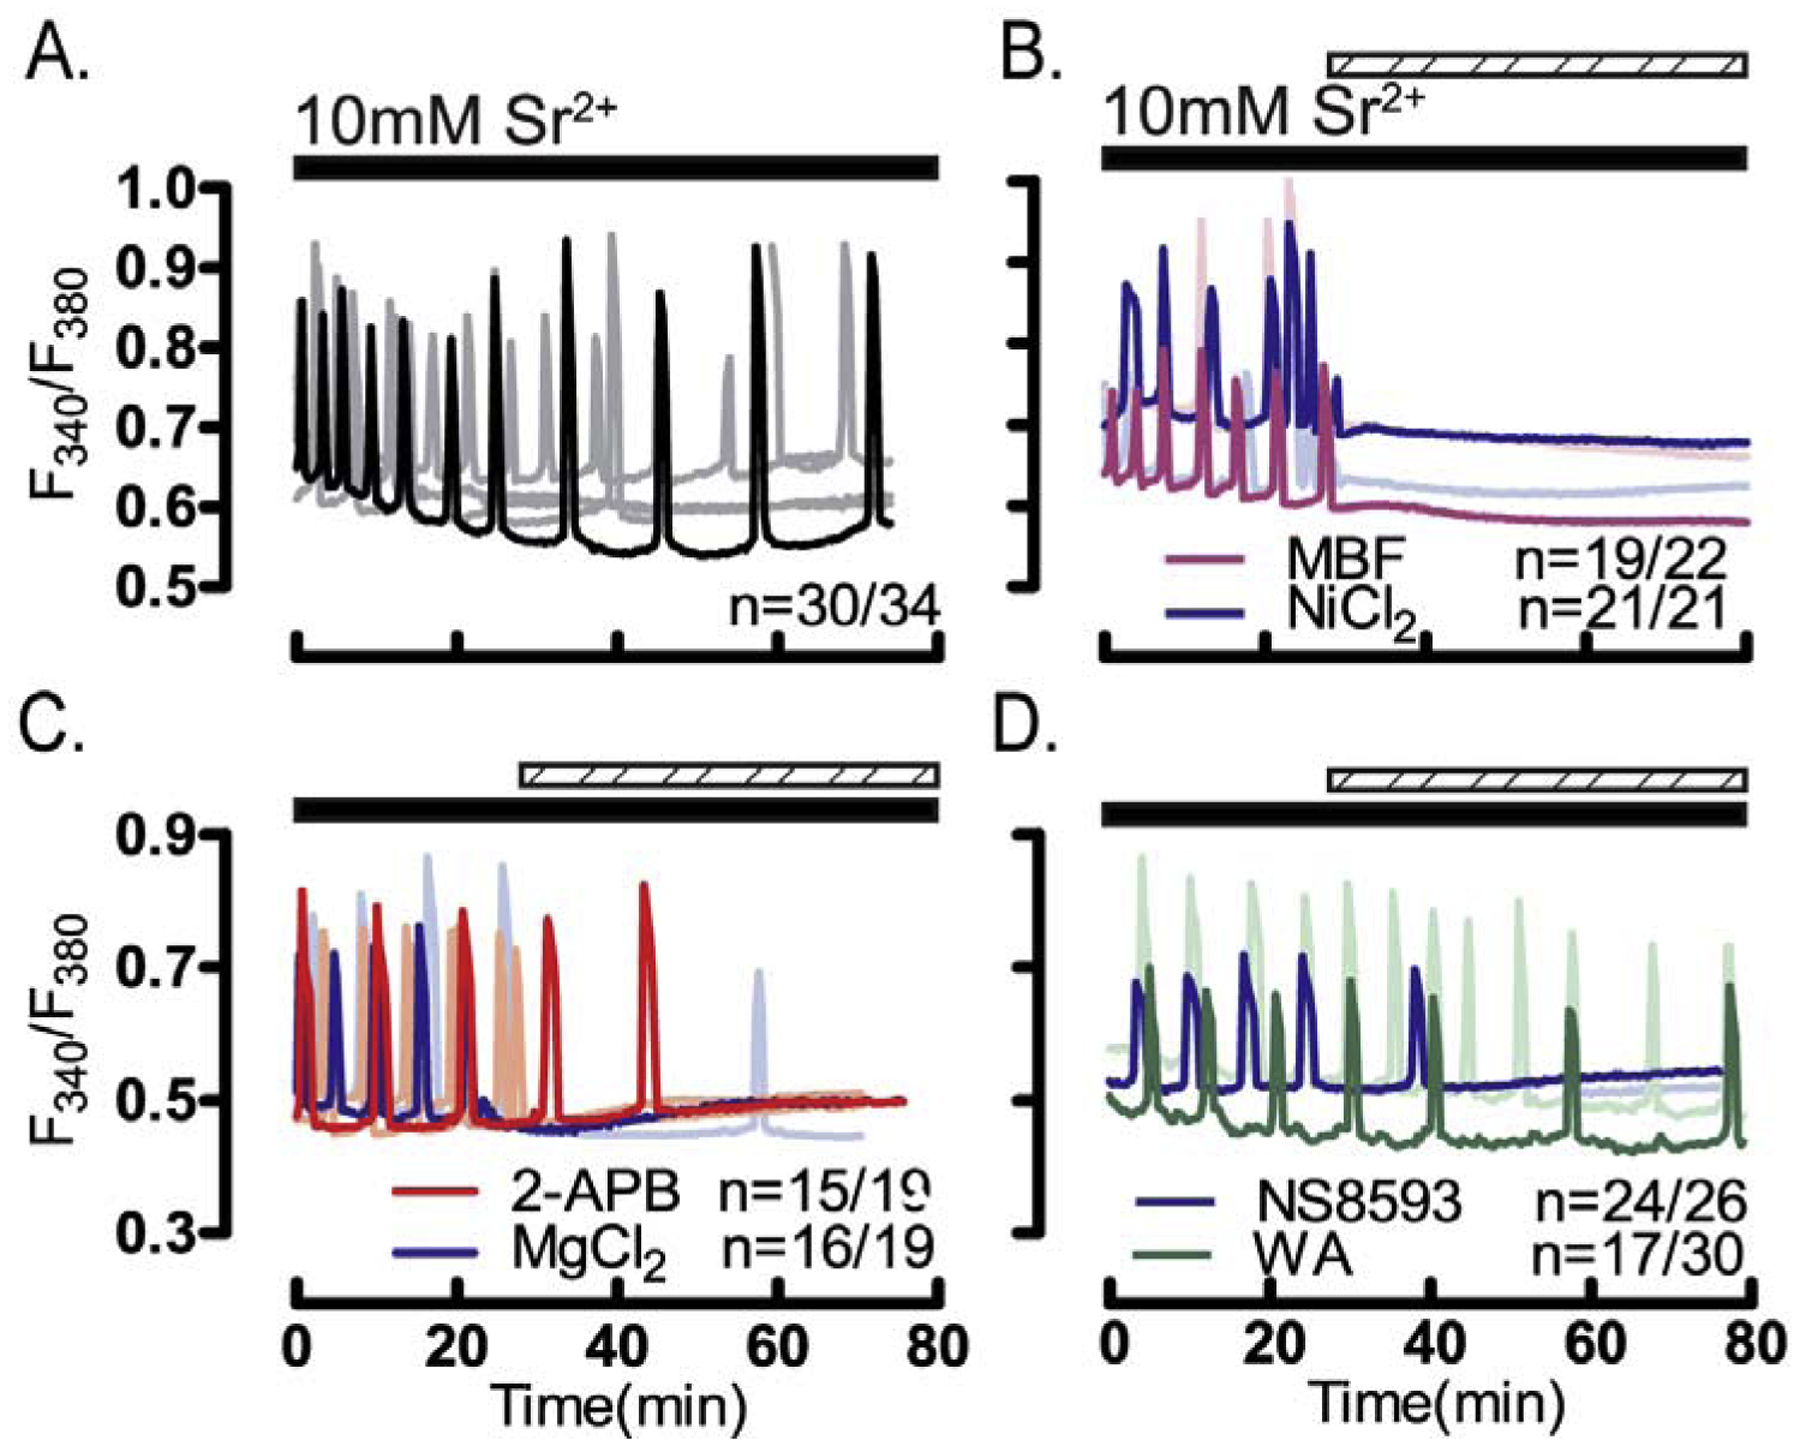
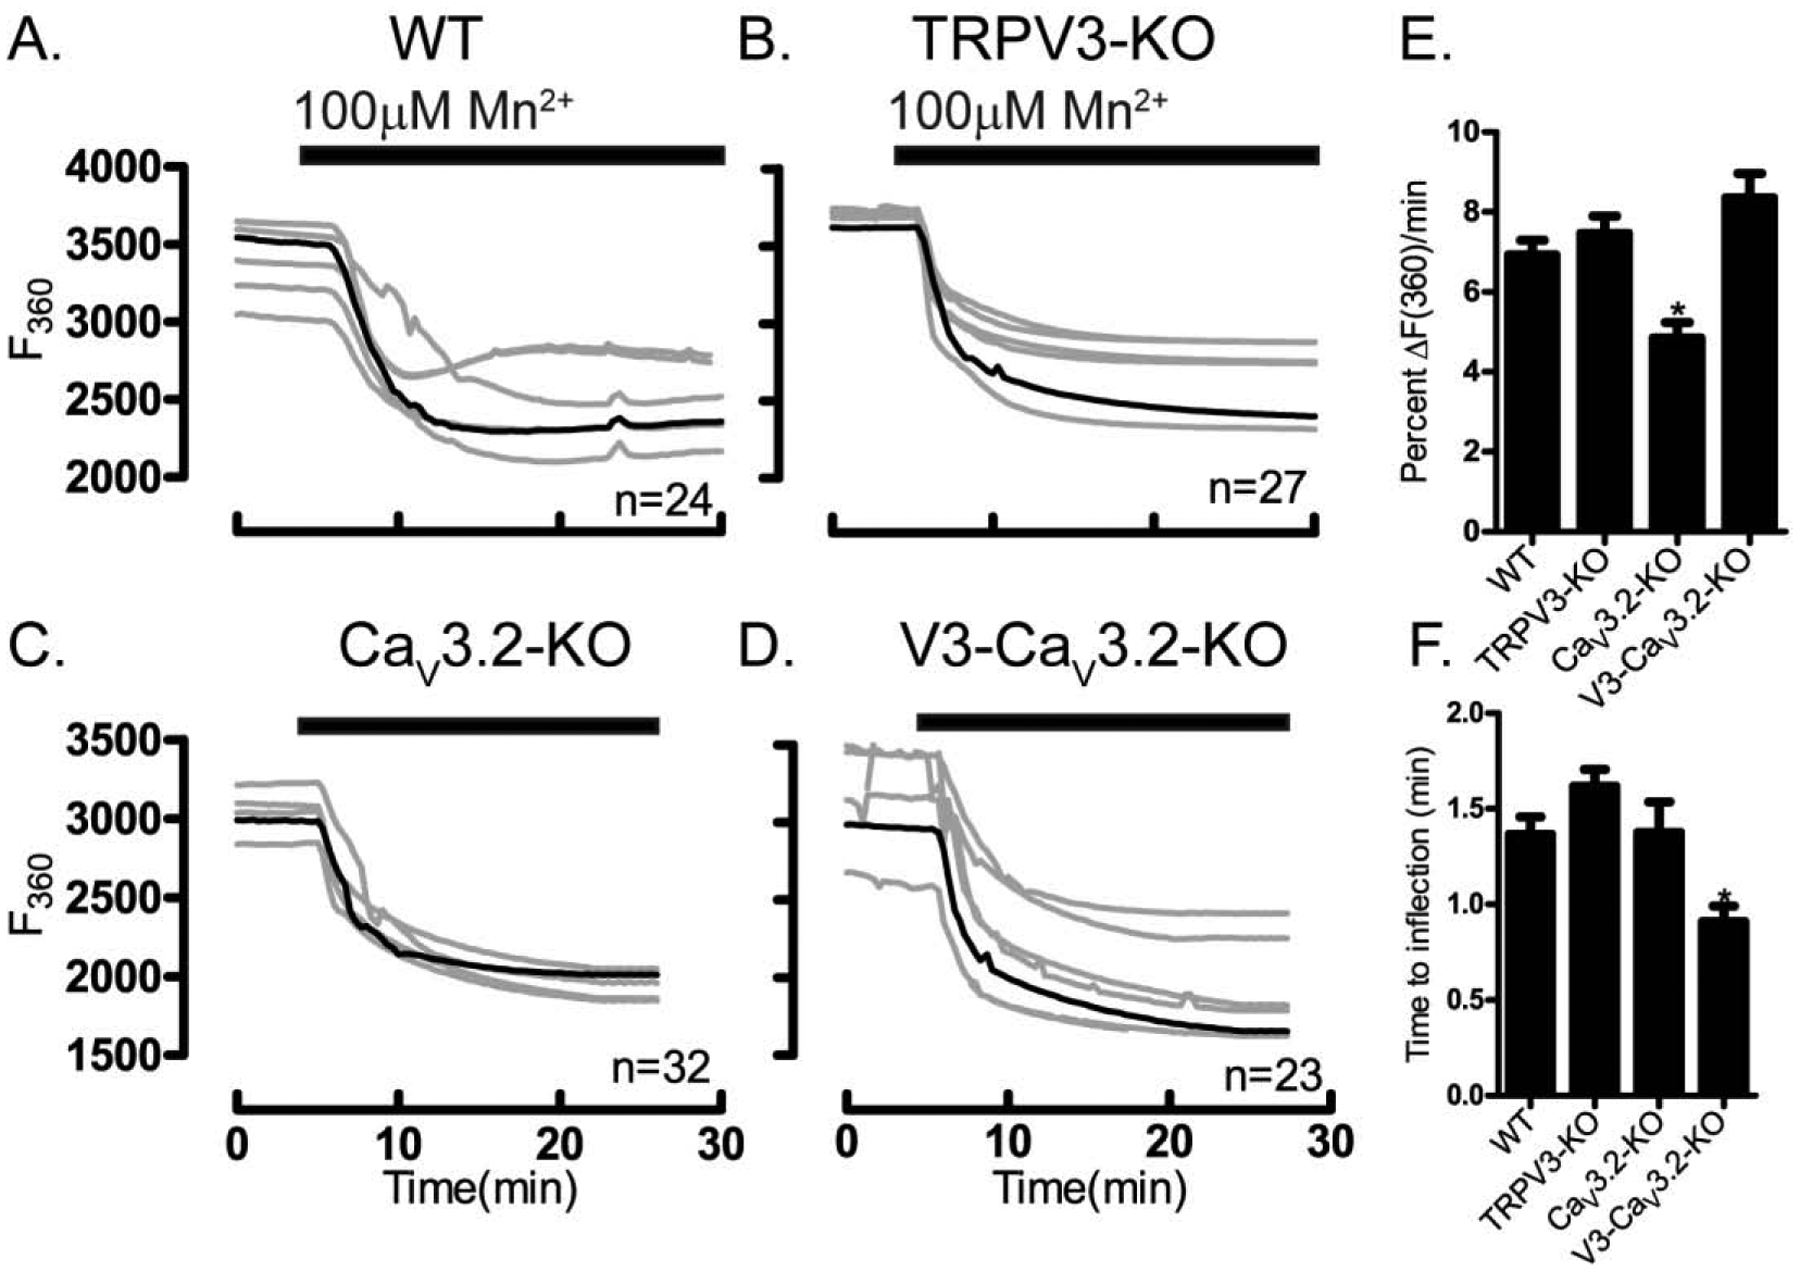
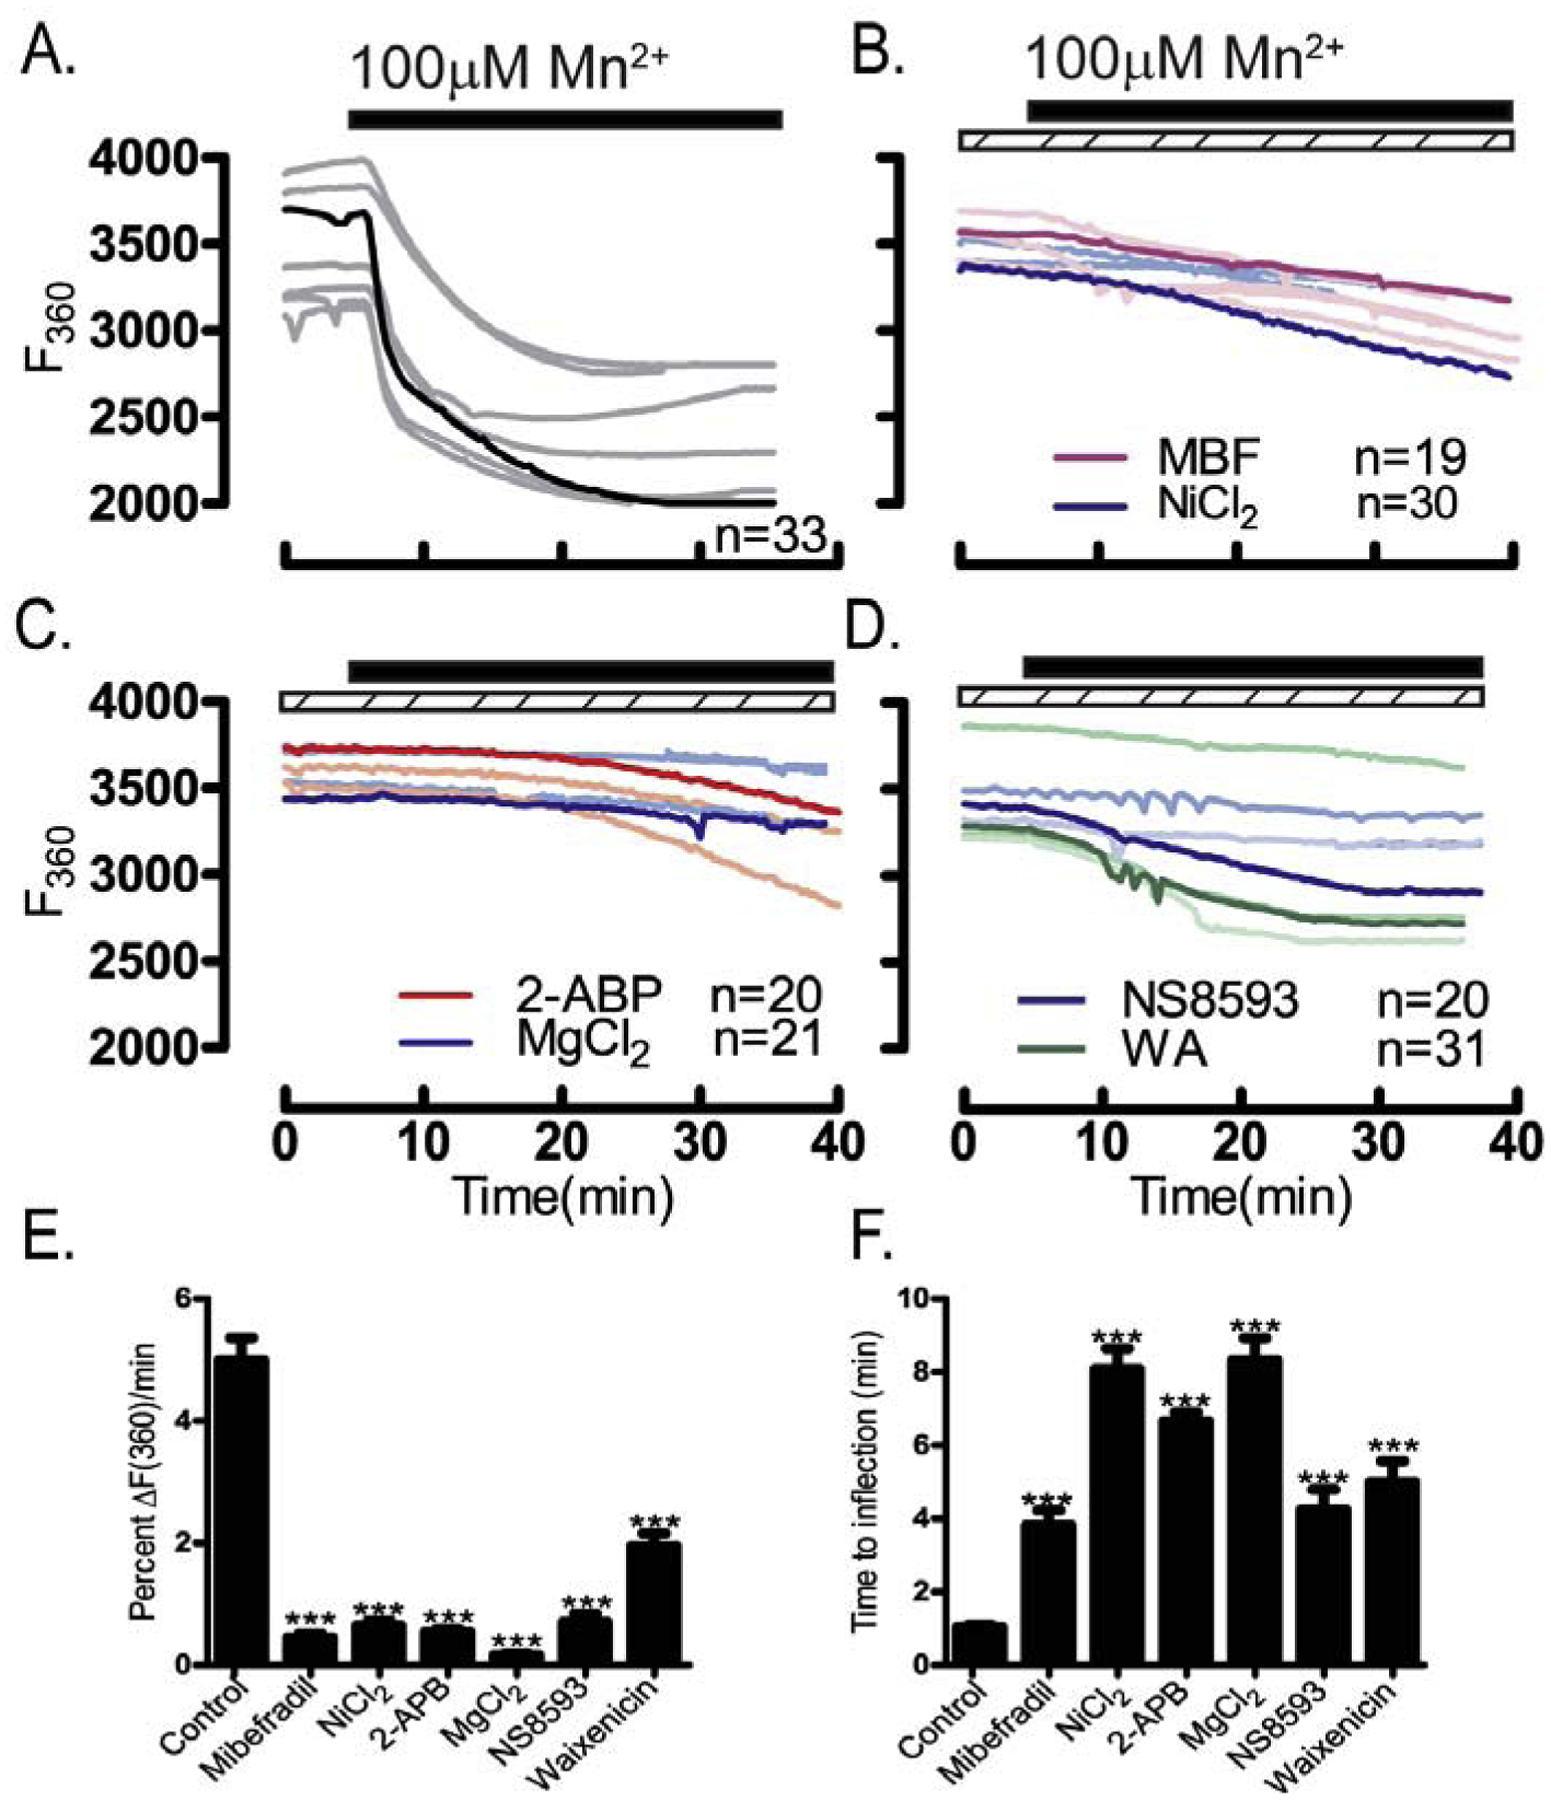
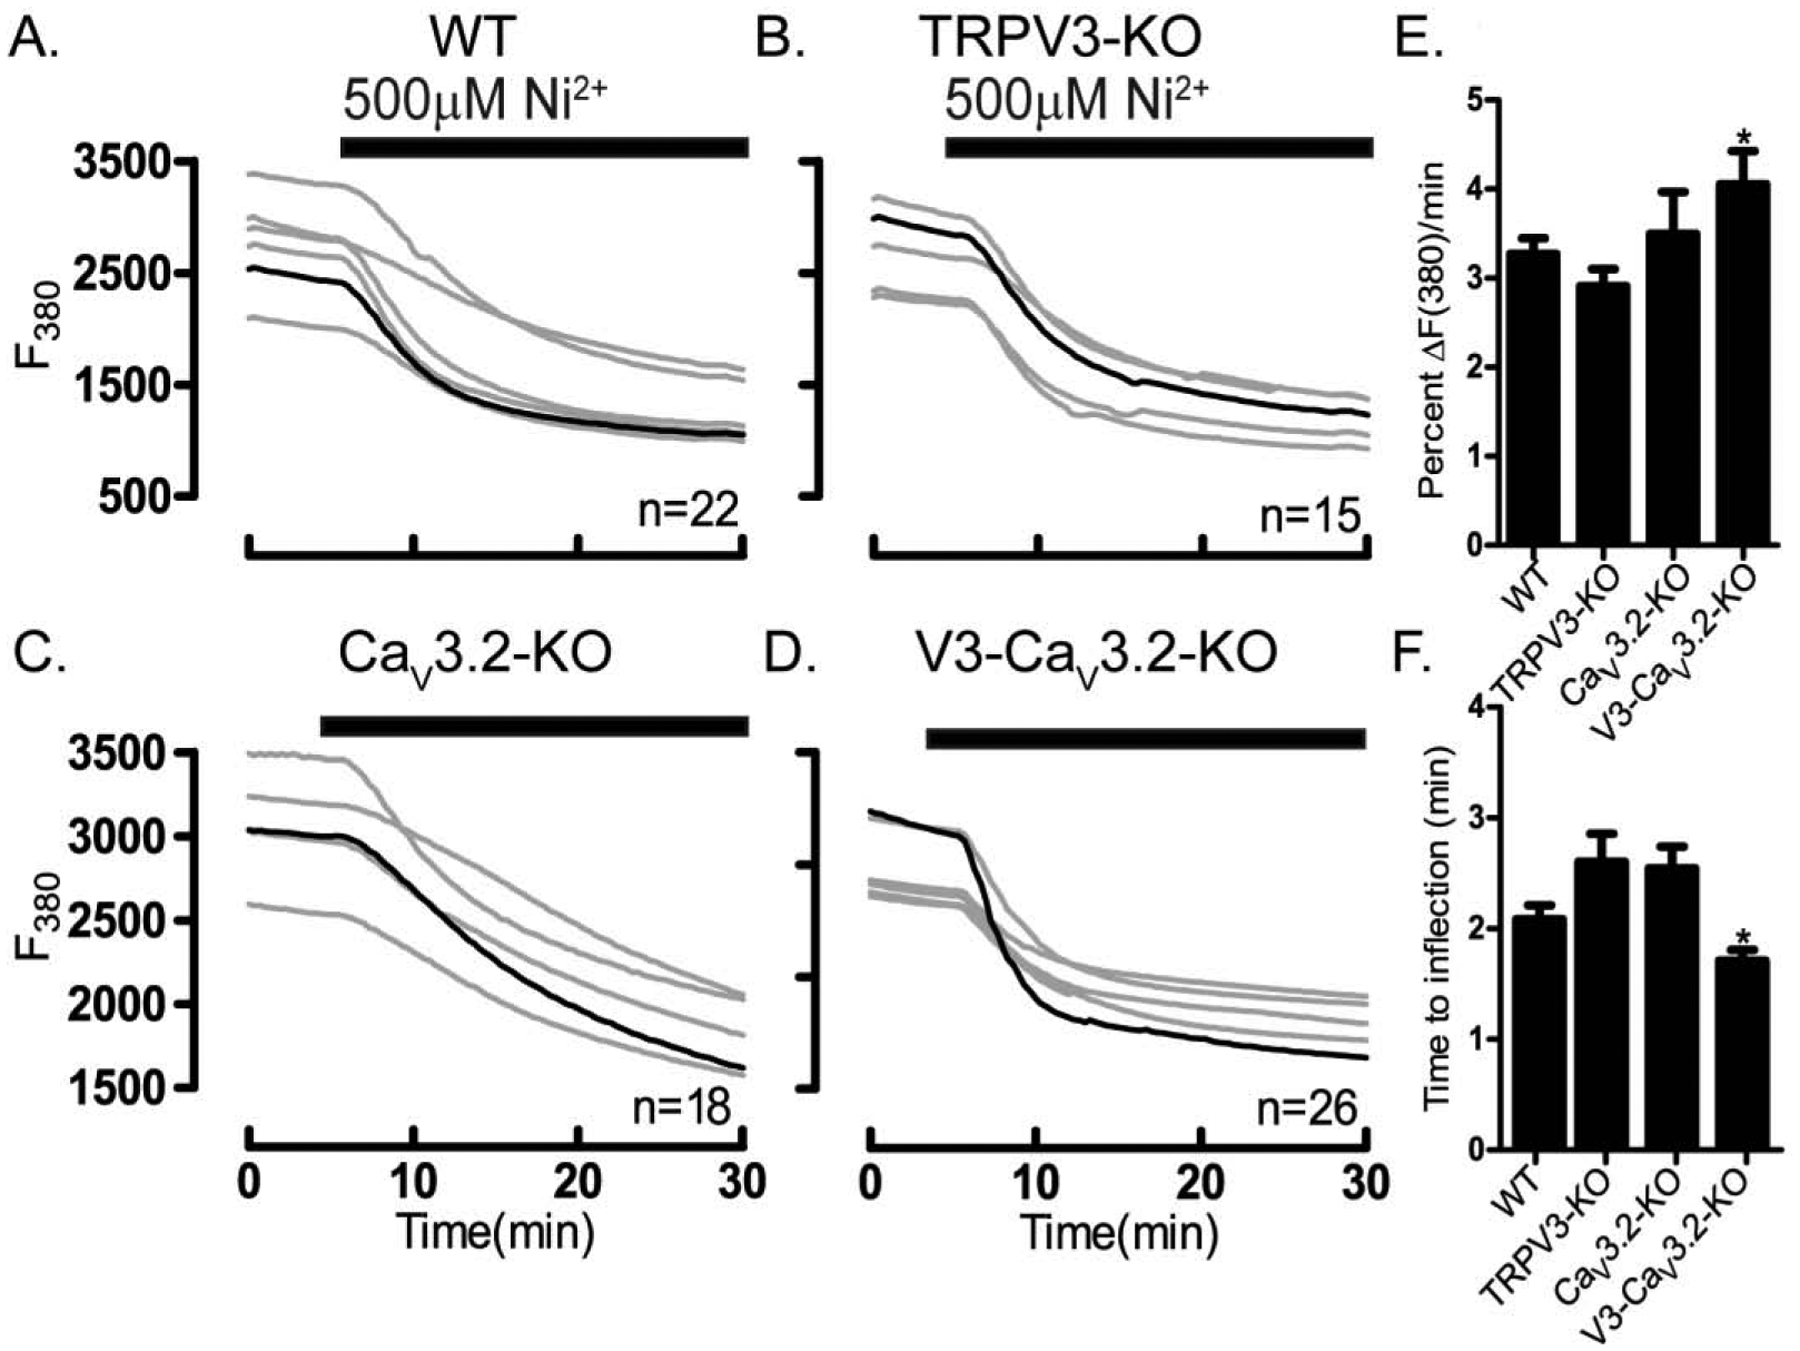
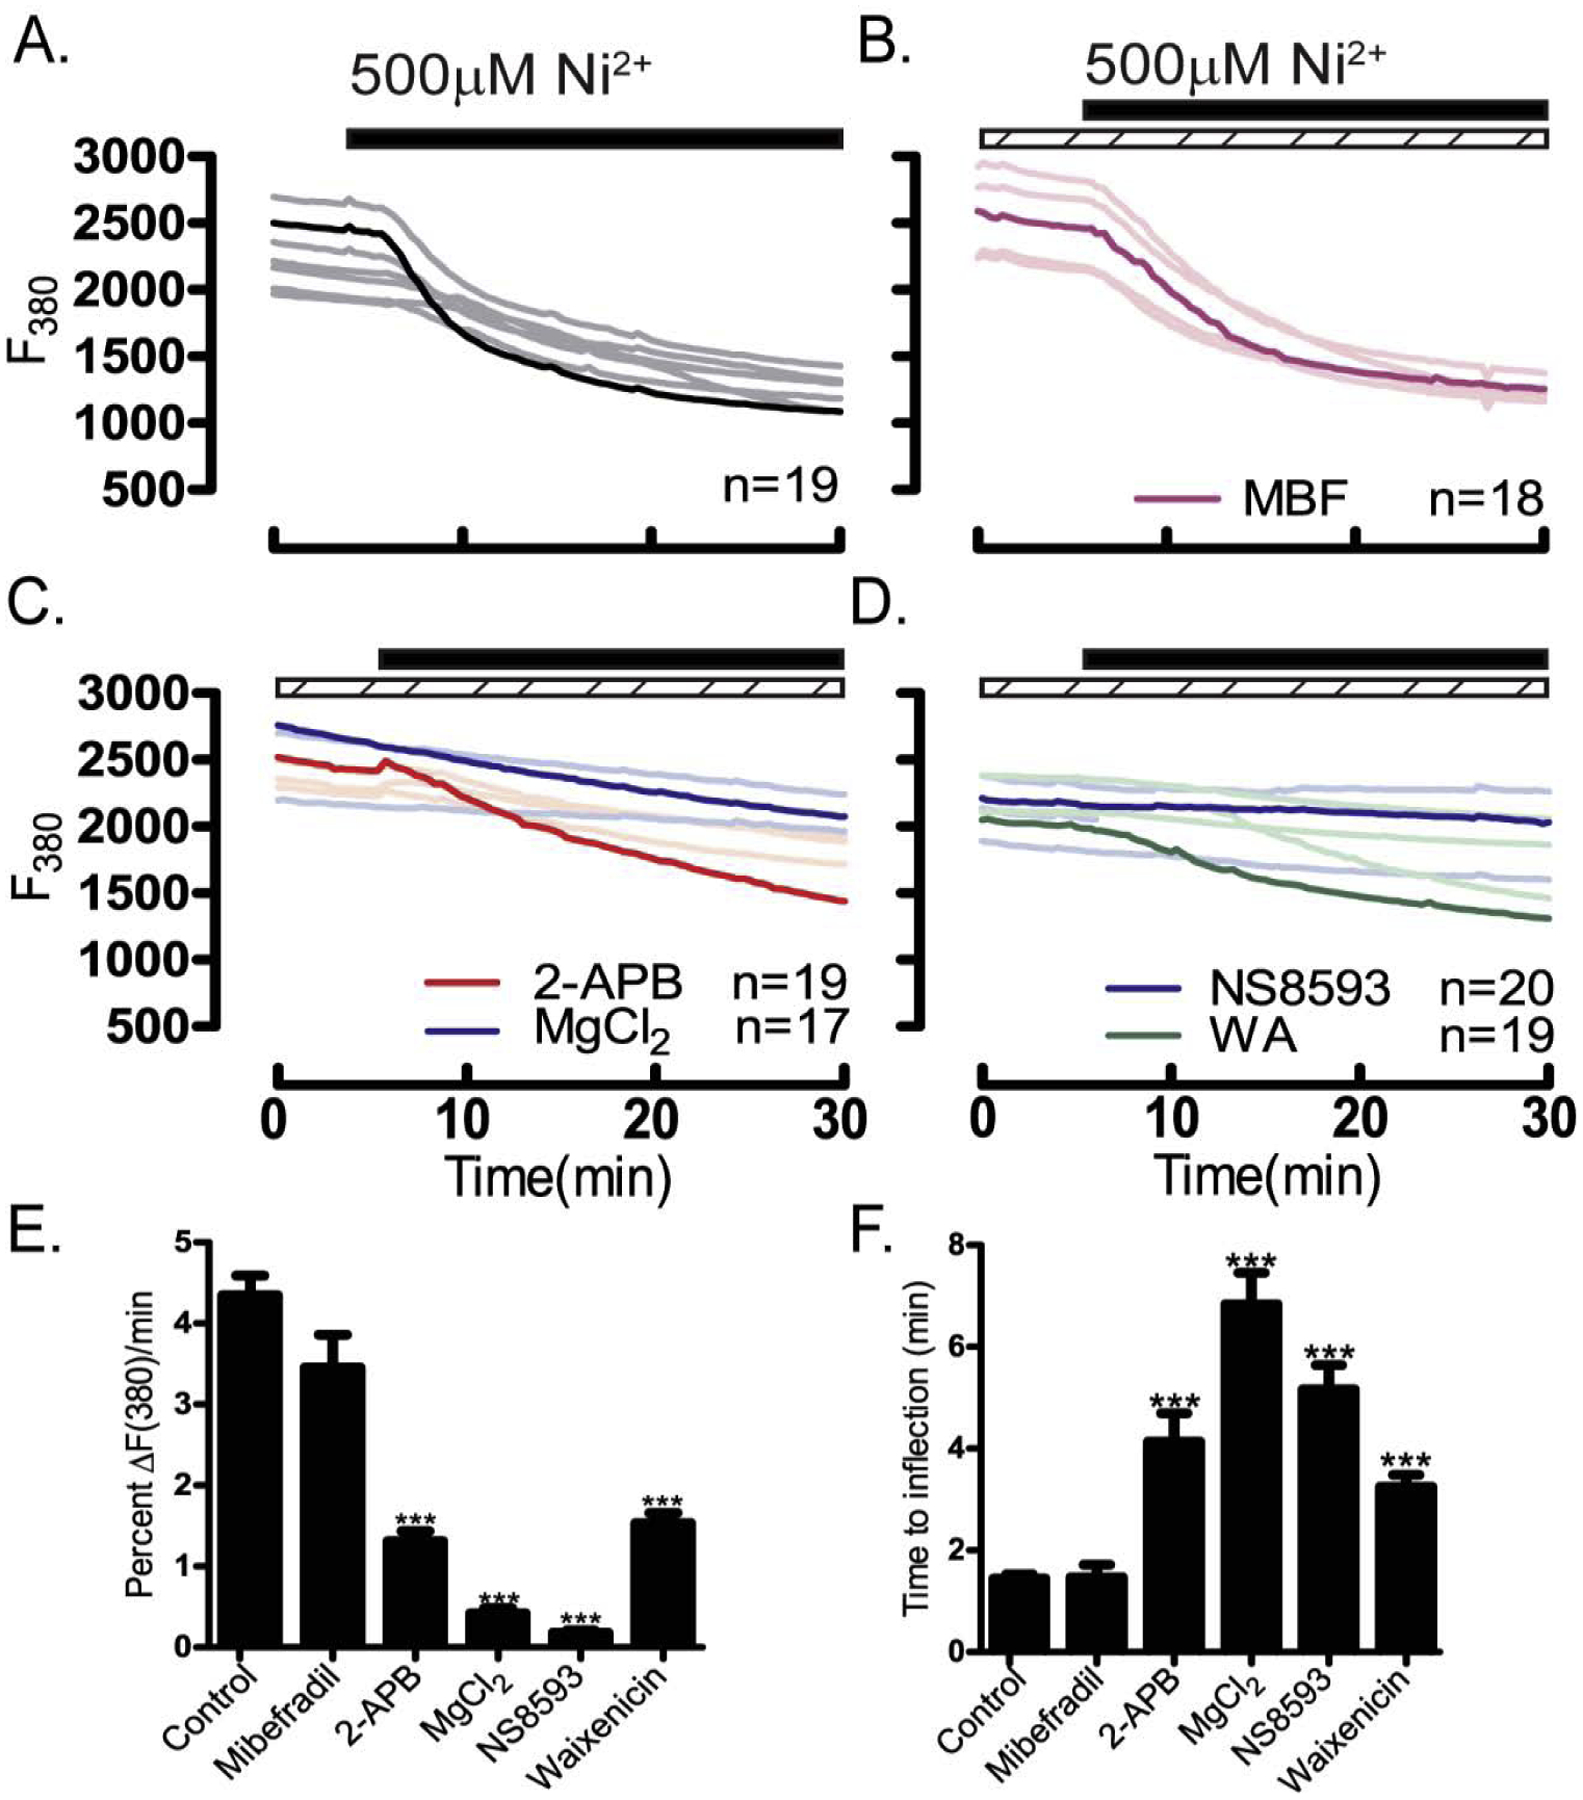
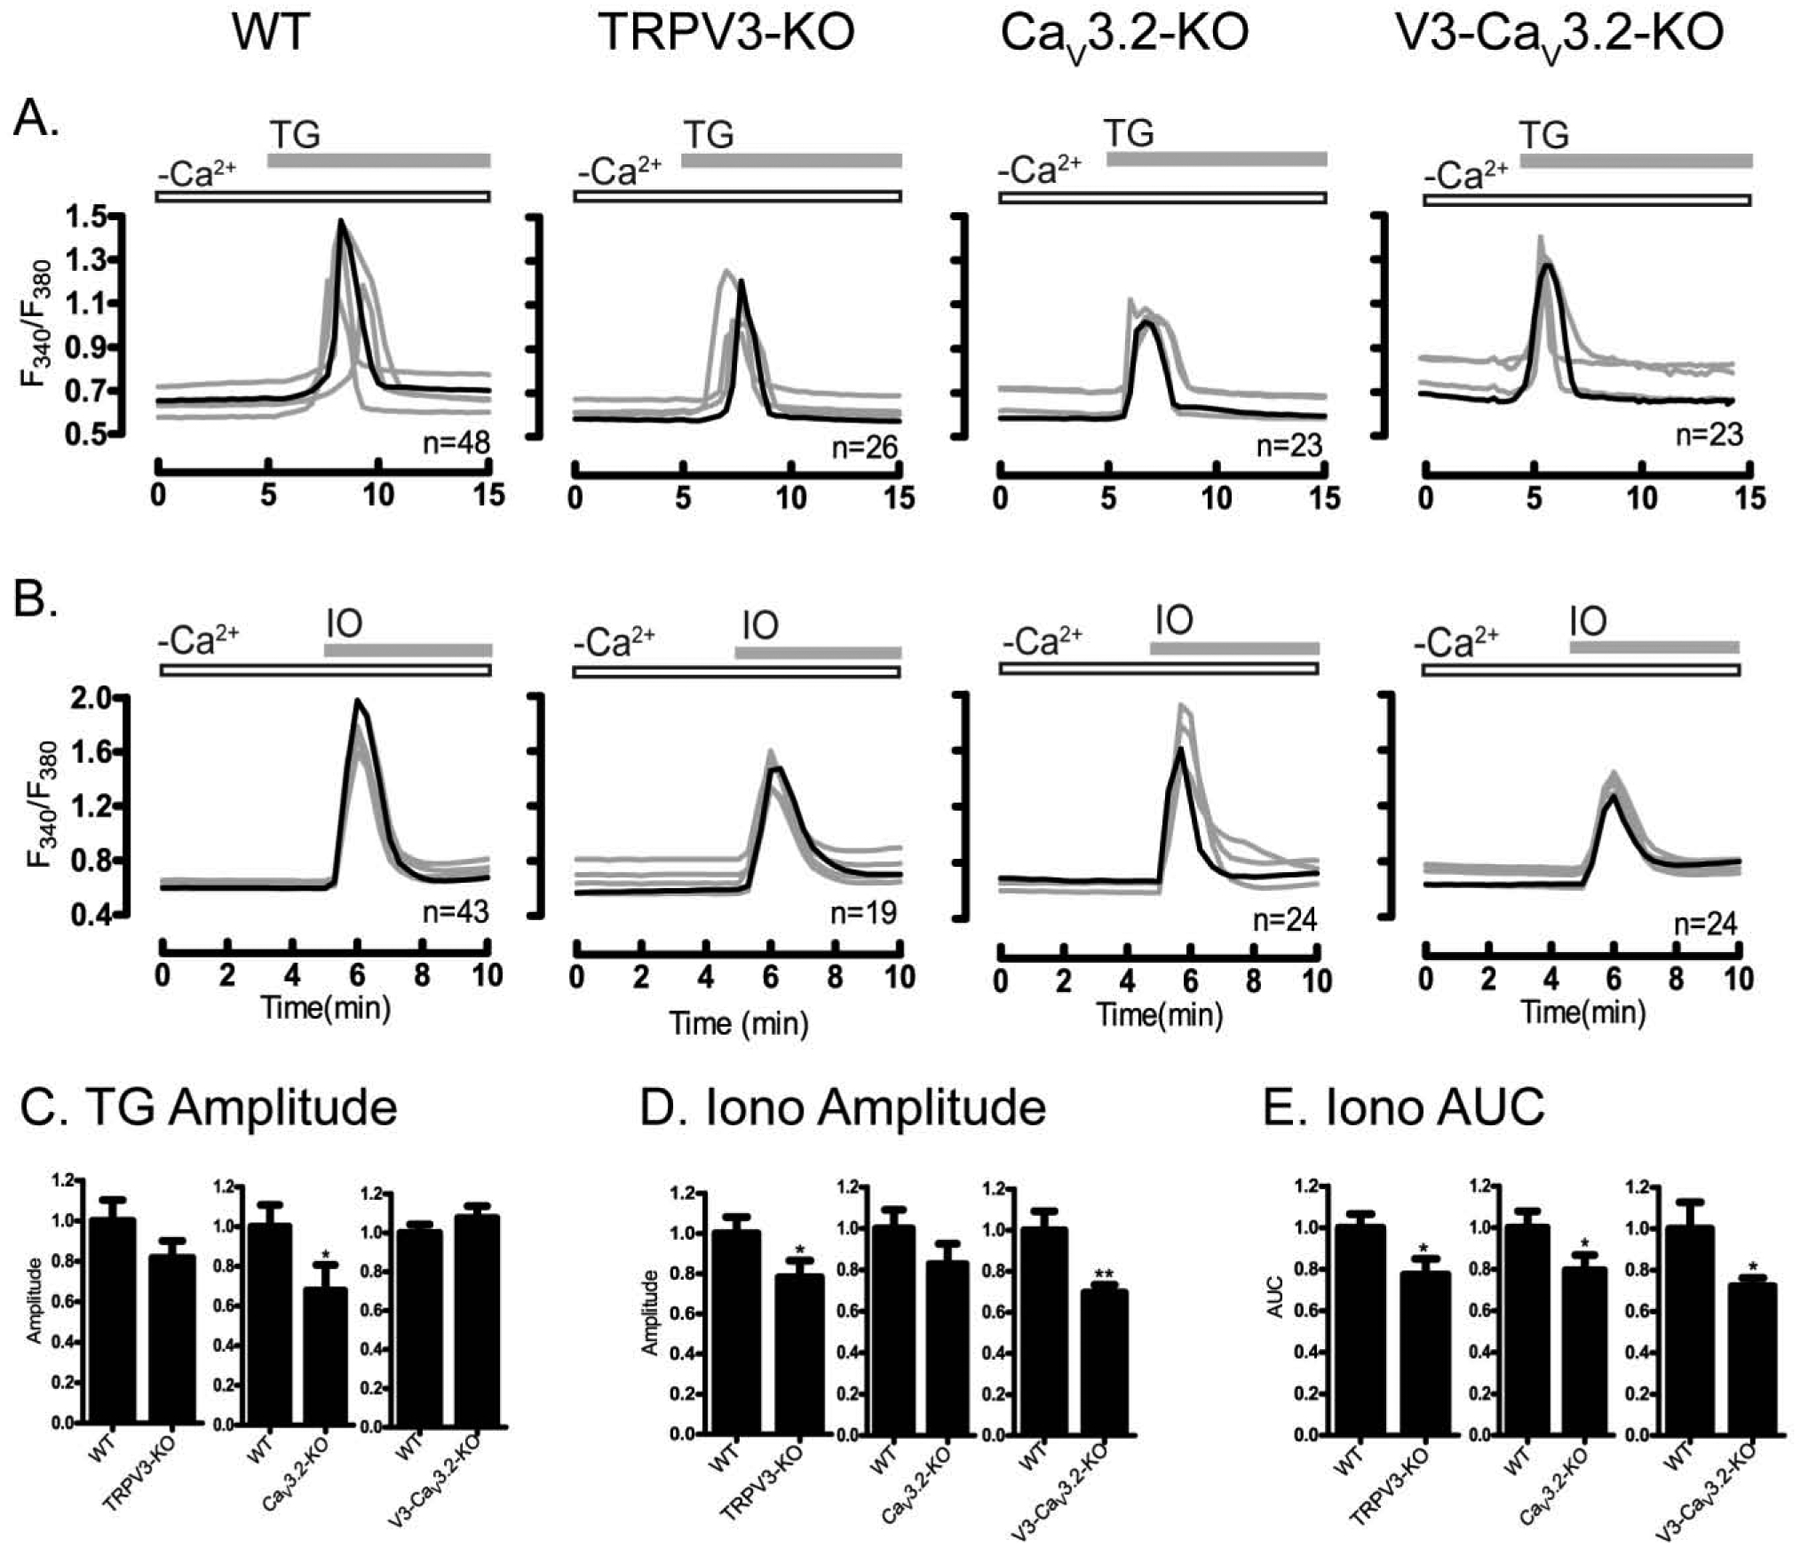
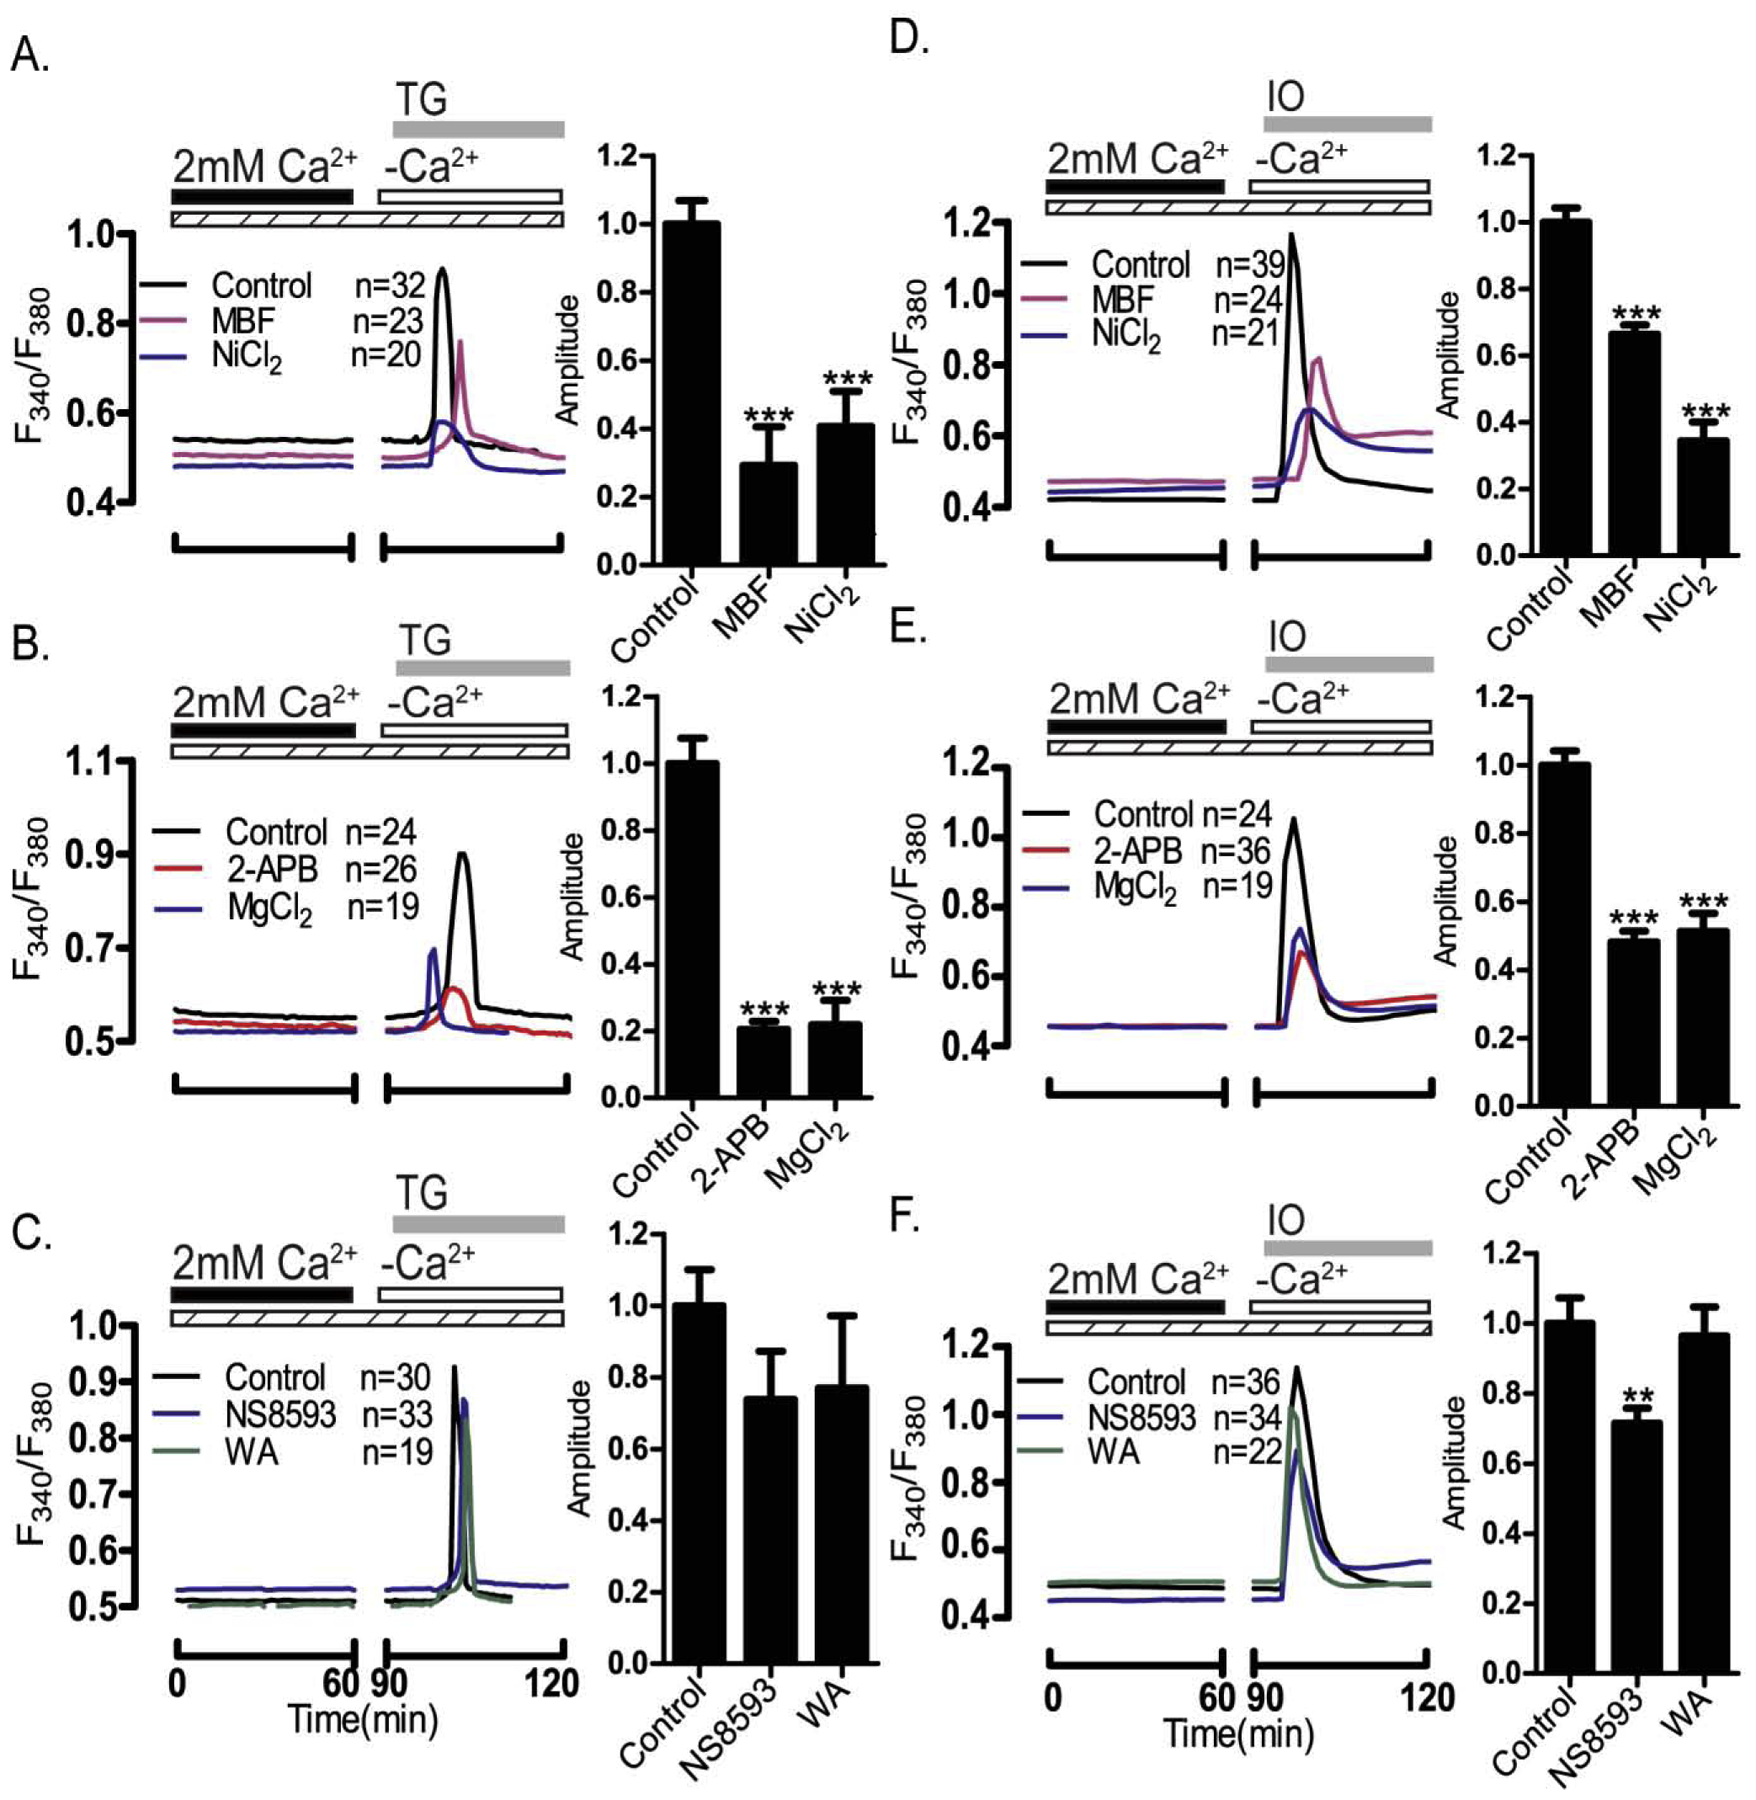
Prior to maturation, mouse oocytes are arrested at the germinal vesicle (GV) stage during which they experience constitutive calcium (Ca2+) influx and spontaneous Ca2+ oscillations. The oscillations cease during maturation but Ca2+ influx continues, as the oocytes' internal stores attain maximal content at the culmination of maturation, the metaphase II stage. The identity of the channel(s) that underlie this Ca2+ influx has not been completely determined. GV and matured oocytes are known to express three Ca2+ channels, CaV3.2, TRPV3 and TRPM7, but females null for each of these channels are fertile and their oocytes display minor modifications in Ca2+ homeostasis, suggesting a complex regulation of Ca2+ influx. To define the contribution of these channels at the GV stage, we used different divalent cations, pharmacological inhibitors and genetic models. We found that the three channels are active at this stage. CaV3.2 and TRPM7 channels contributed the majority of Ca2+ influx, as inhibitors and oocytes from homologous knockout (KO) lines showed severely reduced Ca2+ entry. Sr2+ influx was promoted by CaV3.2 channels, as Sr2+ oscillations were negligible in CaV3.2-KO oocytes but robust in control and Trpv3-KO GV oocytes. Mn2+ entry relied on expression of CaV3.2 and TRPM7 channels, but Ni2+ entry depended on the latter. CaV3.2 and TRPV3 channels combined to fill the Ca2+ stores, although CaV3.2 was the most impactful. Studies with pharmacological inhibitors effectively blocked the influx of divalent cations, but displayed off-target effects, and occasionally agonist-like properties. In conclusion, GV oocytes express channels mediating Ca2+ and other divalent cation influx that are pivotal for fertilization and early development. These channels may serve as targets for intervention to improve the success of assisted reproductive technologies.

Keywords: Calcium; Cav3.2; Influx; Meiosis; Signaling; TRPM7; TRPV3.


Conflict of interest statement

Declaration of Competing Interest None.

Figures

Figure 1.
Figure 1.. TRPM7 protein is expressed in mouse GV oocytes and MII eggs.
Immunoreactivity of TRPM7 was detected using an anti-TRPM7 + TRPM6 antibody. (A) The immunoreactive band in oocytes and eggs is likely TRPM7 given the ~MW of 210 kDa, and because its functional expression was confirmed by electrophysiology [28]. (B) In all tissues tested here, TRPM6 expression (~MW 240 kDa) appears to be clearly predominant over TRPM7. Red arrows indicate the expected locations of TRPM7 (dark red) and TRPM6 (light red). Representative blots are shown.
Figure 2.
Figure 2.. Divalent cations permeate the plasma membrane of GV oocytes.
Divalent cation influx was examined in GV oocytes. (A) Representative traces of Ca2+ oscillations caused by enhanced influx after increasing [Ca2+]o from 2 mM to 5 mM. (B) Sr2+ induced oscillations. (C) Fluorescence quenching at F360 following Mn2+ addition (100 μM). (D) Fluorescence quenching at F380 following Ni2+ addition (500 μM) in oocytes loaded with Mag-Fura-2AM in DFM media. Horizontal bars above each panel show the time during which divalent cations were added to the media. All experiments were replicated 4 times. In all panels in this figure and throughout the manuscript, representative traces are shown; darker traces represent the most common response; n: total number of oocytes examined.
Figure 3.
Figure 3.. Ca2+ influx in GV oocytes is mediated by multiple channels.
Presence of spontaneous oscillations and Ca2+ influx examined in WT oocytes and oocytes lacking TRPV3, CaV3.2 & V3-CaV3.2 channels. (A-four upper panels) Spontaneous Ca2+ oscillations in WT and KO oocytes in media containing basal Ca2+ levels (2 mM). Fewer oocytes of the CaV3.2 and V3-CaV3.2 KO lines display oscillations, which are also of decreased frequency (D) (P< 0.05). (B-four medium panels) Ca2+ influx triggered by increasing [Ca2+]o from 2 mM to 5 mM induces oscillations in all WT and KO lines, which appear of equal initial frequency (E). (C-four lower panels) After addition of TG (10 μM), Ca2+ influx resulted in reduced responses in CaV3.2 and V3-CaV3.2 KO oocytes, especially in the interval from Ca2+addition to the 1st Ca2+ peak (P< 0.05) (F). Filled horizontal bars above each panel show the time of addition of Ca2+ (black) or TG (grey) to the media. All experiments were 4 replicated for times. Asterisk(s) above columns in bar graphs denote significant differences from other conditions here and throughout the manuscript.
Figure 4.
Figure 4.. Pharmacological inhibitors disrupt Ca2+ influx/oscillations in GV oocytes.
Ca2+ influx in GV oocytes was tested by increasing [Ca2+]o from 2- to 5 mM (white/black horizontal bars above each panel) in the presence of pharmacological inhibitors (dashed bars). Increasing [Ca2+]o in (A) control, untreated oocytes, or oocytes treated with (B) CaV3.2 inhibitors: MBF (1 μM) or Ni2+ (100 μM) induced oscillations in the majority of oocytes. Conversely, Increasing [Ca2+]o in the presence of the (C) general TRP channel inhibitors 2-APB (50 μM) or MgCl2 (10 mM), or (D) in the presence of the TRPM7 inhibitors NS8593 (10 μM) or waixenicin-A (5 μM) failed to induce oscillations (P <0.05). All experiments were performed in 4 replicates.
Figure 5.
Figure 5.. Sr2+-induced oscillations are diminished in CaV3.2- and V3-CaV3.2-KO oocytes.
Sr2+ induced oscillations were tested in WT and in oocytes lacking TRPV3, or CaV3.2 or V3-CaV3.2 channels. Experiments were performed in nominal Ca2+-free media containing 10 mM Sr2+. (A) Sr2+ induced the expected oscillations in WT oocytes, and largely similar responses in (B) TRPV3-KO oocytes. Sr2+ induced oscillations were reduced in (C) CaV3.2-KO and in (D) V3-CaV3.2-KO oocytes both in the (E) number of cells showing oscillations, and in the (F) number of rises during the first 1h of imaging (P<0.05). Horizontal bars above each panel denote the time during which Sr2+ was present in the media. All experiments were performed in 3–4 replicates.
Figure 6.
Figure 6.. CaV3.2 channels inhibitors rapidly terminate Sr2+ induced oscillations.
Experiments were performed in nominal Ca2+-free media containing 10mM Sr2+ (black bar) and pharmacological inhibitors (dashed horizontal bars) were added 25 min following initiation of imaging. (A) Control, untreated oocytes showed normal oscillations, which were immediately terminated (B) by the addition of the CaV3.2 inhibitors MBF (1 μM) and Ni2+ (100 μM). (C) The general TRP channels inhibitors 2-APB (50 μM) & MgCl2 (5 mM) and (D) the TRPM7 inhibitor NS8593 (10 μM) also terminated oscillations but more protractedly especially by the latter; waixenicin-A (5 μM) was without effect. All experiments were replicated 4 times.
Figure 7.
Figure 7.. Multiple channels enable Mn2+ entry.
Mn2+ influx was tested in WT and in oocytes lacking TRPV3, or CaV3.2 or V3-CaV3.2 channels. Experiments were performed in media containing 2 mM Ca2+. (A) Mn2+ influx in WT oocytes, (B) TRPV3-KO oocytes, (C) CaV3.2-KO oocytes, (D) V3-CaV3.2-KO oocytes. (E) Fluorescence quenching assessed by the rate of F360 nm fluorescence decrease per minute relative to baseline fluorescence (P<0.05). (F) Time to inflection measured from the time of Mn2+ addition (5 min) to the time of first significant change in fluorescence values, which shortened in V3-CaV3.2-KO oocytes (P<0.05). Black horizontal bars denote addition of 100 μM Mn2+. Experiments were replicated 4 times.
Figure 8.
Figure 8.. Inhibitors of CaV3.2 & TRPM7 channels suppress Mn2+ influx.
Mn2+ influx monitored using traces depicting quenching of F360 nm fluorescence. Experiments were performed in media containing 2 mM Ca2+ in the absence/presence of specific pharmacological inhibitors (dashed bars) after addition of Mn2+ (black bars): (A) control untreated oocytes, (B) oocytes treated with the CaV3.2 inhibitors MBF (1 μM) or Ni2+ (100 μM), (C) or with the general TRP inhibitors 2-APB (50 μM) and MgCl2 (10 mM), or (D) with the TRPM7 inhibitors NS8593 (10 μM) or waixenicin-A (1 μM). (E) Rate of fluorescence quenching per minute at F360 nm relative to baseline fluorescence was reduced by all inhibitors examined (P<0.05), and (F) time to inflection measured from the time of addition (5 min) to the time fluorescence quenching begins was prolonged by all inhibitors examined(P<0.05). Experiments were replicated 3 times.
Figure 9.
Figure 9.. Enhanced Ni2+ influx in V3-CaV3.2-KO oocytes.
Ni2+ influx was tested in WT and oocytes lacking TRPV3, CaV3.2 or V3-CaV3.2 channels. Experiments were performed using Mag-Fura-2AM loaded oocytes in divalent free medium (DFM). Ni2+ influx in (A) WT oocytes, (B) TRPV3-KO oocytes, (C) CaV3.2-KO oocytes, (D) V3-CaV3.2-KO oocytes. (E) Fluorescence quenching at F380 assessed by the rate of fluorescence decrease per minute relative to baseline fluorescence (*P<0.05). (F) Time to inflection measured from the time of addition (5 min) to the time fluorescence quenching begins (*P<0.05). Black bars show the time at which Ni2+ was added. Experiments were replicated three times.
Figure 10.
Figure 10.. TRPM7 channel inhibitors block Ni2+ influx.
Inhibition of Ni2+ influx (black bars) was examined in the absence/presence of pharmacological inhibitors (dashed bars) and assessed by the rate of fluorescence quenching per minute at F380 relative to baseline fluorescence. Experiments were performed using Mag-Fura-2AM loaded oocytes in divalent free medium. (A) Control, untreated group, (B) CaV3.2 inhibitor MBF (1 μM), (C) general inhibitors of TRP channels 2-APB (100 μM) or MgCl2 (10 mM), (D) TRPM7 inhibitors NS8593 (10 μM) or waixenicin-A (5 μM). (E) Maximal inhibition of fluorescence quenching of Mag-Fura by general TRP inhibitors, and more specifically by the TRPM7 inhibitor NS8593 (P<0.05). (F) Time to inflection measured from the time of addition (5 min) to the time of fluorescence quenching begins, was also maximally inhibited by TRP inhibitors and more specifically by NS8593 (P<0.05). Experiments were replicated 3 times.
Figure 11.
Figure 11.. The absence of TRPV3- and V3-CaV3.2 channels reduces internal Ca2+ stores.
Ca2+ release from ER and total stores was measured using TG (10 μM) and IO (2.5 μM) in WT and in oocytes lacking TRPV3, CaV3.2, or V3-CaV3.2 channels. Experiments were performed in nominal Ca2+-free medium. (A) TG responses in WT, TRPV3-, CaV3.2- and V3-CaV3.2-KO oocytes. (B) Ionomycin responses in WT, TRPV3-, CaV3.2- and V3-CaV3.2-KO oocytes. (C) Peak amplitude of TG-induced Ca2+ release was reduced in CaV3.2 (P<0.05). (D) Peak amplitude of ionomycin-induced Ca2+ release was reduced V3-CaV3.2 (P<0.05), whereas (E) AUC response induced by IO was reduced in all KO lines (P<0.05). Open bars indicate nominal Ca2+ free media; filled gray bars show the time at which TG/IO was added. Experiments were replicated 3 times.
Figure 12.
Figure 12.. Internal Ca2+ stores are reduced in the presence of CaV3.2 and general TRP channels inhibitors.
Oocytes were incubated with pharmacological inhibitors for 1 h after which internal Ca2+ store content was tested following addition of TG and IO-induced. Peak amplitude of intracellular Ca2+ release was graphed and quantified. (A and D) the CaV3.2 inhibitors MBF (1 μM) and Ni2+ (100 μM) reduced responses to both treatments (P<0.05), and similar effects were observed after the addition of (B and E) the TRP channels general inhibitors 2-APB (100 μM) and MgCl2 (5 mM) (P<0.05). (C & F) The TRPM7 inhibitors NS8593 (10 μM) & waixenicin-A (1 μM) were without effect (P>0.05) regarding TG responses, while NS8593 affected the amplitude of the IO response (P>0.05). Dashed bars indicate the presence of pharmacological inhibitors; black and white bars indicate the presence/absence of Ca2+; gray bars show the time at which IO/TG was added.

Similar articles

Cited by

References

    1. Berridge MJ, Lipp P, and Bootman MD, The versatility and universality of calcium signalling. Nat Rev Mol Cell Biol, 2000. 1(1): p. 11–21. - PubMed
    1. Wakai T, Vanderheyden V, and Fissore RA, Ca2+ signaling during mammalian fertilization: requirements, players, and adaptations. Cold Spring Harb Perspect Biol, 2011. 3(4). - PMC - PubMed
    1. Cuthbertson KS, Whittingham DG, and Cobbold PH, Free Ca2+ increases in exponential phases during mouse oocyte activation. Nature, 1981. 294(5843): p. 754–7. - PubMed
    1. Ridgway EB, Gilkey JC, and Jaffe LF, Free calcium increases explosively in activating medaka eggs. Proc Natl Acad Sci U S A, 1977. 74(2): p. 623–7. - PMC - PubMed
    1. Steinhardt R, Zucker R, and Schatten G, Intracellular calcium release at fertilization in the sea urchin egg. Dev Biol, 1977. 58(1): p. 185–96. - PMC - PubMed

Publication types