Review
. 2020 Feb 21;10(2):118.
doi: 10.3390/diagnostics10020118.

Viscoelastic Hemostatic Assays: Moving from the Laboratory to the Site of Care-A Review of Established and Emerging Technologies

Affiliations
Review

Viscoelastic Hemostatic Assays: Moving from the Laboratory to the Site of Care-A Review of Established and Emerging Technologies

Jan Hartmann et al. Diagnostics (Basel). .

Abstract

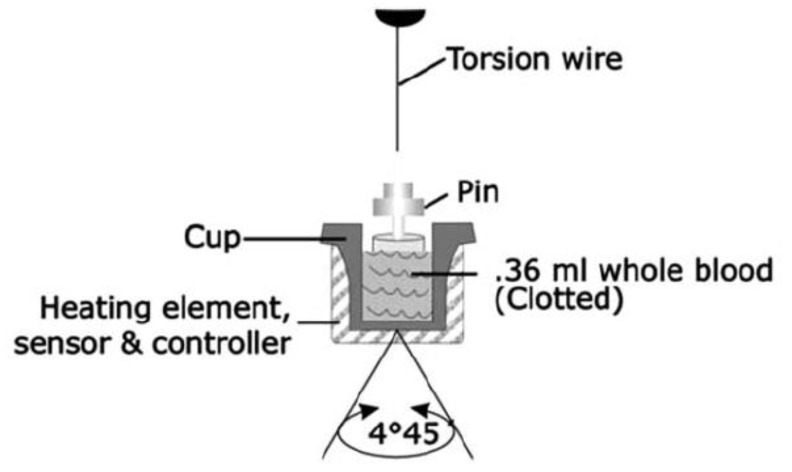
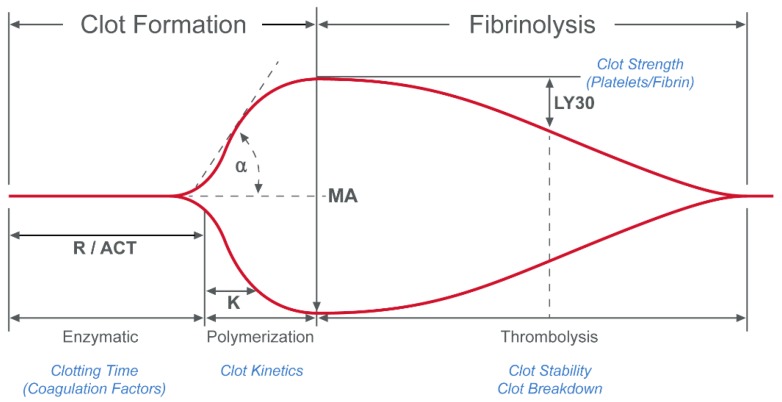
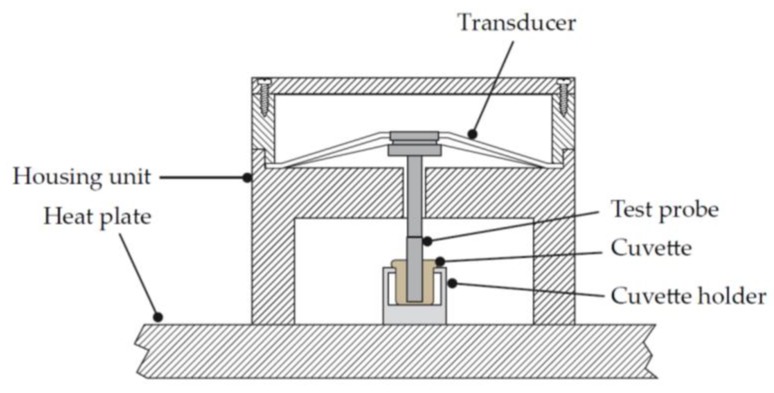
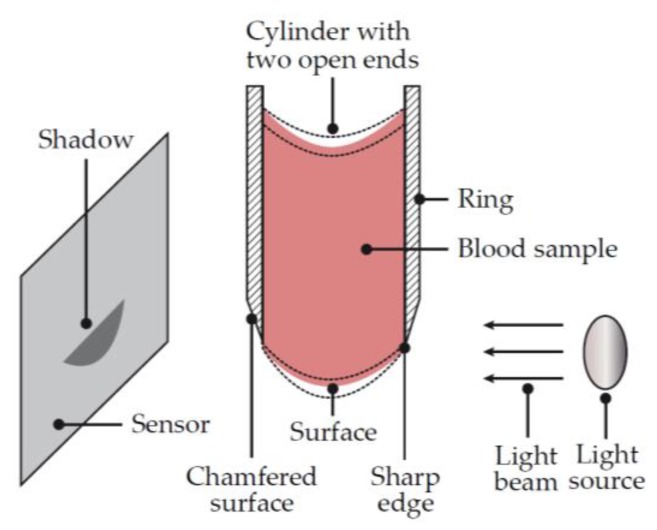
Viscoelastic-based techniques to evaluate whole blood hemostasis have advanced substantially since they were first developed over 70 years ago but are still based upon the techniques first described by Dr. Hellmut Hartert in 1948. Today, the use of thromboelastography, the method of testing viscoelastic properties of blood coagulation, has moved out of the research laboratory and is now more widespread, used commonly during surgery, in emergency departments, intensive care units, and in labor wards. Thromboelastography is currently a rapidly growing field of technological advancement and is attracting significant investment. This review will first describe the history of the viscoelastic testing and the established first-generation devices, which were developed for use within the laboratory. This review will then describe the next-generation hemostasis monitoring devices, which were developed for use at the site of care for an expanding range of clinical applications. This review will then move on to experimental technologies, which promise to make viscoelastic testing more readily available in a wider range of clinical environments in the endeavor to improve patient care.

Keywords: ROTEM; TEG; VHA; blood; coagulation; hemostasis; point of care; thromboelastography; viscoelastic testing.


Conflict of interest statement

All authors are employees of Haemonetics, the manufacturer of the TEG® technology.

Figures

Figure 1
Figure 1
Shear elastic modulus. (a) Mathematical formula to express shear modulus; (b) Schematic representation of the shear principle. G = shear modulus; F = force; A = area; F/A = shear stress; Δx = transverse displacement; l = initial length. Reproduced with permission from [4].
Figure 2
Figure 2
Dr. Hartert’s cup and pin mechanism. Schematic drawing representing parts of the thromboelastograph that were in direct contact with the blood sample. The rotating cup was approximately 8 x 12 mm and made from stainless steel, the surface of which prevented detachment of the blood clot during cup rotation. The blood sample was covered by a layer of paraffin oil to prevent evaporation of the sample. Reproduced with permission from [4].
Figure 3
Figure 3
Output from Dr Hartert’s cup and pin. Representation of the output from the entire cycle of the cup and pin system. The R period was described as the reaction time, g as the growth of the clot and s as the stable period clot strength. The amplitude of the waveform is proportional to the shear modulus of the clot within its elastic region and is analogous to clot strength. Reproduced with permission from [5].
Figure 4
Figure 4
Chart representing the movement of Dr. Hartert’s cup and pin after clotting of the blood sample. The red line represents the displacement of the cup and the blue line represents the displacement of the pin. The units on the x-axis represent the extent of the illuminated section of film by the rotating mirror. The units of mm amplitude on the y-axis remain today in many viscoelastic hemostatic assay systems. The units of mm to express a clot strength has been the source of confusion in this space. Reproduced with permission from [4].
Figure 5
Figure 5
Schematic representation of the TEG® 5000 system. Thromboelastography conducted with the TEG® 5000 system uses approximately 0.36 mL of blood, which is placed into a cylindrical cup at 37 °C. A pin on a torsion wire is suspended in the blood, and the cup rotates in alternating directions (rotation angle 4°45’, cycle duration 10 s) to simulate venous flow. At the onset of each measurement, there is no torque between the cup and the pin, and the machine provides a reading of zero. As clotting occurs, fibrin fibers formed between the pin and the cup create a rotational force on the pin, which is measured via a torsion wire and an electromagnetic transducer; the readout line diverges from the baseline until it reaches a maximum value (maximum clot strength). With the onset of clot lysis, the readout converges back towards baseline. Reproduced with permission from Haemonetics [11].
Figure 6
Figure 6
Plot of the total deflection of the pin from the TEG® 5000 system. The primary values that are derived from the resulting waveform are reaction time (R, or activated clotting time [ACT]), maximum amplitude (MA) and lysis at 30 minutes (LY30). R represents the time to the beginning of clot formation. MA is the maximum clot strength achieved. LY30 quantifies the reduction of clot strength, or the lysis (in the 30 min) following MA. K and α angle are also used to quantify the dynamics of clot formation. Reproduced from [12].
Figure 7
Figure 7
Schematic of the Sonoclot® system. The sample to be tested is placed in a cuvette within the housing unit. The linear test probe is then lowered into the cuvette and is in contact with the sample to be tested. An electric signal through the transducer produces a linear oscillatory motion of the test probe whilst a heat plate warms the sample to be tested through the cuvette holder. Adapted from US Patent 5,138,872 [16].
Figure 8
Figure 8
Schematic representation of the TEG® 6s. The diameter of the ring and cylinder is sized to allow the blood sample to be held within the cylinder by surface tension, without support at the bottom surface. The light source (light emitting diode) directs a beam of light at the blood sample, casting a shadow on the sensor. As the surface of the sample is excited by the light beam, the sample oscillates and the corresponding shadow becomes larger or smaller depending upon the elasticity of the blood sample. The resonant frequency of the blood sample is determined before, during and after coagulation. Changes in the resonant frequency of the sample are indicative of the hemostasis characteristics of the blood sample. Adapted from US Patent 7,879,615 B2 [24].
Figure 9
Figure 9
Schematic representation of the Laser Speckle Rheometry system. A laser light source shines a laser beam through a beam splitter onto a sample. The speckle pattern is detected by a camera and processed as described above. By analyzing the laser speckle pattern, the system can estimate the Brownian motion of the material. Brownian motion in such a sample is directly related to the viscoelastic properties of the material. During the blood clotting process, the change in viscoelastic properties can be evaluated and strongly correlated to parameters found in predicate viscoelastic hemostasis analyzers. Adapted from US Patent 8,772,039 B2 [35].
Figure 10
Figure 10
Schematic of the Levisonics ultrasonic transducer. The extent of shape deformations in the suspended blood droplet are directly correlated to the viscoelastic properties of the sample. As the amplitude of the standing wave is modulated, the shape of the sample will change from spherical to oblong. The camera system will track these shape changes and an algorithm converts them to viscoelastic properties. DAS = data acquisition system. Adapted from US Patent application 2017/0016878 A1 [38].
Figure 11
Figure 11
Parallel plate viscometry. Parallel plates slide past each other with controlled velocity to create a shear stress between the plates, which is represented as † = µV/d, where † = shear stress; µ = viscosity, V = V1 − V2, (relative linear velocity of the plates); d = gap between plates. Adapted from US Patent 8,450,078 B2 [39].
Figure 12
Figure 12
Schematic of the ClotPro® system. The ClotPro® system consists of a cup that contains the blood sample and a static pin, which is fixed to the cover. The cup rotates around the vertical axis, driven by an elastic coupling element, such as a spring wire, which is attached to the shaft. The light source (wavelength 1–3 µm) is placed within 75 mm of the shaft and cup-receiving element to act as a temperature control device. Adapted from International Patent WO,2018/137766,A1 [40].

References

    1. Kang Y.G., Martin D.J., Marquez J., Lewis J.H., Bontempo F.A., Shaw B.W., Jr., Starzl T.E., Winter P.M. Intraoperative changes in blood coagulation and thrombelastographic monitoring in liver transplantation. Anesth. Analg. 1985;64:888–896. doi: 10.1213/00000539-198509000-00008. - DOI - PMC - PubMed
    1. Mallett S.V. Clinical utility of viscoelastic tests of coagulation (TEG/ROTEM) in patients with liver disease and during liver transplantation. Semin. Thromb. Hemost. 2015;41:527–537. doi: 10.1055/s-0035-1550434. - DOI - PubMed
    1. Curry N.S., Davenport R., Pavord S., Mallett S.V., Kitchen D., Klein A.A., Maybury H., Collins P.W., Laffan M. The use of viscoelastic haemostatic assays in the management of major bleeding: A British Society for Haematology Guideline. Br. J. Haematol. 2018;182:789–806. doi: 10.1111/bjh.15524. - DOI - PubMed
    1. Hochleitner G., Sutor K., Levett C., Leyser H., Schlimp C.J., Solomon C. Revisiting Hartert’s 1962 Calculation of the Physical Constants of Thrombelastography. Clin. Appl. Thromb. Hemost. 2017;23:201–210. doi: 10.1177/1076029615606531. - DOI - PMC - PubMed
    1. Hartert H. Coagulation analysis with thromboelastography, a new method. Klin. Wochenschr. 1948;26:577–658. doi: 10.1007/BF01697545. - DOI - PubMed

LinkOut - more resources