

Investigation of a Direct Interaction between miR4749 and the Tumor Suppressor p53 by Fluorescence, FRET and Molecular Modeling
- PMID: 32098369
- PMCID: PMC7072324
- DOI: 10.3390/biom10020346
Investigation of a Direct Interaction between miR4749 and the Tumor Suppressor p53 by Fluorescence, FRET and Molecular Modeling
Abstract
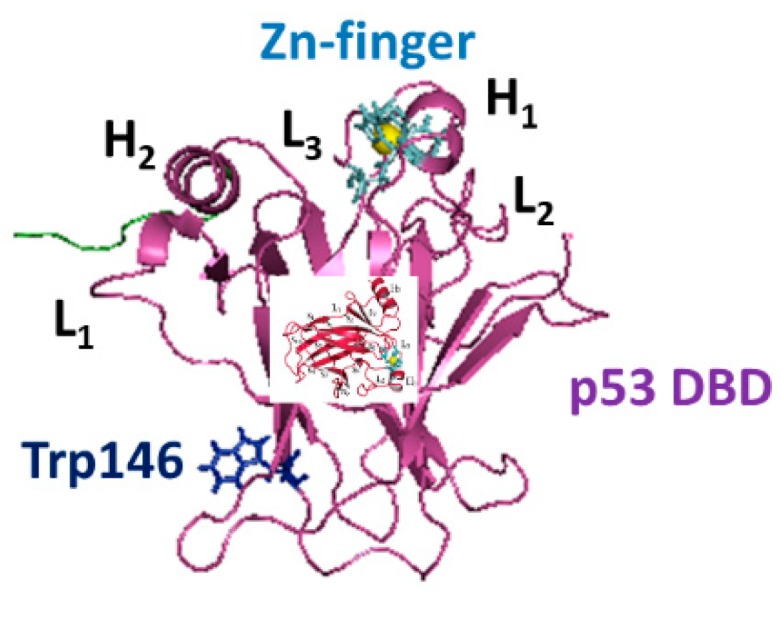
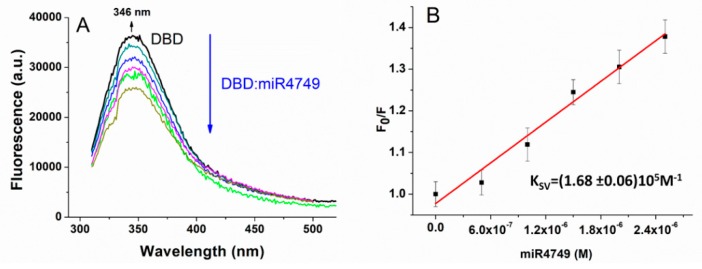
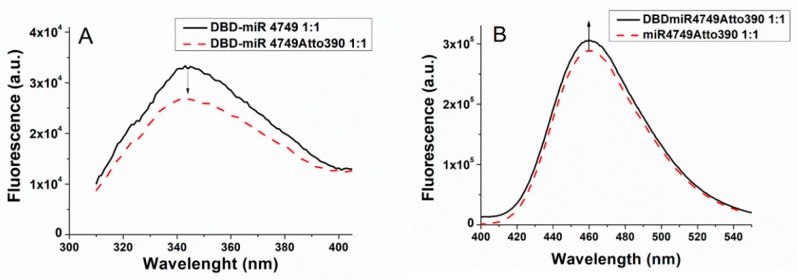
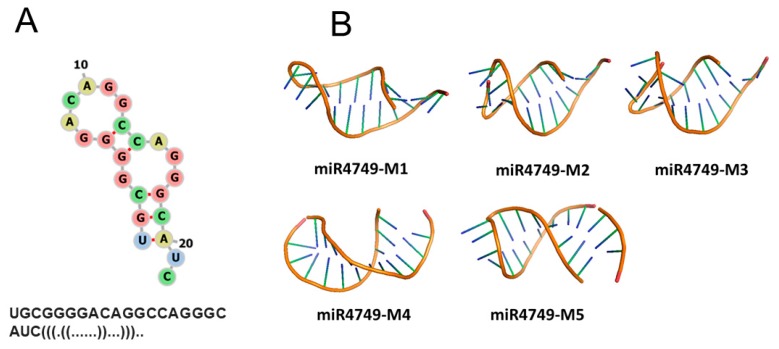
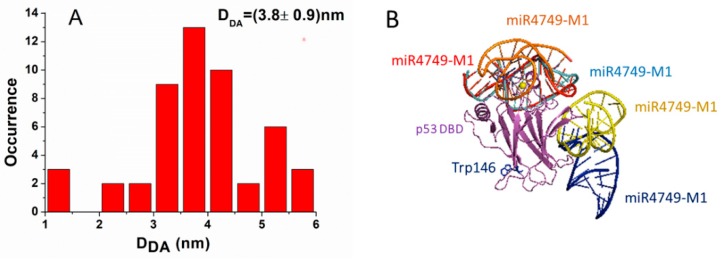
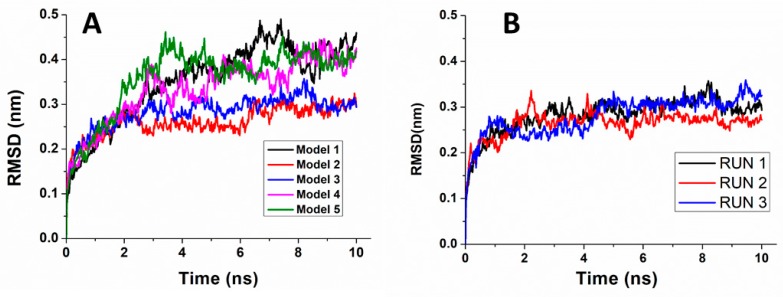
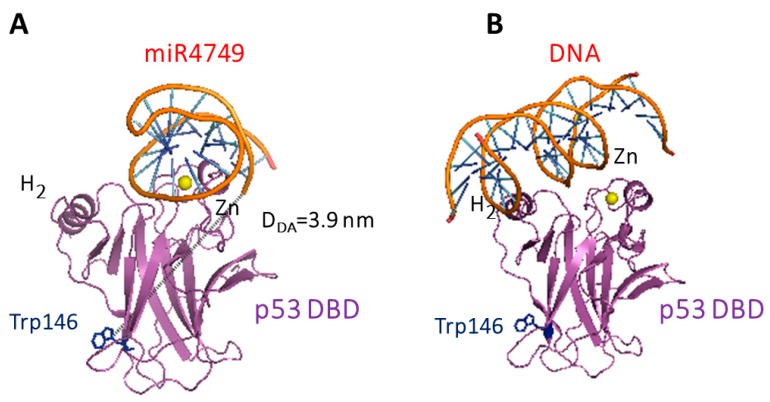
The interactions between the DNA binding domain (DBD) of the tumor suppressor p53 and miR4749, characterized by a high sequence similarity with the DNA Response Element (RE) of p53, was investigated by fluorescence spectroscopy combined with computational modeling and docking. Fluorescence quenching experiments witnessed the formation of a specific complex between DBD and miR4749 with an affinity of about 105 M. Förster Resonance Energy Transfer (FRET) allowed us to measure a distance of 3.9 ± 0.3 nm, between the lone tryptophan of DBD and an acceptor dye suitably bound to miR4749. Such information, combined with a computational modeling approach, allowed us to predict possible structures for the DBD-miR4749 complex. A successive docking refinement, complemented with binding free energy calculations, led us to single out a best model for the DBD-miR4749 complex. We found that the interaction of miR4749 involves the DBD L3 loop and the H1 helix, close to the Zn-finger motif; with this suggesting that miR4749 could directly inhibit the p53 interaction with DNA. These results might inspire new therapeutic strategies finalized to restore the p53 functional activity.
Keywords: FRET; computational docking; fluorescence quenching; miR4749; oncomiR; p53.
Conflict of interest statement
The authors declare no conflict of interest.
Figures
Similar articles
-
Interaction between miR4749 and Human Serum Albumin as Revealed by Fluorescence, FRET, Atomic Force Spectroscopy and Computational Modelling.Int J Mol Sci. 2022 Jan 24;23(3):1291. doi: 10.3390/ijms23031291. Int J Mol Sci. 2022. PMID: 35163220 Free PMC article.
-
Probing direct interaction of oncomiR-21-3p with the tumor suppressor p53 by fluorescence, FRET and atomic force spectroscopy.Arch Biochem Biophys. 2019 Aug 15;671:35-41. doi: 10.1016/j.abb.2019.05.026. Epub 2019 Jun 8. Arch Biochem Biophys. 2019. PMID: 31181181
-
Interaction of the anticancer p28 peptide with p53-DBD as studied by fluorescence, FRET, docking and MD simulations.Biochim Biophys Acta Gen Subj. 2019 Feb;1863(2):342-350. doi: 10.1016/j.bbagen.2018.11.003. Epub 2018 Nov 10. Biochim Biophys Acta Gen Subj. 2019. PMID: 30419285
-
Distance determination in protein-DNA complexes using fluorescence resonance energy transfer.Methods Mol Biol. 2006;335:243-55. doi: 10.1385/1-59745-069-3:243. Methods Mol Biol. 2006. PMID: 16785632 Review.
-
Fluorescence resonance energy transfer (FRET) and competing processes in donor-acceptor substituted DNA strands: a comparative study of ensemble and single-molecule data.J Biotechnol. 2002 Jan;82(3):211-31. doi: 10.1016/s1389-0352(01)00039-3. J Biotechnol. 2002. PMID: 11999691 Review.
Cited by
-
Direct Interaction of miRNA and circRNA with the Oncosuppressor p53: An Intriguing Perspective in Cancer Research.Cancers (Basel). 2021 Dec 3;13(23):6108. doi: 10.3390/cancers13236108. Cancers (Basel). 2021. PMID: 34885216 Free PMC article. Review.
-
Recent Advances in p53.Biomolecules. 2021 Feb 3;11(2):211. doi: 10.3390/biom11020211. Biomolecules. 2021. PMID: 33546313 Free PMC article.
-
Interaction of miR-155 with Human Serum Albumin: An Atomic Force Spectroscopy, Fluorescence, FRET, and Computational Modelling Evidence.Int J Mol Sci. 2022 Sep 14;23(18):10728. doi: 10.3390/ijms231810728. Int J Mol Sci. 2022. PMID: 36142640 Free PMC article.
-
Toward Cancer Diagnostics of the Tumor Suppressor p53 by Surface Enhanced Raman Spectroscopy.Sensors (Basel). 2020 Dec 14;20(24):7153. doi: 10.3390/s20247153. Sensors (Basel). 2020. PMID: 33327383 Free PMC article. Review.
-
Interaction between miR4749 and Human Serum Albumin as Revealed by Fluorescence, FRET, Atomic Force Spectroscopy and Computational Modelling.Int J Mol Sci. 2022 Jan 24;23(3):1291. doi: 10.3390/ijms23031291. Int J Mol Sci. 2022. PMID: 35163220 Free PMC article.
References
Publication types
MeSH terms
Substances
Grants and funding
LinkOut - more resources
Full Text Sources
Research Materials
Miscellaneous
