. 2020 Mar 25;40(13):2776-2788.
doi: 10.1523/JNEUROSCI.0462-19.2020. Epub 2020 Feb 25.

ROCK/PKA Inhibition Rescues Hippocampal Hyperexcitability and GABAergic Neuron Alterations in a Oligophrenin-1 Knock-Out Mouse Model of X-Linked Intellectual Disability

Affiliations

ROCK/PKA Inhibition Rescues Hippocampal Hyperexcitability and GABAergic Neuron Alterations in a Oligophrenin-1 Knock-Out Mouse Model of X-Linked Intellectual Disability

Irene Busti et al. J Neurosci. .

Abstract

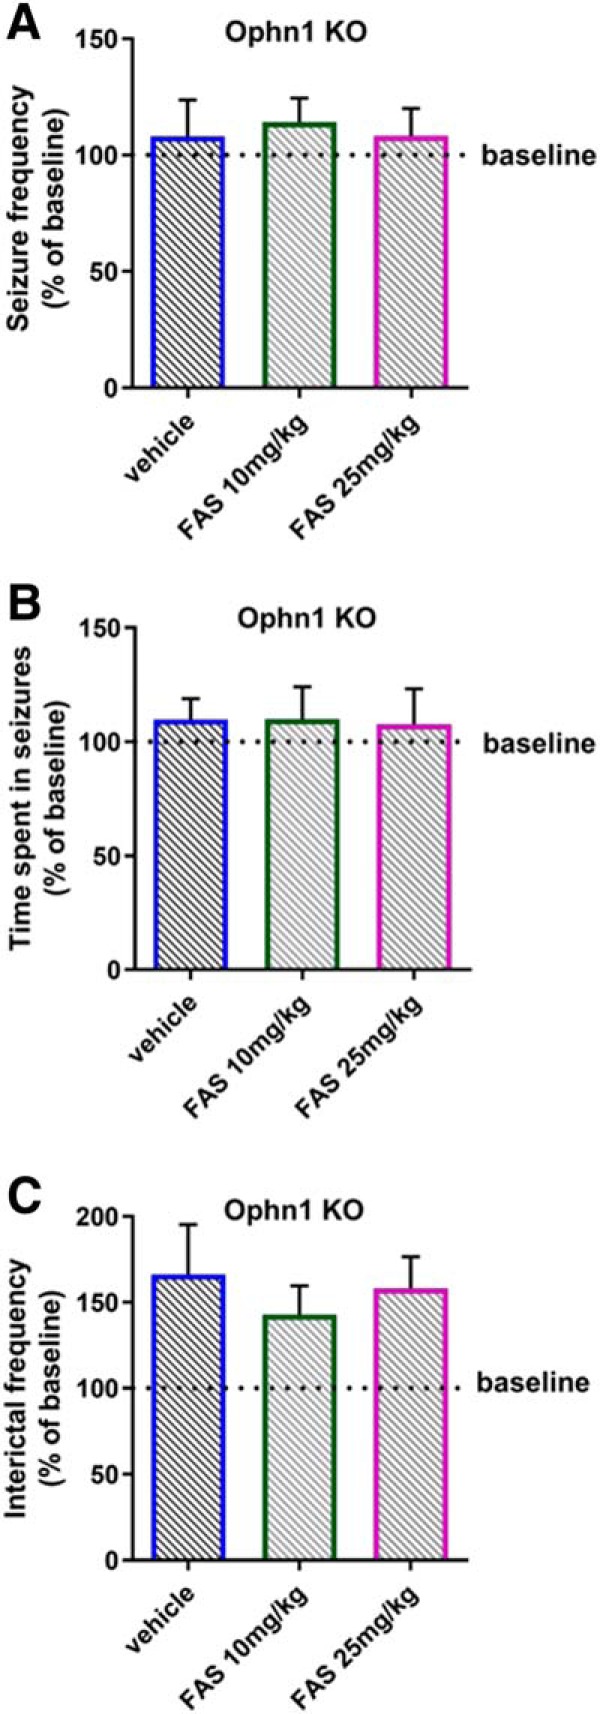
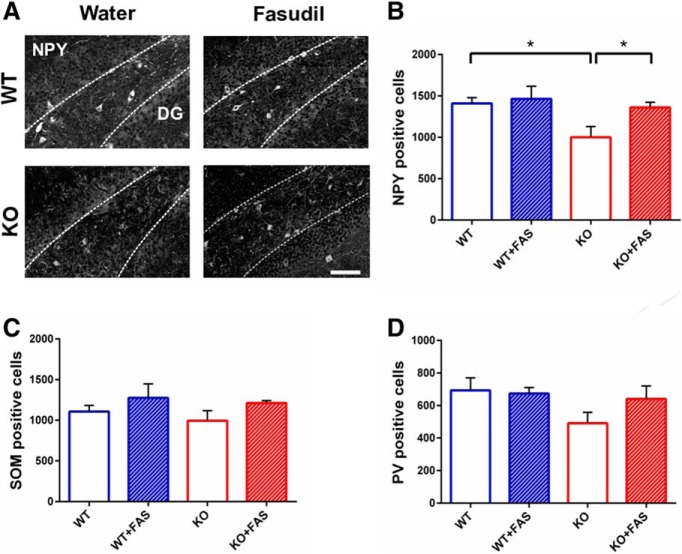
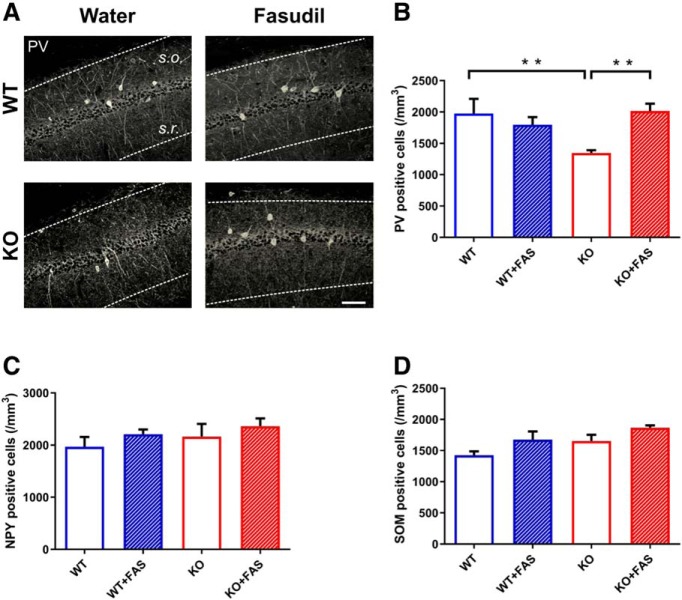
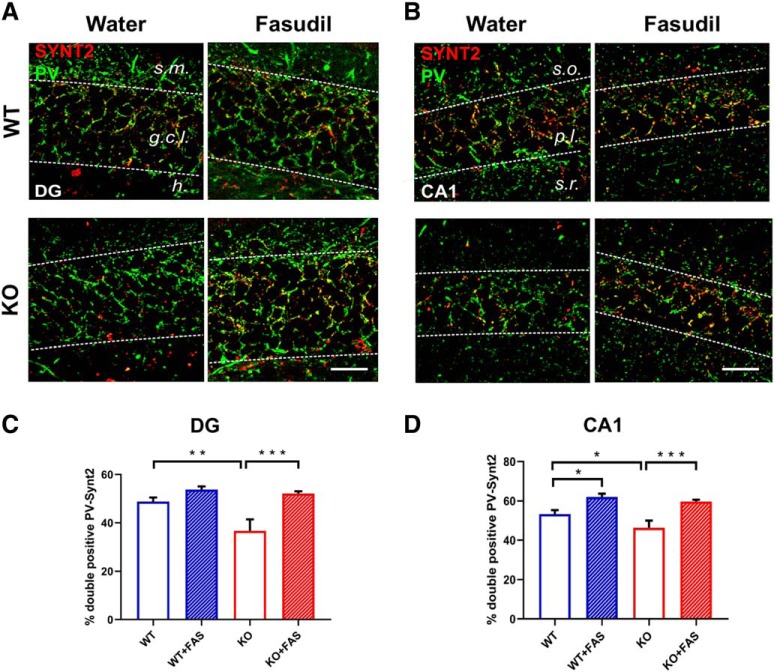
Oligophrenin-1 (Ophn1) encodes a Rho GTPase activating protein whose mutations cause X-linked intellectual disability (XLID) in humans. Loss of function of Ophn1 leads to impairments in the maturation and function of excitatory and inhibitory synapses, causing deficits in synaptic structure, function and plasticity. Epilepsy is a frequent comorbidity in patients with Ophn1-dependent XLID, but the cellular bases of hyperexcitability are poorly understood. Here we report that male mice knock-out (KO) for Ophn1 display hippocampal epileptiform alterations, which are associated with changes in parvalbumin-, somatostatin- and neuropeptide Y-positive interneurons. Because loss of function of Ophn1 is related to enhanced activity of Rho-associated protein kinase (ROCK) and protein kinase A (PKA), we attempted to rescue Ophn1-dependent pathological phenotypes by treatment with the ROCK/PKA inhibitor fasudil. While acute administration of fasudil had no impact on seizure activity, seven weeks of treatment in adulthood were able to correct electrographic, neuroanatomical and synaptic alterations of Ophn1 deficient mice. These data demonstrate that hyperexcitability and the associated changes in GABAergic markers can be rescued at the adult stage in Ophn1-dependent XLID through ROCK/PKA inhibition.SIGNIFICANCE STATEMENT In this study we demonstrate enhanced seizure propensity and impairments in hippocampal GABAergic circuitry in Ophn1 mouse model of X-linked intellectual disability (XLID). Importantly, the enhanced susceptibility to seizures, accompanied by an alteration of GABAergic markers were rescued by Rho-associated protein kinase (ROCK)/protein kinase A (PKA) inhibitor fasudil, a drug already tested on humans. Because seizures can significantly impact the quality of life of XLID patients, the present data suggest a potential therapeutic pathway to correct alterations in GABAergic networks and dampen pathological hyperexcitability in adults with XLID.

Keywords: GABAergic interneurons; electrographic seizures; epilepsy; fasudil; inhibitory synapses.


Figures

Figure 1.
Figure 1.
Behavioral analysis of seizures in KA-injected Ophn1+/y and Ophn1−/y mice. A, Progression of behavioral changes after systemic KA injection (10 mg/kg i.p.) in WT (n = 8) and KO mice (n = 7) over a 2 h observation period. Data show an increased susceptibility to KA-induced seizures in KO mice (two-way RM ANOVA, p < 0.0001, followed by Tukey's test). All data are shown as mean seizure scores ± SEM. B, Maximum seizure score reached by each animal during 2 h of observation. Data show that there is a significant difference between WT and KO (Ophn1+/y: 3.00 ± 0; Ophn1−/y: 4.42 ± 0.52; Mann–Whitney rank-sum test, p = 0.02). Typical limbic motor convulsions (stages 4–5) are only detectable in KO mice. Horizontal lines indicate the mean of the group. *p < 0.05; **p < 0.01; ***p < 0.001.
Figure 2.
Figure 2.
Electrographic alterations in the hippocampus of Ophn1 KO mice. A, Representative LFP traces in WT and KO animals. Note high-amplitude spiking activity in the KO mouse. B, Spectrogram showing the increase of LFP oscillatory activity in a wide bandwidth during paroxysmal discharges in the KO mouse. The analysis has been performed on the LFP trace shown in A (bottom). C, Number of seizures per 10 min of recording in WT (n = 6) and KO (n = 8) animals. Seizure frequency is only detectable in KO animals (Ophn1+/y: 0.05 ± 0.03; Ophn1−/y: 0.92 ± 0.29, Mann–Whitney rank-sum test, p = 0.008). D, Time spent in ictal activity per 10 min of recording (Ophn1+/y: 0.23 ± 0.12; Ophn1−/y: 5.00 ± 1.55, Mann–Whitney rank-sum test, p = 0.008). E, Number of interictal events per 10 min of recording. Frequency of hippocampal short discharges (< 4 s) is significantly higher in KO animals compared with WT (Ophn1+/y: 16.09 ± 1.77; Ophn1−/y: 41.72 ± 7.82; Mann–Whitney rank-sum test, p = 0.003). Each point represents one animal. Histograms indicate mean ± SEM. **p < 0.01.
Figure 3.
Figure 3.
Chronic fasudil treatment rescues hippocampal hyperexcitability in Ophn1 KO mice. Fasudil (FAS) was administered for 7 weeks in drinking water. Control animals received only water. At the end of this period, LFP recordings were performed. A, Representative traces showing LFP recordings obtained from the hippocampus of KO mice treated either with water (top) or fasudil (bottom). B, Number of seizures per 10 min of recording in WT (n = 5), WT with fasudil (n = 5), KO (n = 7), KO with fasudil (n = 8) animals. The presence of hippocampal discharges was consistently confirmed in this group of KO mice. Importantly, fasudil significantly reduced seizure frequency in KO animals (Ophn1−/y treated with water: 1.91 ± 0.29; Ophn1−/y treated with fasudil: 0.61 ± 0.28; two-way ANOVA followed by Tukey's test, p = 0.004). C, Time spent in ictal activity per 10 min of recording. KO animals treated with fasudil spent significantly less time in seizures than KO animals treated with water (Ophn1−/y treated with water: 11.03 ± 1.85; Ophn1−/y treated with fasudil: 3.40 ± 1.73; two-way ANOVA followed by Tukey's test, p = 0.007). D, Number of interictal events per 10 min of recording. Interictal discharges are significantly prevented in KO animals administered with fasudil (Ophn1−/y treated with water: 26.22 ± 2.59; Ophn1−/y treated with fasudil: 15.91 ± 2.43; two-way ANOVA followed by Tukey's test, p = 0.008). Each point represents one animal. Histograms indicate mean ± SEM. **p < 0.01; ***p < 0.001.
Figure 4.
Figure 4.
A single fasudil administration is not effective in rescuing the electrographic alterations in Ophn1 KO mice. Fasudil (FAS) was intraperitoneally administered in a group of KO mice (n = 7) at two different doses, 10 mg/kg and 25 mg/kg. Intraperitoneal injection of vehicle (saline solution) was used as control. No significant changes were found for the electrophysiological parameters: A, Number of seizures per 10 min of recording (two-way RM ANOVA, p = 0.203), B, Time spent in ictal activity per 10 min of recording (two-way RM ANOVA, p = 0.139), and C, Number of interictal events per 10 min of recording (two-way RM ANOVA, p = 0.404). Data are normalized on their baseline value (pretreatment condition) which is indicated in the plot by the dotted line. Histograms indicate mean ± SEM.
Figure 5.
Figure 5.
Reduction of NPY-positive interneurons in KO mice and rescue by fasudil administration in the hilus of hippocampus. A, Representative images showing examples of NPY labeling in the four group of animals in the hilus of hippocampus. Dotted lines define the region where interneurons were counted. DG: dentate gyrus. Scale bar, 100 μm. B, Number of NPY-positive cells in WT (n = 5), WT with fasudil (n = 5), KO (n = 6), and KO with fasudil (n = 6) animals. The data show a significant impairment in the number of NPY-positive cells in KO mice compared with WT animals (Ophn1+/y: 1408.80 ± 108.95; Ophn1−/y: 1000.00 ± 99.46; two-way ANOVA, followed by Tukey's test, *p = 0.013). This reduction was counteracted by 7 weeks of fasudil treatment in KO mice (Ophn1−/y treated with fasudil: 1361.67 ± 99.46; two-way ANOVA, followed by Tukey's test, *p = 0.02). All data are shown as mean ± SEM. C, Number of SOM-positive cells in WT (n = 5), WT with fasudil (n = 5), KO (n = 6) and KO with fasudil (n = 6). No significant difference was found between WT and KO animals (Ophn1+/y: 1107.60 ± 106.68; Ophn1−/y: 994.00 ± 97.39; two-way ANOVA, p = 0.413). Seven weeks of fasudil administration had no impact on the number of SOM-positive cells (Ophn1−/y treated with fasudil: 1213.00 ± 97.39; two-way ANOVA, p = 0.084). D, Number of PV-positive cells in WT (n = 5), WT with fasudil (n = 5), KO (n = 6), and KO with fasudil (n = 6). No significant difference was found between WT and KO groups of animals but only a tendency to decrease in KO animals (two-way ANOVA, p = 0.127). All data are shown as mean ± SEM.
Figure 6.
Figure 6.
Decrease of PV-positive interneurons in KO mice and rescue by fasudil administration in the CA1 region of hippocampus. A, Representative images showing examples of PV labeling in the four groups of animals in the hippocampal CA1 subregion. Dotted lines define the region where cell counts were performed. s.o., Stratum oriens; s.r., stratum radiatum. Scale bar, 50 μm. B, Density of PV-positive interneurons in WT (n = 4), WT with fasudil (n = 4), KO (n = 4) and KO with fasudil (n = 4) (number of cells × mm3). A significant decrease of PV-positive cells was found in KO animals with respect to WT mice (Ophn1+/y: 1976.29 ± 233.32; Ophn1−/y: 1344.02 ± 46.06; two-way ANOVA, followed by Tukey's test, **p = 0.01). fasudil treatment significantly enhanced the density of PV-positive interneurons in KO animals (Ophn1−/y treated with fasudil: 2014.89 ± 116.62; two-way ANOVA, followed by Tukey's test, **p = 0.007). All data are shown as mean ± SEM. C, Density of NPY interneurons in the different groups. No significant difference was found between WT and KO animals (Ophn1+/y: 1969.76 ± 185.30; Ophn1−/y: 2160.32 ± 247.103; two-way ANOVA, p = 0.352). Seven weeks of fasudil administration had no impact on the number of NPY-positive cells (Ophn1−/y treated with fasudil: 1947.77 ± 293.66; two-way ANOVA p = 0.238). D, Density of SOM interneurons in the different groups. No significant difference was found between WT and KO groups of animals (two-way ANOVA, p = 0.830). All data are shown as mean ± SEM.
Figure 7.
Figure 7.
Normal postsynaptic phenotype of PV- and SOM-positive clusters in the dentate gyrus and CA1 of Ophn1 KO mice. A, Representative images of PV (green)-Geph (red) immunolabeling in the dentate gyrus (DG) and CA1 region of WT and KO animals. The dotted lines define the regions where analyses have been performed (for DG, s.m. refers to stratum moleculare, g.c,l. to granule cell layer, h. to hilus; for CA1, s.o. refers to stratum oriens; s.r. to stratum radiatum; p.l. to pyramidal layer). Scale bar, 25 μm. B, Colocalization between PV and Geph clusters in the dentate gyrus and CA1. The analysis revealed no substantial changes in KO animals compared with controls (DG, t test, p = 0.526; CA1, t test, p = 0.325). C, Representative images of SOM (green)-Geph (red) immunolabeling in the dentate gyrus (DG) and CA1 region of WT and KO animals. Abbreviations as above. Scale bar, 25 μm. D, Colocalization between SOM and Geph in the dentate gyrus and CA1. No significant difference was found between WT and KO animals (DG, t test, p = 0.893; CA1, t test, p = 0.776). All data are shown as mean ± SEM.
Figure 8.
Figure 8.
Alterations in presynaptic terminals of PV interneurons are rescued after 7 weeks of fasudil treatment. A, B, Representative images showing examples of PV (green)-SYNT2 (red) double labeling in the four groups of animals in the dentate gyrus (DG, A) and CA1 (B) region of hippocampus. Yellow puncta represent the sites of colocalization. The dotted lines define the regions where analyses have been performed. Abbreviations as in Figure 7. Scale bar, 25 μm. C, Percentage of colocalization between PV and SYNT2 in the four groups of animals in the dentate gyrus of hippocampus. A robust decrease of double positive boutons (PV-SYNT2) was observed in KO mice with respect to controls (Ophn1+/y: 48.85 ± 1.66; Ophn1−/y: 36.66 ± 4.75; two-way ANOVA, followed by Tukey's test, **p = 0.002). The data also indicated that fasudil treatment significantly rescued this impairment, by enhancing the percentage of colocalization (Ophn1−/y treated with fasudil: 52.11 ± 0.95; two-way ANOVA, followed by Tukey's test, ***p < 0.001). D, Percentage of colocalization between PV and Synt2 in the four groups of animals in CA1. A consistent reduction of double positive PV-SYNT2 boutons was also found in the CA1 region of KO animals compared with WT mice (Ophn1+/y: 53.30 ± 1.99; Ophn1−/y: 46.27 ± 3.73; two-way ANOVA, followed by Tukey's test, *p = 0.038). Administration of fasudil recovered a normal PV-SYNT2 colocalization (Ophn1−/y treated with fasudil: 59.68 ± 0.98; two-way ANOVA, followed by Tukey's test, ***p < 0.001). WT mice treated with fasudil also showed enhanced PV-SYNT2 double staining (62.04 ± 1.62; two-way ANOVA, followed by Tukey's test, *p = 0.012). All data are shown as mean ± SEM.
Figure 9.
Figure 9.
Alterations in presynaptic terminals of SOM interneurons are rescued after 7 weeks of fasudil treatment. A, B, Representative images showing examples of SOM (green)-VGAT(red) double labeling in the four groups of animals in the dentate gyrus (DG, A) and CA1 (B) region of hippocampus. The yellow puncta represent the sites of colocalization. The dotted lines define the regions where analyses have been performed. Abbreviations are as in Figures 7 and 8. Scale bar, 25 μm. C, Percentage of colocalization between SOM and VGAT in the four groups of animals in the dentate gyrus of hippocampus. We observed a significant increase of SOM-VGAT double positive boutons in KO animals compared with WT mice (Ophn1+/y: 15.93 ± 1.80; Ophn1−/y: 34.96 ± 4.77; two-way ANOVA, followed by Tukey's test, ***p < 0.001). Seven weeks of fasudil treatment had a robust impact in reducing the percentage of SOM-VGAT-positive terminals (Ophn1−/y treated with fasudil: 17.54 ± 0.79; two-way ANOVA, followed by Tukey's test, ***p < 0.001). D, Percentage of colocalization between SOM and VGAT in the four groups of animals in the CA1 region of hippocampus. KO animals showed an increased percentage of SOM-VGAT colocalization compared with controls (Ophn1+/y: 28.93 ± 3.85; Ophn1−/y: 42.14 ± 5.14; two-way ANOVA, followed by Tukey's test, **p = 0.008). This phenotype was recovered after fasudil treatment (Ophn1−/y treated with fasudil: 21.41 ± 1.53; two-way ANOVA, followed by Tukey's test, ***p < 0.001). All data are shown as mean ± SEM.

Similar articles

Cited by

References

    1. Allegra M, Genovesi S, Maggia M, Cenni MC, Zunino G, Sgadò P, Caleo M, Bozzi Y (2014) Altered GABAergic markers, increased binocularity and reduced plasticity in the visual cortex of engrailed-2 knockout mice. Front Cell Neurosci 8:163. 10.3389/fncel.2014.00163 - DOI - PMC - PubMed
    1. Allegra M, Spalletti C, Vignoli B, Azzimondi S, Busti I, Billuart P, Canossa M, Caleo M (2017) Pharmacological rescue of adult hippocampal neurogenesis in a mouse model of X-linked intellectual disability. Neurobiol Dis 100:75–86. 10.1016/j.nbd.2017.01.003 - DOI - PMC - PubMed
    1. Antonucci F, Bozzi Y, Caleo M (2009) Intrahippocampal infusion of botulinum neurotoxin E (BoNT/E) reduces spontaneous recurrent seizures in a mouse model of mesial temporal lobe epilepsy. Epilepsia 50:963–966. 10.1111/j.1528-1167.2008.01983.x - DOI - PubMed
    1. Avoli M, de Curtis M (2011) GABAergic synchronization in the limbic system and its role in the generation of epileptiform activity. Prog Neurobiol 95:104–132. 10.1016/j.pneurobio.2011.07.003 - DOI - PMC - PubMed
    1. Ben-Ari Y. (1985) Limbic seizure and brain damage produced by kainic acid: mechanisms and relevance to human temporal lobe epilepsy. Neuroscience 14:375–403. 10.1016/0306-4522(85)90299-4 - DOI - PubMed

Publication types

MeSH terms

Substances