. 2020 Feb 25;11(1):1035.
doi: 10.1038/s41467-020-14844-6.

Measuring single cell divisions in human tissues from multi-region sequencing data

Affiliations

Measuring single cell divisions in human tissues from multi-region sequencing data

Benjamin Werner et al. Nat Commun. .

Abstract

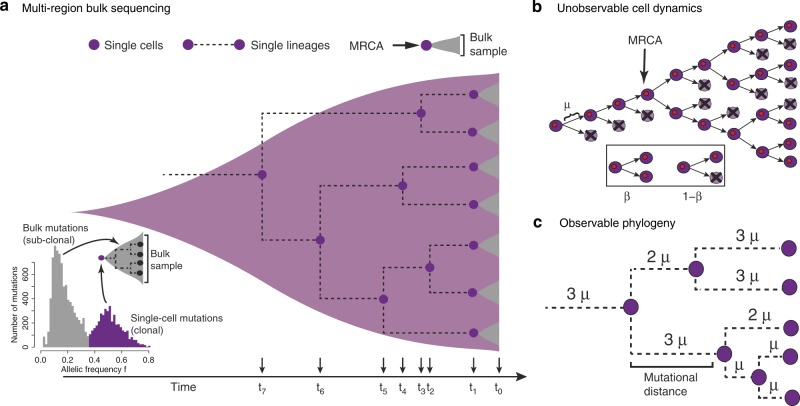
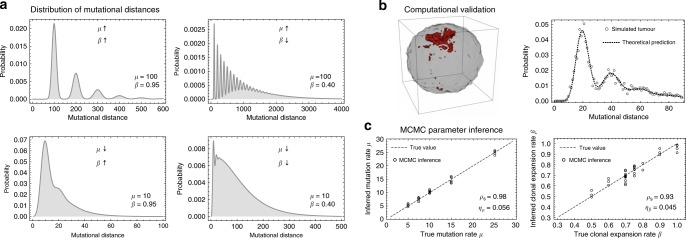
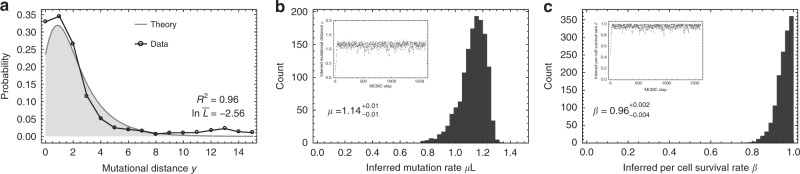
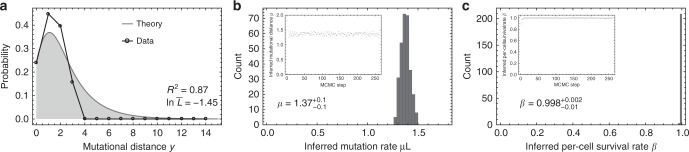
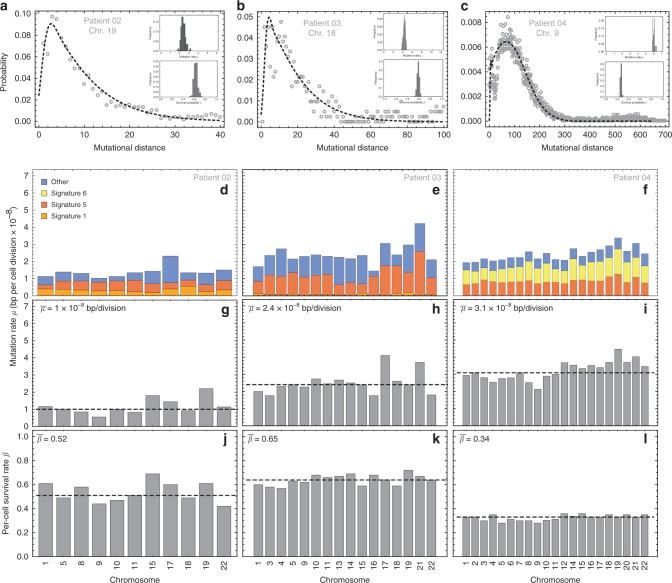
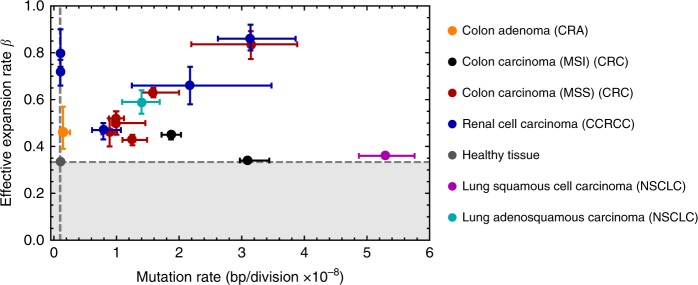
Both normal tissue development and cancer growth are driven by a branching process of cell division and mutation accumulation that leads to intra-tissue genetic heterogeneity. However, quantifying somatic evolution in humans remains challenging. Here, we show that multi-sample genomic data from a single time point of normal and cancer tissues contains information on single-cell divisions. We present a new theoretical framework that, applied to whole-genome sequencing data of healthy tissue and cancer, allows inferring the mutation rate and the cell survival/death rate per division. On average, we found that cells accumulate 1.14 mutations per cell division in healthy haematopoiesis and 1.37 mutations per division in brain development. In both tissues, cell survival was maximal during early development. Analysis of 131 biopsies from 16 tumours showed 4 to 100 times increased mutation rates compared to healthy development and substantial inter-patient variation of cell survival/death rates.


Conflict of interest statement

The authors declare no competing interests.

Figures

Fig. 1
Fig. 1. Multi-sample bulk sequencing encodes information on single cell lineages and single cell divisions.
a Each of the seven spatially separated tissue samples (in grey) consists of thousands to millions of cells that descended from a single most recent common ancestor (MRCA) cell. The genomic make-up of the single ancestral cell is described by the mutations clonal to the bulk sample. Those appear at high variant allele frequency in the sample (bottom-left panel, in purple). The intersection of mutations in any two bulk MRCA cells corresponds to the genomic profile of another more ancestral cell. This process continues back in time until the MRCA cell of all the sampled cells is reached. b The level of genomic variation within a growing tissue (e.g. development or cancer) is the direct consequence of mutation accumulation during cell divisions, leading to a branching structure. Importantly, the most fundamental parameters, the mutation rate μ and survival rate β of cells per division that drive this process are not directly observable. c Mutation rate per division μ and cell survival rate β leave identifiable fingerprints in the observable patterns of genetic heterogeneity within a tissue. Cell divisions occur in increments of natural numbers and thus the mutational distance between any two ancestral cells is a multiple of the mutation rate μ.
Fig. 2
Fig. 2. Distribution of mutational distances and computational validation.
a The quantised nature of cell divisions leads to a characteristic predicted distribution of mutational distances across cell lineages. The shape of the distribution depends on the exact values of μ and β. Roughly four different scenarios of combinations of small and large μ and β are possible. They influence the shape of the distribution differently and thus constructing the distribution of mutational distances allows disentangling the mutation rate μ and cell survival rate β. b Spatial stochastic simulations confirm the ability of mutational distance distributions to disentangle mutation and lineage expansion rates (red area shows the spatial spread of a subclonal mutation). Dots show mutational distances inferred from 200 samples of a single stochastic computer simulation (μ = 20, β = 0.95), the dashed line is the predicted distribution based on our Eq.(7). c A Monte Carlo Markov Chain inference framework based on mutational distance distributions reliably identifies mutation and lineage expansion rates in simulations of spatial and stochastically growing tissues (two-dimensional spatial stochastic simulations, μ: Spearman Rho = 0.98, p = 4 × 10–23; β: Spearman Rho = 0.93, p = 8 × 10–16, Relative error: ημ = 0.056, ηβ = 0.045).
Fig. 3
Fig. 3. Per-cell mutation and per-cell survival rate inferences in healthy haematopoiesis during development.
a Mutational distance distribution inferred from 89 whole-genome sequenced healthy haematopoietic stem cells from ref. (black dots), and best theoretical fit (grey line). Posterior parameter distribution of the MCMC inference for b the mutation rate per cell division (μL=1.140.24+0.12 mutations per genome per cell division) and c the cell survival rate (β=0.960.102+0.038). Median point estimates and 95% credibility intervals were taken from the posterior parameter distributions. The inferred mutation rate per cell division agrees with the original estimation of 1.2 mutations per cell division. Furthermore, our joined inference of mutation and cell survival rate confirms the original assumption of no cell death during early development of haematopoiesis.
Fig. 4
Fig. 4. Per-cell mutation and per-cell survival rate inferences in single neurons during development.
a Mutational distance distribution inferred from 14 whole-genome sequenced single neurons from ref. derived from one fetus (17 weeks past conception) (black dots), and best theoretical fit (grey line). MCMC inference for b the mutation rate per cell division (μL=1.370.1+0.1 mutations per genome per cell division) and c the per-cell survival rate (β=0.9980.01+0.002). Median point estimates and 95% credibility intervals were taken from the posterior parameter distributions. The inferred mutation rate per cell division agrees with the original estimation of 1.3 mutations per cell division. Furthermore, our joined inference of mutation and cell survival rate confirms the original assumption of no cell death during early brain development.
Fig. 5
Fig. 5. Mutational distance for three colorectal tumours.
ac Examples of the mutational distance distribution on single chromosomes for three different colorectal carcinomas for which 6, 7 and 9 multi-region bulk samples were sequenced at whole-genome resolution (dots = data, dashed line = theoretical prediction based on MCMC parameter estimates—see insets). The distribution of mutational distances differs between patients, with Patient 04 (MSI Microsatellite Instability) showing one order of magnitude larger mutational distances. df Per-cell mutation rate per chromosome separated by trinucleotide mutational signature. Results are consistent across chromosomes, as expected (Methods). gi The mean overall mutation rates are μ02=(1.00.07+0.46)×108,μ03=(2.40.19+0.41)×108andμ04=3.10.12+0.35×10⁸bpdivision, dashed lines), 20–60 times higher compared to healthy somatic cells. Patient 04 is MSI+ highlighted by signature 6. jl Estimates of per-cell survival rates per chromosome are consistent across chromosomes of the same patient (Median: β02=0.510.05+0.05,β03=0.650.02+0.02,β04=0.340.01+0.01), but vary considerably between patients (Supplementary Fig. 12).
Fig. 6
Fig. 6. Map of per-cell mutation and per-cell survival rates across cancer types.
For each of the 16 tumours analysed we plot the per-cell mutation rate versus the per-cell survival rate. Median estimates and 95% credibility intervals for the mutation and cell survival rate are derived from the MCMC inferences as described in the main text. Dashed lines correspond to values of healthy tissue (μh = 1 × 10−9, βh = 1/3). White background corresponds to β values that allow for growing cell populations as β = 1/3 corresponds to stable (homeostatic) populations. Shaded area describes values of β that would lead to population extinction. Most cancers scatter across the map, indicating extensive inter-patient heterogeneity.

References

    1. Sun J, et al. Clonal dynamics of native haematopoiesis. Nature. 2014;514:322–327. doi: 10.1038/nature13824. - DOI - PMC - PubMed
    1. Busch K, et al. Fundamental properties of unperturbed haematopoiesis from stem cells in vivo. Nature. 2015;518:542–546. doi: 10.1038/nature14242. - DOI - PubMed
    1. Frank SA. Somatic evolutionary genomics: mutations during development cause highly variable genetic mosaicism with risk of cancer and neurodegeneration. Proc. Natl Acad. Sci. USA. 2010;107:1725–1730. doi: 10.1073/pnas.0909343106. - DOI - PMC - PubMed
    1. Nowell P. The clonal evolution of tumor cell populations. Science. 1976;194:23–28. doi: 10.1126/science.959840. - DOI - PubMed
    1. Greaves M, Maley CC. Clonal evolution in cancer. Nature. 2012;481:306–313. doi: 10.1038/nature10762. - DOI - PMC - PubMed

Publication types