Review
. 2020 Jan 31:12:33-44.
doi: 10.2147/EB.S226319. eCollection 2020.

Ganglion Cell Complex Analysis in Glaucoma Patients: What Can It Tell Us?

Affiliations
Review

Ganglion Cell Complex Analysis in Glaucoma Patients: What Can It Tell Us?

Gianluca Scuderi et al. Eye Brain. .

Abstract

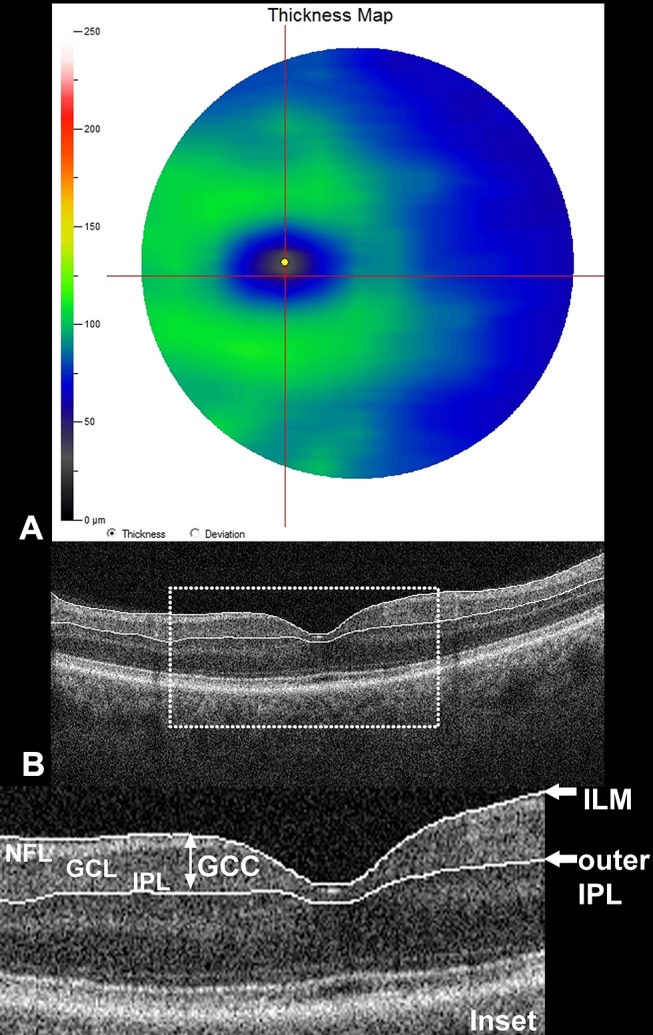
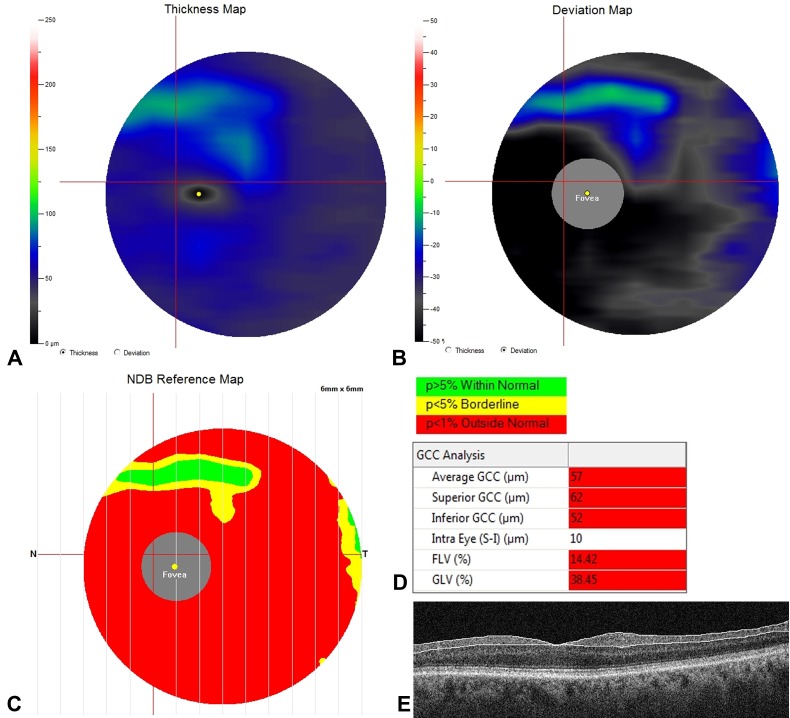
Glaucoma is a group of optic neuropathies characterized by a progressive degeneration of retina ganglion cells (RGCs) and their axons that precedes functional changes detected on the visual field. The macular ganglion cell complex (GCC), available in commercial Fourier-domain optical coherence tomography, allows the quantification of the innermost retinal layers that are potentially involved in the glaucomatous damage, including the retinal nerve fiber (RNFL), ganglion cell and inner plexiform layers. The average GCC thickness and its related parameters represent a reliable biomarker in detecting preperimetric glaucomatous damage. The most accurate GCC parameters are represented by average and inferior GCC thicknesses, and they can be associated with progressive visual field loss. Although the diagnostic accuracy increases with more severe glaucomatous damage and higher signal strength values, it is not affected by increasing axial length, resulting in a more accurate discrimination of glaucomatous damage in myopic eyes with respect to the traditional RNFL thickness. The analysis of the structure-function relationship revealed a good agreement between the loss in retinal sensitivity and GCC thickness. The use of a 10-2° visual field grid, adjusted for the anatomical RGCs displacement, describes more accurately the relationship between RGCs thickness and visual field sensitivity loss.

Keywords: retinal ganglion cells; retinal nerve fiber layer; spectral-domain optical coherence tomography; standard automated perimetry.


Conflict of interest statement

The authors report no conflicts of interest in this work.

Figures

Figure 1
Figure 1
Ganglion cell complex (GCC) analysis and segmentation. (A) Thickness map, automatically calculated using RTVue Fourier-domain optical coherence tomography (FD-OCT); (B) Cross-sectional FD-OCT B-scan with segmentation of the GCC. The inset (dotted square) depicts the three anatomical layers included in the GCC analysis: nerve fiber layer (NFL), ganglion cell layer (GCL) and inner plexiform layer (IPL). The traced boundaries for the GCC scan (white arrows) pass from the inner limiting membrane and outer IPL.
Figure 2
Figure 2
Quantification of ganglion cell complex (GCC) using Fourier-domain optical coherence tomography (FD-OCT) in the case of severe glaucomatous ganglion cell loss. Three different colorimetric maps were automatically computed by the FD-OCT software (RTVue-100 software; Optovue, Inc., Fremont, CA). (A) Thickness map, displaying diffuse blue and black colors indicating severe and diffuse loss of GCC thickness. The central black spot indicates the fovea where the ganglion cells are missing. (B) Deviation map, illustrating the percentage of thickness loss with respect to the normative database. Black coloring indicates a GCC loss of 50% or greater. (C) Significance map, displaying the significant thickness change variation from normal, where green represents values within the normal range (p-value 5–95%), yellow indicates borderline results (< 5%) and red represents results outside the normal limits (< 1%); (D) Quantitative indexes calculated by the software, including average thickness, hemifield thicknesses (superior, inferior and intra-eye) and the two pattern-based diagnostic indexes (i.e., focal loss volume [FLV] and global loss volume [GLV]); (E) Cross-sectional B-scan displays the segmentation used for GCC analysis.

References

    1. Alqawlaq S, Flanagan JG, Sivak JM. All roads lead to glaucoma: induced retinal injury cascades contribute to a common neurodegenerative outcome. Exp Eye Res. 2019;183:88–97. doi:10.1016/j.exer.2018.11.005 - DOI - PubMed
    1. Sivak JM. The aging eye: common degenerative mechanisms between the Alzheimer’s brain and retinal disease. Invest Ophthalmol Vis Sci. 2013;54(1):871–880. doi:10.1167/iovs.12-10827 - DOI - PubMed
    1. Delgado MF, Nguyen NT, Cox TA, et al. Automated perimetry: a report by the American Academy of Ophthalmology. Ophthalmology. 2002;109(12):2362–2374. doi:10.1016/S0161-6420(02)01726-8 - DOI - PubMed
    1. Iester M, Capris E, De Feo F, et al. Agreement to detect glaucomatous visual field progression by using three different methods: a multicentre study. Br J Ophthalmol. 2011;95(9):1276–1283. doi:10.1136/bjo.2010.189456 - DOI - PubMed
    1. Rao HL, Kumar AU, Babu JG, Senthil S, Garudadri CS. Relationship between severity of visual field loss at presentation and rate of visual field progression in glaucoma. Ophthalmology. 2011;118(2):249–253. doi:10.1016/j.ophtha.2010.05.027 - DOI - PubMed

LinkOut - more resources