. 2020 Apr 23;71(8):2451-2463.
doi: 10.1093/jxb/eraa092.

New opportunities and insights into Papaver self-incompatibility by imaging engineered Arabidopsis pollen

Affiliations

New opportunities and insights into Papaver self-incompatibility by imaging engineered Arabidopsis pollen

Ludi Wang et al. J Exp Bot. .

Abstract

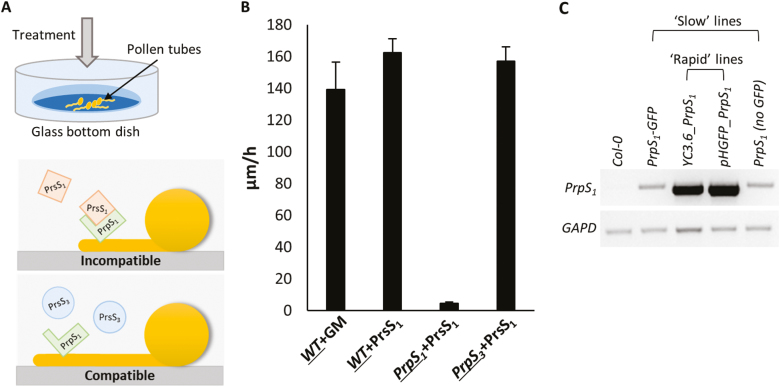
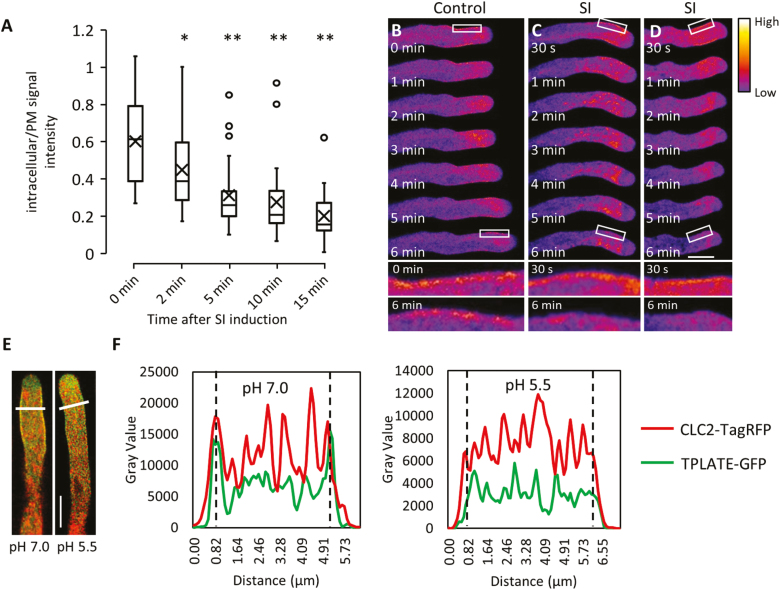
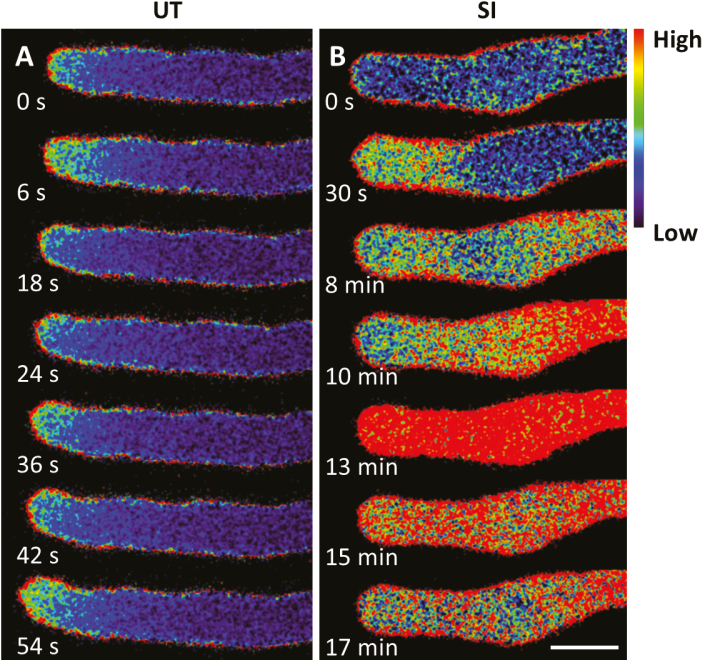
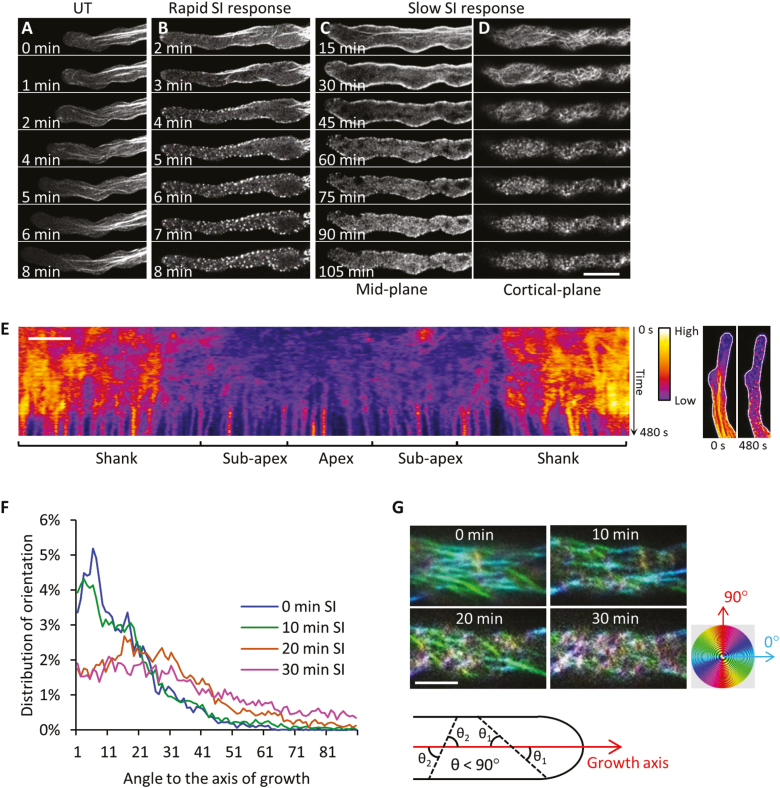
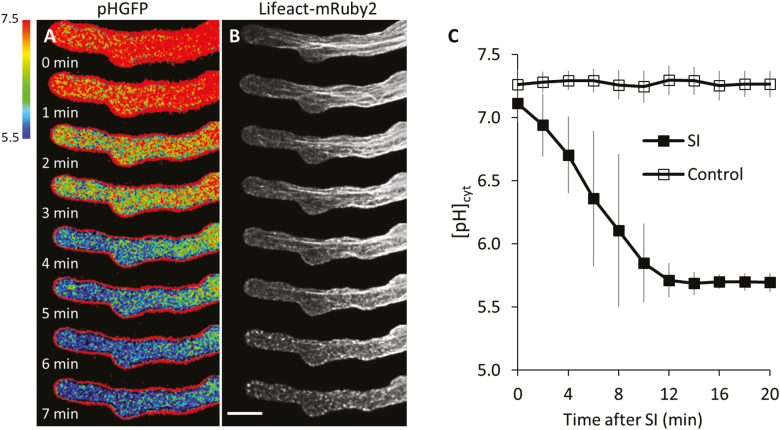
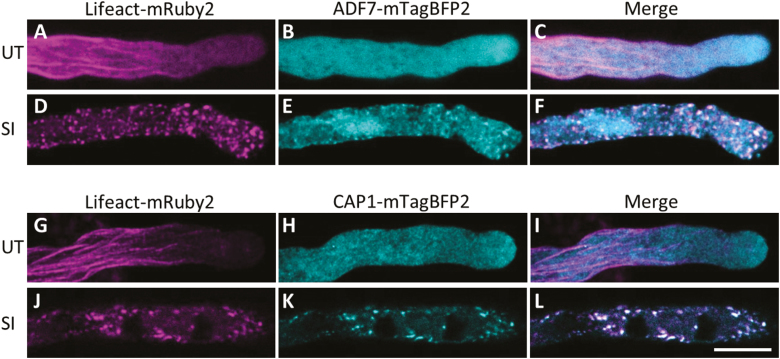
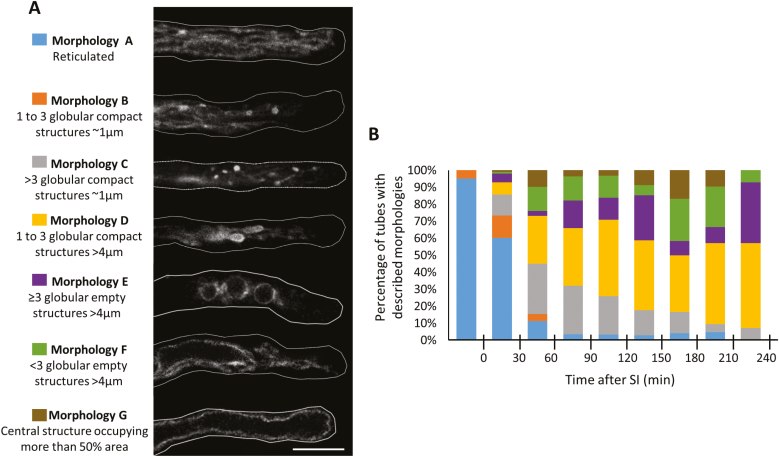
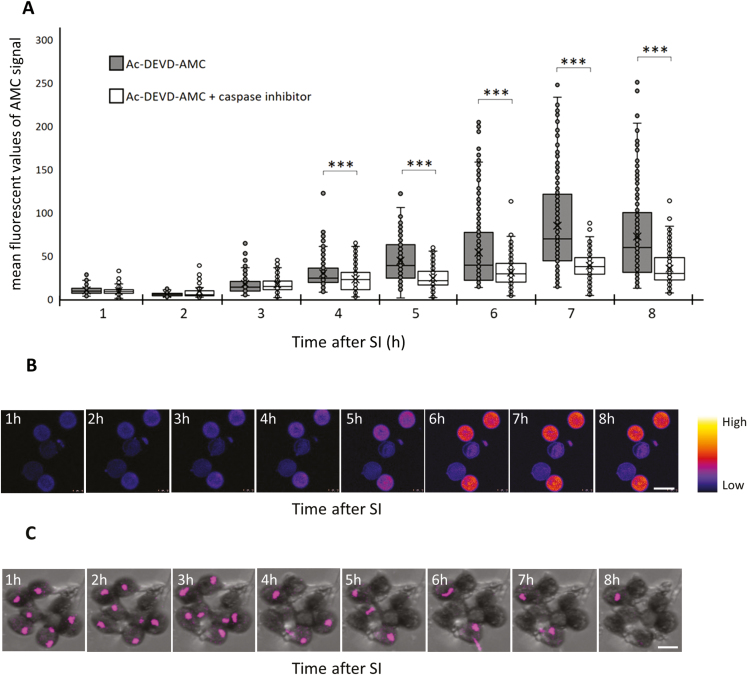
Pollen tube growth is essential for plant reproduction. Their rapid extension using polarized tip growth provides an exciting system for studying this specialized type of growth. Self-incompatibility (SI) is a genetically controlled mechanism to prevent self-fertilization. Mechanistically, one of the best-studied SI systems is that of Papaver rhoeas (poppy). This utilizes two S-determinants: stigma-expressed PrsS and pollen-expressed PrpS. Interaction of cognate PrpS-PrsS triggers a signalling network, causing rapid growth arrest and programmed cell death (PCD) in incompatible pollen. We previously demonstrated that transgenic Arabidopsis thaliana pollen expressing PrpS-green fluorescent protein (GFP) can respond to Papaver PrsS with remarkably similar responses to those observed in incompatible Papaver pollen. Here we describe recent advances using these transgenic plants combined with genetically encoded fluorescent probes to monitor SI-induced cellular alterations, including cytosolic calcium, pH, the actin cytoskeleton, clathrin-mediated endocytosis (CME), and the vacuole. This approach has allowed us to study the SI response in depth, using multiparameter live-cell imaging approaches that were not possible in Papaver. This lays the foundations for new opportunities to elucidate key mechanisms involved in SI. Here we establish that CME is disrupted in self-incompatible pollen. Moreover, we reveal new detailed information about F-actin remodelling in pollen tubes after SI.

Keywords: Actin; actin-binding proteins (ABPs); calcium; endocytosis; fluorescent probes; live-cell imaging; pH; pollen tube growth; programmed cell death (PCD); self-incompatibility (SI).


Figures

Fig. 1.
Fig. 1.
S-specific inhibition of in vitro growth of transgenic Arabidopsis pollen tubes undergoing an incompatible response. (A) Cartoon illustrating the in vitro pollen tube growth system in liquid germination medium (GM). Treatment of a transgenic Arabidopsis pollen tube expressing PrpS1 with recombinant PrsS1 triggers inhibition, as it is an incompatible combination, but when PrsS3 is added to a pollen tube expressing PrpS1 (a compatible combination), pollen tube growth is not inhibited. (B) In vitro growth rates of pollen tubes. Wild-type (WT) pollen tubes treated with GM or recombinant PrsS1 have normal growth rates; pollen tubes expressing PrpS3 treated with recombinant PrsS1 are compatible and display normal growth rates; pollen tubes expressing PrpS1 treated with recombinant PrsS1 are incompatible and pollen tube growth is arrested (n=60). The pollen genotype is underlined. (C) Semi-quantitative RT–PCR shows the different expression levels of PrpS1 in transgenic A. thaliana lines harbouring constructs containing PrpS1 used in this study. GAPD was used as an internal control. ‘Slow’ and ‘rapid’ refer to the speed of the SI response associated with low and high PrpS1 expression levels, respectively.
Fig. 2.
Fig. 2.
CME is inhibited after SI induction and cytosolic acidification. (A) Boxplots showing quantification of the FM4-64 signal intensity as a ratio (in the cytoplasm versus on the plasma membrane) at different time points after SI induction. Significance levels are based on comparisons with ‘0 min’. *P<0.01 and **P<0.001 with Kruskal–Wallis ANOVA on ranks (n=34, 31, 30, 28, and 27 for time points 0, 2, 5, 10, and 15 min, respectively). (B) Time-lapse fluorescent images showing the localization of TPLATE–TagRFP at the subapical plasma membrane region of a growing pollen tube; see also higher magnification images of selected areas (white box) after 0 min and 6 min. (C and D) After SI induction, the localization of TPLATE–TagRFP at the plasma membrane is rapidly lost; see also higher magnification images after 6 min. The position of the RFP signal on the plasma membrane immediately after treatment is clearly visible at higher magnification. The fluorescence intensity of TPLATE–TagRFP is indicated by the colour gradient. Corresponding fluorescence intensity profiles are shown in Supplementary Fig. S2. Scale bar=10 μm. (E) Representative images showing the co-localization of TPLATE–GFP (green) and CLC2–TagRFP (red) at the plasma membrane at cytosolic pH 7.0 while plasma membrane recruitment is abolished at pH 5.5. Scale bar=10 μm. (F) Fluorescence intensity profiles for the pollen tubes along the white lines indicated in (E). Dashed lines indicate the position of the plasma membrane.
Fig. 3.
Fig. 3.
Cytosolic free Ca2+ increases in Arabidopsis pollen tubes during the SI response. Representative ratio-imaging examples of Arabidopsis pollen tubes expressing PrpS1 and YC3.6 without treatment (A, untreated, UT) and after treatment with PrsS1 (B, SI). Scale bar=10 μm.
Fig. 4.
Fig. 4.
F-actin remodelling in Arabidopsis pollen tubes during the SI response. (A–D) Time-lapse images showing SI-induced remodelling of the F-actin cytoskeleton using Lifeact-mRuby2 as a marker, in pollen tubes of two Arabidopsis lines with different expression levels of PrpS1. (A) The F-actin cytoskeleton of an untreated growing pollen tube. (B) Remodelling of the F-actin cytoskeleton during an SI response in an Arabidopsis ‘rapid’ line with a high level of expression of PrpS1. (C) Mid-plane images of a time-lapse sequence showing remodelling of the F-actin cytoskeleton during an SI response in an Arabidopsis ‘slow’ line with a low level of expression of PrpS1. (D) Cortical plane images of the pollen tube shown in (C). (E) Pseudocoloured kymograph analysis of F-actin (monitored with Lifeact-mRuby2) adjacent to the plasma membrane of a representative pollen tube (maximum projection) during the SI response in a ‘rapid’ line. The fluorescence intensity in the kymograph indicates the amount of F-actin near the plasma membrane of the pollen tube (shown by white lines in the images on the right). The fluorescence intensity is indicated by the colour gradient. Scale bar=5 μm. (F) Alterations in the distribution of the angles between F-actin filaments and the growth axis of the pollen tube at different time points after SI induction. (G) Representative images show the rearrangement of F-actin filament arrays at the cortical region of pollen tubes during the early stages of SI. The spectrum disc indicates the pseudocolours applied to actin filaments based on their orientations relative to the growth axis of the pollen tube. The diagram demonstrates the angles (θ 1, θ 2 …) between actin filaments (dashed lines) and the growth axis (red arrow) of the pollen tube. Only the sharp angles (θ<90°) were measured. Scale bar=10 μm.
Fig. 5.
Fig. 5.
Rapid cytosolic acidification and remodelling of the actin cytoskeleton in Arabidopsis pollen tubes during the SI response. (A) Representative time-lapse ratio-images of pHGFP in pollen tubes of a ‘rapid’ line after treatment with PrsS1 to induce SI. (B) Remodelling of F-actin visualized with Lifeact-mRuby2 in the same pollen tube as shown in (A) during the SI response. Scale bar=10 μm. (C) Quantification of the changes in cytosolic pH after SI induction (SI; n=20) or treatment with inactivated PrsS1 (control; n=10). Error bars indicate the SD.
Fig. 6.
Fig. 6.
SI induction leads to the co-localization of ADF7 and CAP1 with F-actin foci. ADF7–mTagBFP2, CAP1–mTagBFP2 (both in cyan), and F-actin localization (Lifeact-mRuby2 in magenta) are shown in untreated pollen tubes expressing PrpS1 (A–C and G–I) or after SI induction (D–F and J–L). In untreated pollen tubes, ADF7 and CAP1 were distributed throughout the cytoplasm, with no major co-localization with F-actin (C and I). After SI induction, ADF7 and CAP1 co-localized with F-actin foci (F and L, respectively). Co-localization shows as white. Scale bar=10 μm.
Fig. 7.
Fig. 7.
Changes in vacuolar morphologies in pollen tubes during the SI response. (A) Categorization and descriptions of different vacuolar morphologies observed in transgenic Arabidopsis pollen tubes after SI induction. The different morphologies were categorized according to the distribution of VAMP711–mCherry, a vacuolar membrane-localized protein, in the median focal plane of the pollen tubes. Scale bar=10 µm. (B) Quantification of pollen tubes exhibiting the vacuolar morphologies shown in (A) at different time points during the SI response.
Fig. 8.
Fig. 8.
SI induction activates a DEVDase/caspase-3-like activity and nuclear disruption in Arabidopsis pollen. (A) Quantification of AMC fluorescence provides a measure of DEVDase/caspase-3-like activity in pollen grains during the SI response in the absence/presence of the caspase-3 inhibitor Ac-DEVD-CHO (n=100–350). (B) Representative time-lapse images showing the increase in the AMC fluorescent signal in pollen grains after SI induction. Scale bar=20 µm. (C) Nuclear disruption after SI induction indicated by the loss of NLS–tdTomato signal (magenta) in the nucleus. Scale bar=20 µm.

References

    1. Allwood EG, Anthony RG, Smertenko AP, Reichelt S, Drobak BK, Doonan JH, Weeds AG, Hussey PJ. 2002. Regulation of the pollen-specific actin-depolymerizing factor LlADF1. The Plant Cell 14, 2915–2927. - PMC - PubMed
    1. Barnanas B, Fridvalszky L. 1984. Adhesion and germination of differently treated maize pollen grains on the stigma. Acta Botanica Hungarica 30, 329–332.
    1. Bascom CS Jr, Winship LJ, Bezanilla M. 2018. Simultaneous imaging and functional studies reveal a tight correlation between calcium and actin networks. Proceedings of the National Academy of Sciences, USA 115, E2869–E2878. - PMC - PubMed
    1. Bedinger PA, Broz AK, Tovar-Mendez A, McClure B. 2017. Pollen–pistil interactions and their role in mate selection. Plant Physiology 173, 79–90. - PMC - PubMed
    1. Bilkova E, Pleskot R, Rissanen S, et al.. 2017. Calcium directly regulates phosphatidylinositol 4,5-bisphosphate headgroup conformation and recognition. Journal of the American Chemical Society 139, 4019–4024. - PMC - PubMed

Publication types