. 2020 Apr;34(4):5642-5657.
doi: 10.1096/fj.201902105R. Epub 2020 Feb 25.

Abcg2-expressing side population cells contribute to cardiomyocyte renewal through fusion

Affiliations

Abcg2-expressing side population cells contribute to cardiomyocyte renewal through fusion

Amritha Yellamilli et al. FASEB J. 2020 Apr.

Abstract

The adult mammalian heart has a limited regenerative capacity. Therefore, identification of endogenous cells and mechanisms that contribute to cardiac regeneration is essential for the development of targeted therapies. The side population (SP) phenotype has been used to enrich for stem cells throughout the body; however, SP cells isolated from the heart have been studied exclusively in cell culture or after transplantation, limiting our understanding of their function in vivo. We generated a new Abcg2-driven lineage-tracing mouse model with efficient labeling of SP cells. Labeled SP cells give rise to terminally differentiated cells in bone marrow and intestines. In the heart, labeled SP cells give rise to lineage-traced cardiomyocytes under homeostatic conditions with an increase in this contribution following cardiac injury. Instead of differentiating into cardiomyocytes like proposed cardiac progenitor cells, cardiac SP cells fuse with preexisting cardiomyocytes to stimulate cardiomyocyte cell cycle reentry. Our study is the first to show that fusion between cardiomyocytes and non-cardiomyocytes, identified by the SP phenotype, contribute to endogenous cardiac regeneration by triggering cardiomyocyte cell cycle reentry in the adult mammalian heart.

Keywords: cardiac regeneration; cardiomyocyte proliferation; fusion; side population.


Figures

Figure 1.
Figure 1.
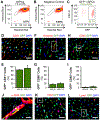
Bone marrow SPCs and intestinal stem cells give rise to differentiated lineages in vivo. A) Genetics of experimental Abcg2MCM/+ R26GFP/+ mice. B) Experimental timeline used to evaluate GFP-labeling in bone marrow and cardiac studies 72 hours and four weeks (green arrows) after five consecutive daily 2 mg tamoxifen injections (blue arrows). C) Experimental timeline used to induce recombination in intestinal studies. GFP-labeling was assessed 72 hours and four weeks after single 2 mg tamoxifen injections. D) Immunofluorescence images of sections from C57Bl/6J mice stained for ABCG2. E) Images of native GFP fluorescence of sections from tamoxifen-injected Abcg2MCM/+ R26GFP/+ mice at week 9. F) Flow cytometry plot of bone marrow SPCs (bmSPCs) in tamoxifen-injected Abcg2MCM/+ R26GFP/+ mice (bmSPCs within black gate, number within plot represents percent of bmSPCs for this sample). G) Corresponding flow cytometry plot of negative control stained with Verapamil (bmSPCs within black gate, number represents percent of bmSPCs for this sample). H) Flow cytometry plot of GFP fluorescence of bmSPCs (percent GFP+ bmSPCs above plot, mean ± SD, n=6). I) Flow cytometric analysis of bone marrow lineages labeled with GFP at week 9 (n=6) and week 13 (n=6). J) Native GFP fluorescent images of ileal sections from Abcg2MCM/+ R26GFP/+ mice 72 hours after a single tamoxifen injection with higher magnification image to the right. (K) Native GFP fluorescent images of ileal sections from Abcg2MCM/+ R26GFP/+ mice four weeks after a single tamoxifen injection with higher magnification image to the right. Scale bars: 50 μm; Statistical significance obtained by student’s t-test; ** P < 0.01 and *** P < 0.001.
Figure 2.
Figure 2.
Labeling of cSPCs and non-cardiomyocytes in vivo in the uninjured heart. A) Flow cytometry plot of cSPCs in Abcg2MCM/+ R26GFP/+ mice treated with tamoxifen (cSPCs within black gate, number inside plot is the percent of cSPCs for this sample, number above plot is mean ± SD, n=7). B) Corresponding flow cytometry plot of negative control cSPCs stained with Verapamil. C) Flow cytometry plot of GFP fluorescence of cSPCs (number within plot is the percent of GFP+ cSPCs for this sample, number above plot is the mean ± SD, n=7). D) Immunofluorescence image of CD31 staining on cardiac sections from tamoxifen-injected Abcg2MCM/+ R26GFP/+ mice. E) Flow cytometry analysis of the percent of CD31+ non-cardiomyocytes labeled with GFP at week 9 and week 13 (mean ± SD, n=4). F) Immunofluorescence image of Vimentin staining. G) Flow cytometry analysis of the percent of CD90+ non-cardiomyocytes labeled with GFP at week 9 and week 13 (mean ± SD, n=4). H) Immunofluorescence image of CD45 staining. I) Flow cytometry analysis of the percent of CD45+ non-cardiomyocytes labeled with GFP at week 9 and week 13 (mean ± SD, n=4). J) Immunofluorescence image of alpha-smooth muscle actin. K) Immunofluorescence image of NG2 chondroitin sulfate proteoglycan staining. L) Immunofluorescence image of Lyve1 staining. Scale bars: 50 μm; Statistical significance was obtained by student’s t-test; * P < 0.05.
Figure 3.
Figure 3.
CSPCs give rise to cardiomyocytes in vivo in the uninjured heart. A) Immunofluorescence image of Troponin I staining and native fluorescence of GFP on cardiac sections from tamoxifen-injected Abcg2MCM/+ R26GFP/+ mice. B) Immunofluorescence image of Troponin T staining and native GFP fluorescence of fixed, isolated adult cardiomyocytes. C) Image of native GFP fluorescence of live, isolated adult cardiomyocytes used to quantify GFP-labeling in tamoxifen-injected Abcg2MCM/+ R26GFP/+ mice. D) Higher-magnification image of GFP-labeled cardiomyocyte. E) Experimental timeline used to evaluate cardiomyocyte GFP-labeling 72 hours and four weeks (green arrows) after five consecutive daily 2 mg tamoxifen injections (blue arrows). F) Quantification of GFP-expressing cardiomyocytes as a percent of total live, rod-shaped cardiomyocytes at week 9 (n=5) and week 13 (n=7). G) Experimental timeline used to evaluate cardiomyocyte GFP-labeling 72-hours and 4 weeks following single 2 mg tamoxifen injection. H) Quantification of GFP-expressing cardiomyocytes at 72 hours (n=5) and 4 weeks (n=6) following a single 2 mg tamoxifen injection. I) Experimental timeline used for calcium dynamics measurements in Abcg2MCM/+ R26Tom/+ mice. J) Representative Fluo-4 traces of individual Tomato and Tomato+ cardiomyocytes with and without isoproterenol stimulation (Iso 100nM). K) Amplitude of pacing-induced cytosolic calcium traces (1Hz). L) Time (T) to peak Fluo-4 fluorescence of pacing-induced cytosolic calcium traces. M) Time from 5% to 95% of decay of Fluo-4 fluorescence of pacing-induced cytosolic calcium traces. N) Time constant of Ca2+ transient decay (Tau) of pacing-induced cytosolic calcium traces. O) Fractional shortening of cardiomyocytes. Scale bars: 50 μm. Statistical significance was obtained by student’s t-test to compare two groups and 2-way ANOVA to compare multiple groups; * P < 0.05, ** P < 0.01, *** P < 0.001.
Figure 4.
Figure 4.
Labeled bone marrow and endothelial cells do not contribute to lineage-traced cardiomyocytes. A) Bone marrow donor and recipient mice used to generate chimeric Myh7-Cre R26tdTomato/+ mice with Abcg2MCM/+ R26GFP/+ bone marrow. B) Experimental timeline for bone marrow chimera experiments. C) Representative fluorescent image of GFP+ and Tom+ cardiomyocytes in bone marrow chimeric mice four weeks after the fifth tamoxifen injection. D) BAC-Cdh5-CreERT2 R26GFP/+ mice used to evaluate endothelial cell contribution to cardiomyocyte lineage-tracing. E) Experimental timeline for endothelial cell studies. F) Flow cytometry plot of GFP-expression in CD31+ non-cardiomyocytes at week 13 (number within gate is percent of CD31+ non-cardiomyocytes that express GFP for this representative sample, number above is mean ± SD, n=4). G) Fluorescent image of Troponin I staining and native GFP fluorescence at week 13 (n=5). Scale bars: 50 μm.
Figure 5.
Figure 5.
Myocardial ischemic (MI) injury increases lineage-traced cardiomyocytes. A) Experimental timeline used to evaluate lineage-tracing of cardiomyocytes following MI in Abcg2MCM/+ R26GFP/+ mice. Seventy-two hours after the final tamoxifen injections were given, MI or sham operations were performed. Cardiomyocyte labeling was assessed 72 hours and 4 weeks later. B) Brightfield images of Sirius Red Fast Green stained cardiac sections from sham and MI-operated Abcg2MCM/+ R26GFP/+ mice at week 13. C) Images of native GFP fluorescence of cardiac sections from sham and MI-operated Abcg2MCM/+ R26GFP/+ mice. D) Fluorescence images of Troponin I staining and native GFP fluorescence of cardiac sections from an MI-operated Abcg2MCM/+ R26GFP/+ mouse. E) Quantification of cardiomyocytes expressing GFP (white arrows) on cardiac sections from sham-operated (n=7) and MI-operated (n=8) Abcg2MCM/+ R26GFP/+ mice (mean ± SD). F) Immunofluorescence images of CD31 staining in Abcg2MCM/+ R26GFP/+ mice four weeks following MI. G) Immunofluorescence images of Vimentin staining. White arrows highlight cells that express both GFP and Vimentin. Scale bars: 2 mm (B and C) and 50 μm (D, F and G). Statistical significance was obtained by student’s t-test; * P < 0.05.
Figure 6.
Figure 6.
Cardiac SPCs fuse with preexisting cardiomyocytes to stimulate cardiomyocyte proliferation. A) Experimental design to assess cardiomyocyte cell cycle activation in lineage-traced cardiomyocytes. B) Fluorescent images of mononucleated and binucleated EdU+ GFP+ isolated adult cardiomyocytes from Abcg2MCM/+ R26GFP/+ mice. C) Quantification of the percent of GFP and GFP+ mononucleated, rod-shaped cardiomyocytes that are EdU+ at week 13 (mean ± SD, n=4). D) Quantification of the percent of GFP and GFP+ binucleated, rod-shaped cardiomyocytes that are EdU+ at week 13 (mean ± SD, n=4). E) Experimental design to assess cellular fusion in Abcg2MCM/+ R26mTom-mGFP/+ mice. F) Fluorescent image of mGFP+ mTom+ cardiomyocytes (yellow arrows) and mGFP+ cardiomyocytes (white arrows). G) Quantification of the percentage of mGFP+ cardiomyocytes that are mTom+ (yellow) or mTom (green) at week 9 (n=5) and week 13 (mean ± SD, n=4). H) Experimental design to assess the role of cellular fusion in proliferative lineage-traced cardiomyocytes. I) Fluorescent images of mononucleated and binucleated EdU+ nGFP+ isolated adult cardiomyocytes that are nTom+ (yellow arrow) or nTom (white arrow) from Abcg2MCM/+ R26nTom-nGFP/+ mice. Scale bars: 25 μm. Statistical significance was obtained by student’s t-test; * P < 0.05.

Similar articles

Cited by

References

    1. Chiong M, Wang ZV, Pedrozo Z, Cao DJ, Troncoso R, Ibacache M, Criollo A, Nemchenko A, Hill JA, and Lavandero S (2011) Cardiomyocyte death: mechanisms and translational implications. Cell Death Dis 2, e244. - PMC - PubMed
    1. van Empel VP, Bertrand AT, Hofstra L, Crijns HJ, Doevendans PA, and De Windt LJ (2005) Myocyte apoptosis in heart failure. Cardiovasc Res 67, 21–29 - PubMed
    1. Tzahor E, and Poss KD (2017) Cardiac regeneration strategies: Staying young at heart. Science 356, 1035–1039 - PMC - PubMed
    1. van Berlo JH, and Molkentin JD (2014) An emerging consensus on cardiac regeneration. Nat Med 20, 1386–1393 - PMC - PubMed
    1. Epstein JA (2019) A Time to Press Reset and Regenerate Cardiac Stem Cell Biology. JAMA Cardiol 4, 95–96 - PubMed

Publication types

Substances

LinkOut - more resources