Case Reports
. 2020 Apr;26(2):79-90.
doi: 10.1080/13554794.2020.1731553. Epub 2020 Feb 26.

BrainAGE and regional volumetric analysis of a Buddhist monk: a longitudinal MRI case study

Affiliations
Case Reports

BrainAGE and regional volumetric analysis of a Buddhist monk: a longitudinal MRI case study

Nagesh Adluru et al. Neurocase. 2020 Apr.

Abstract

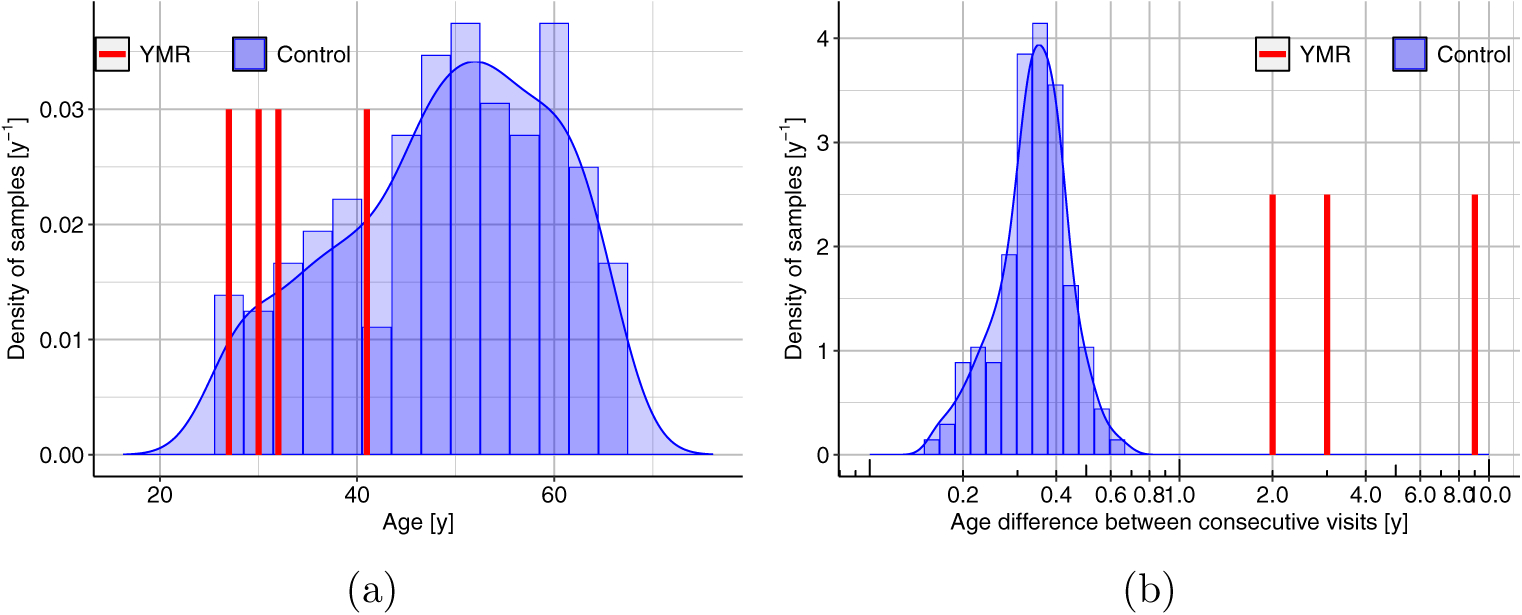
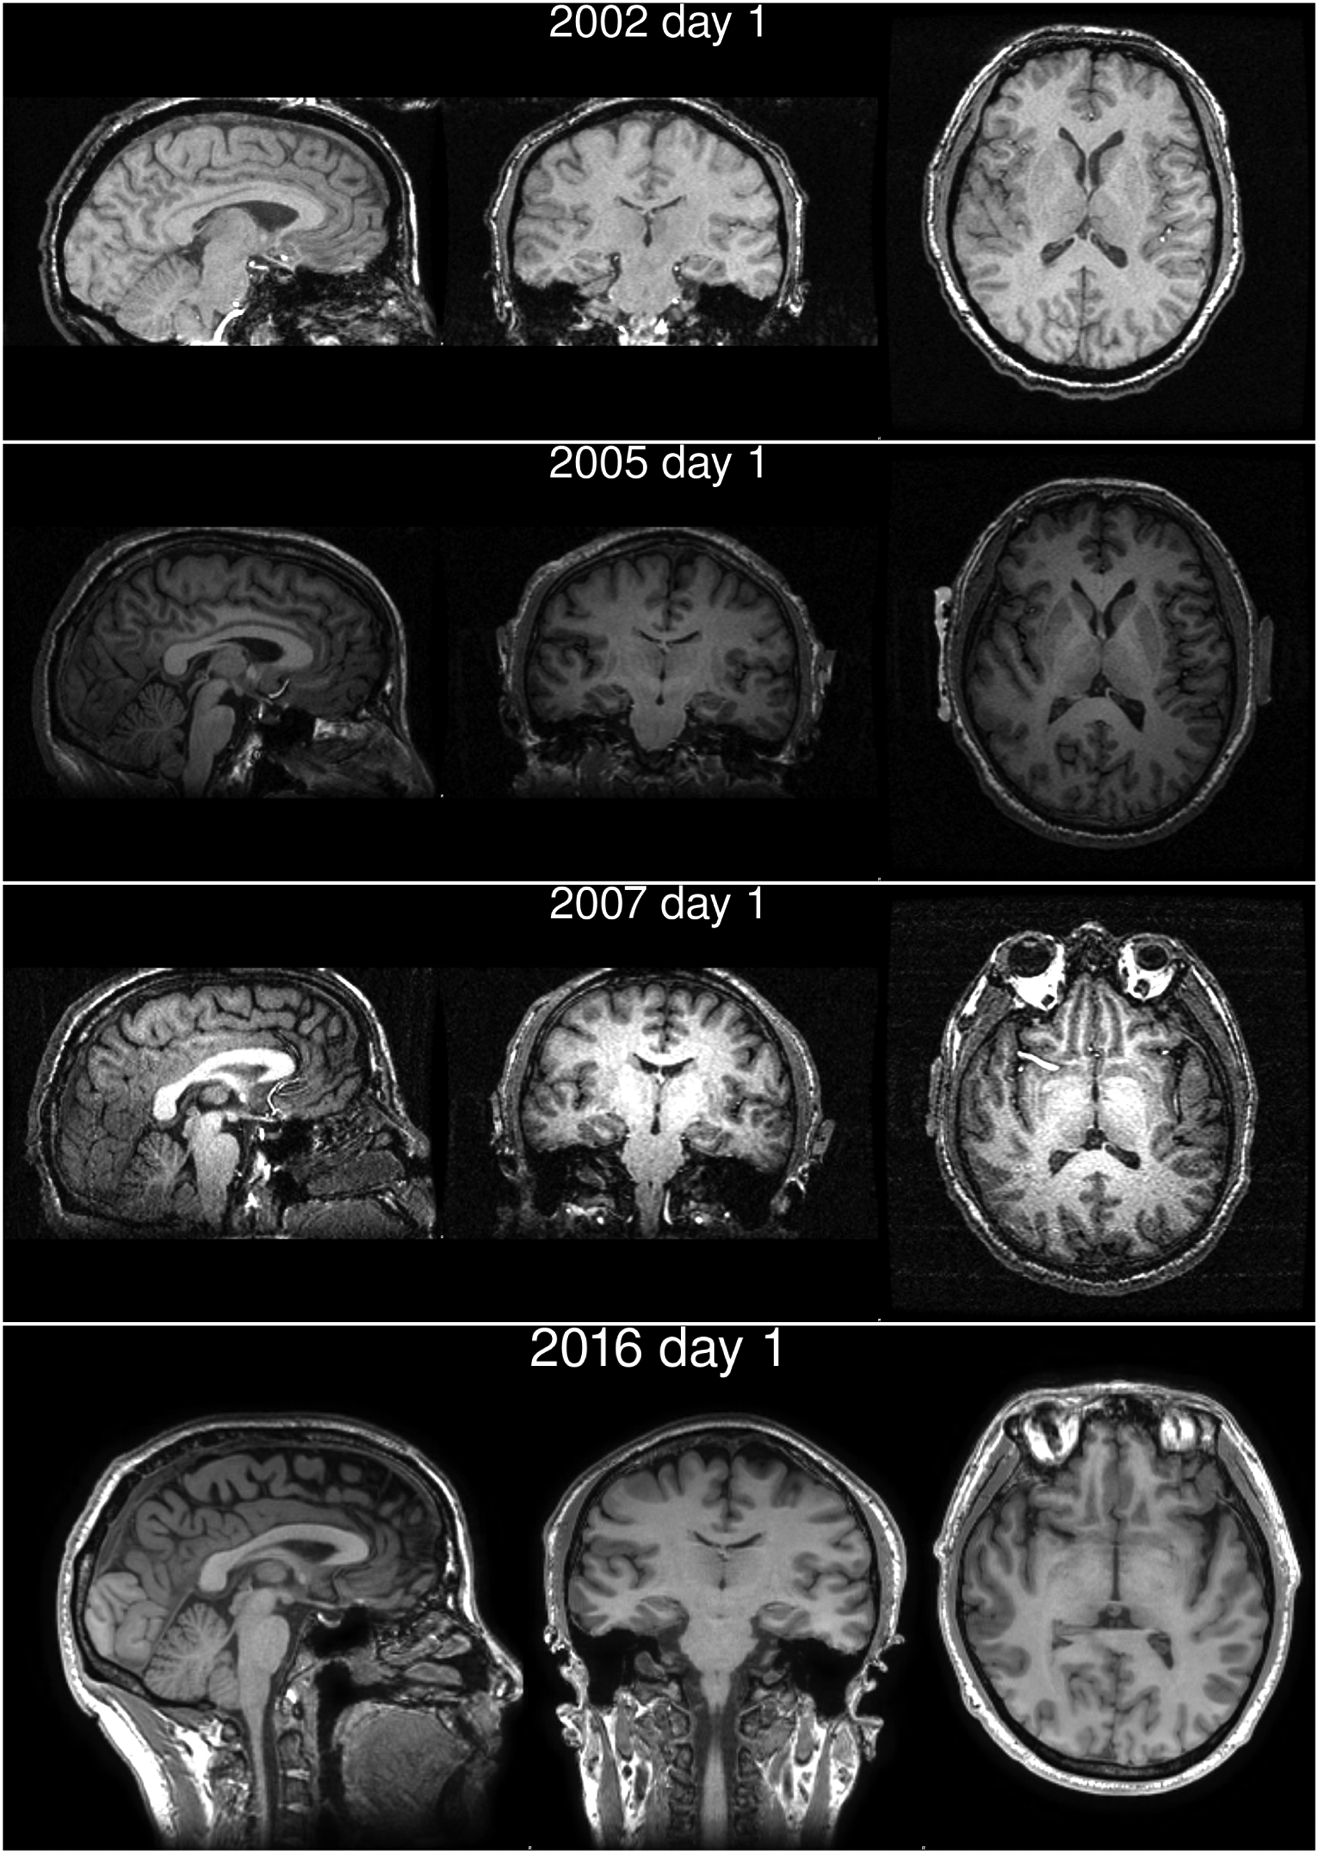
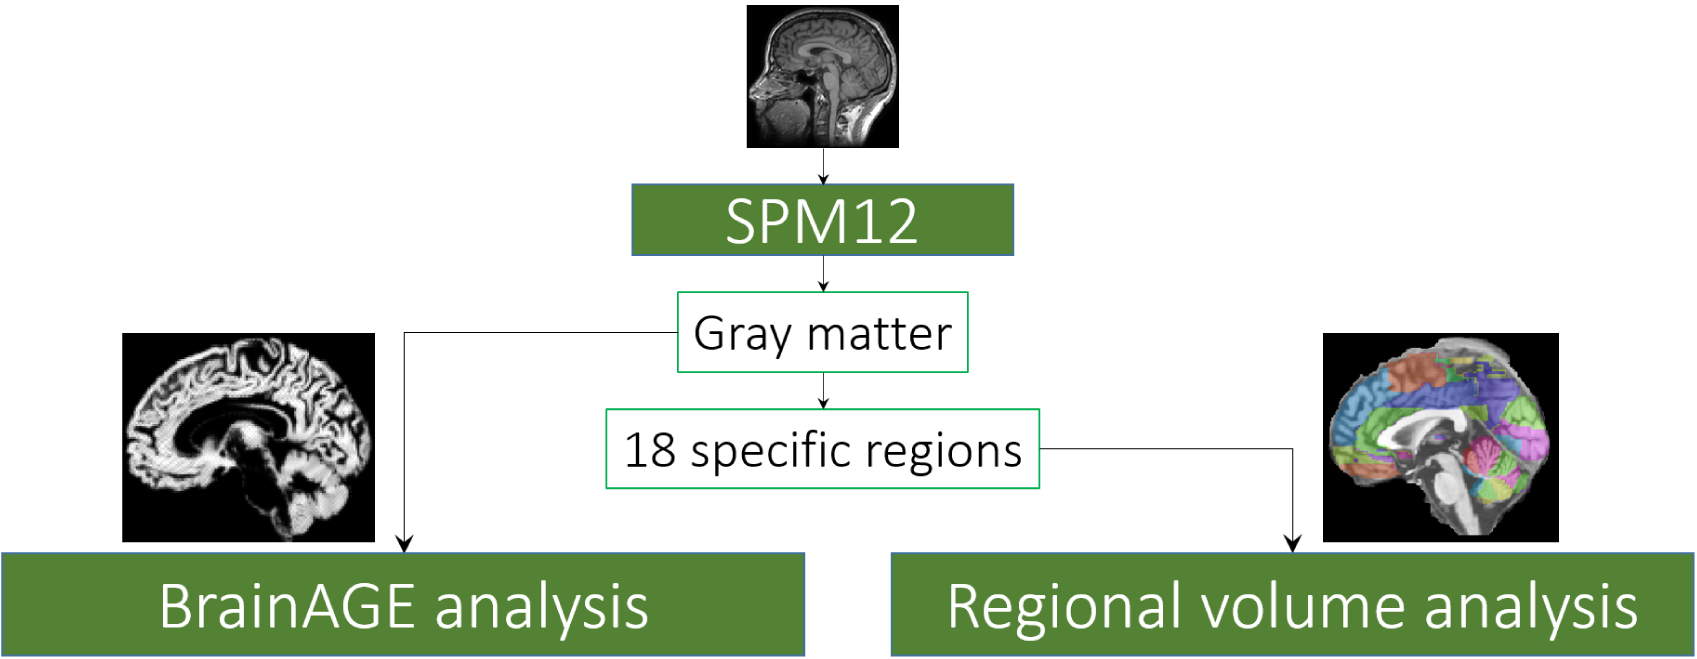
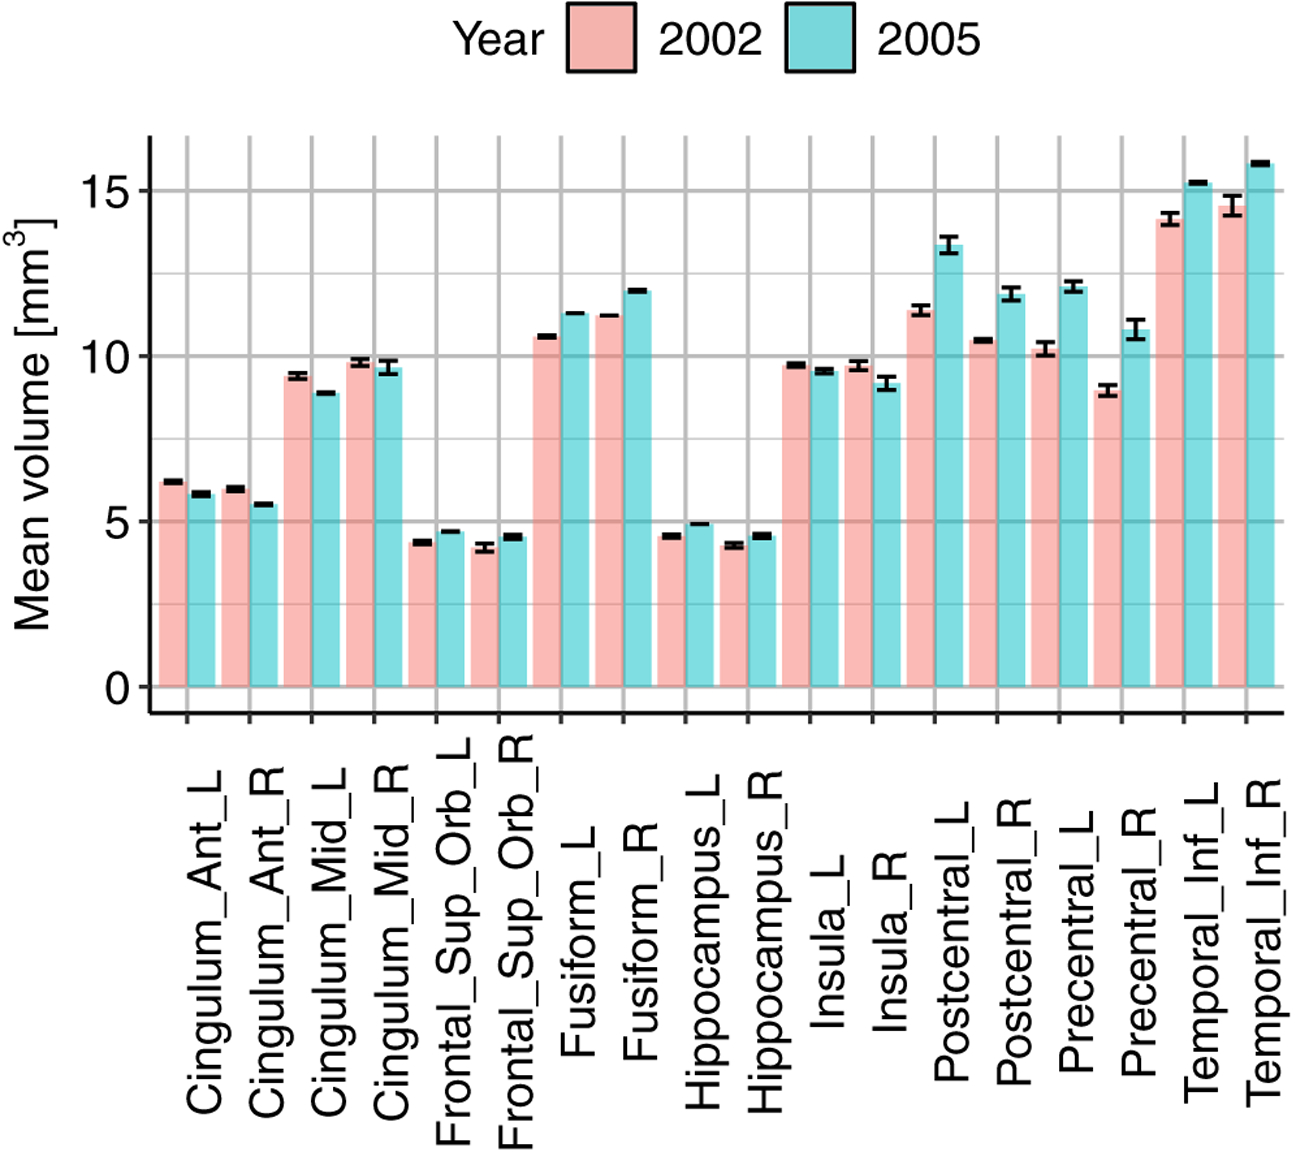
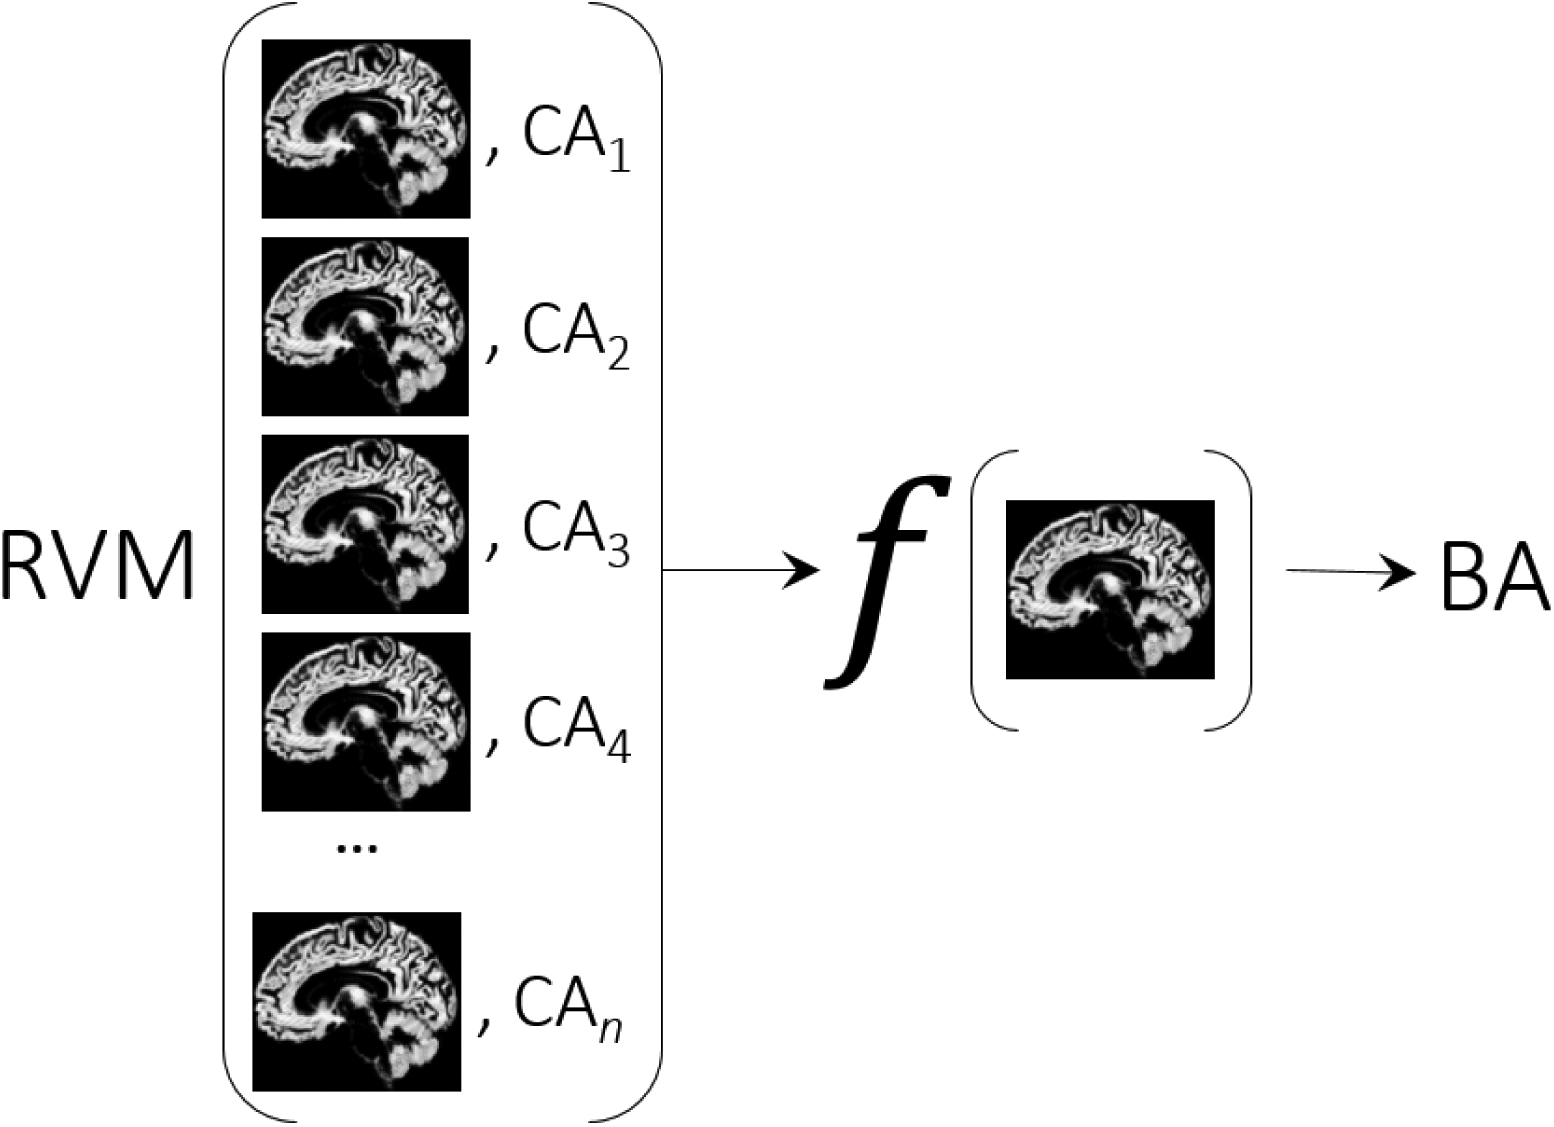
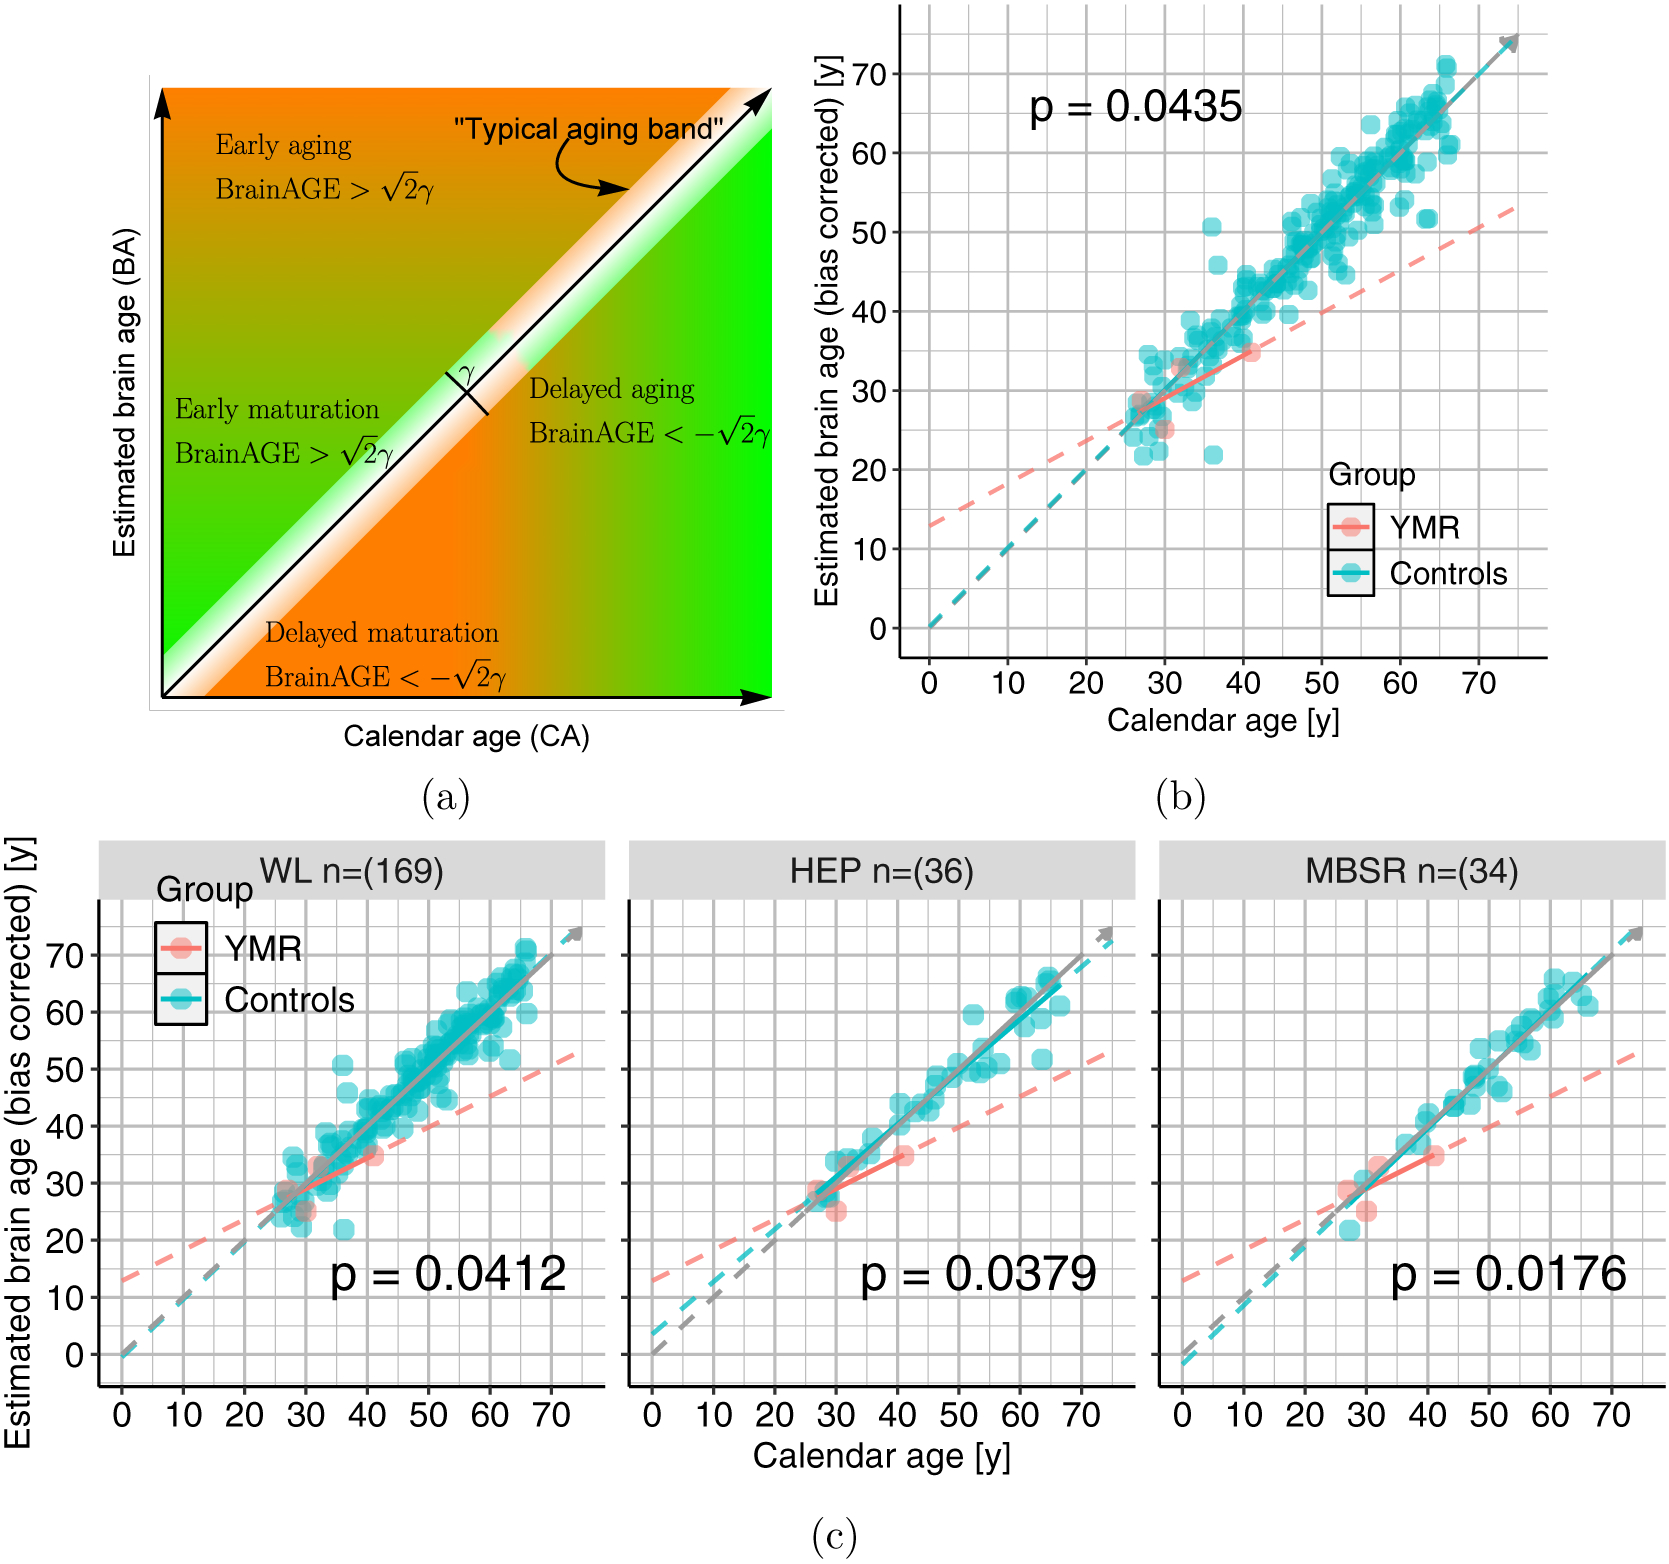
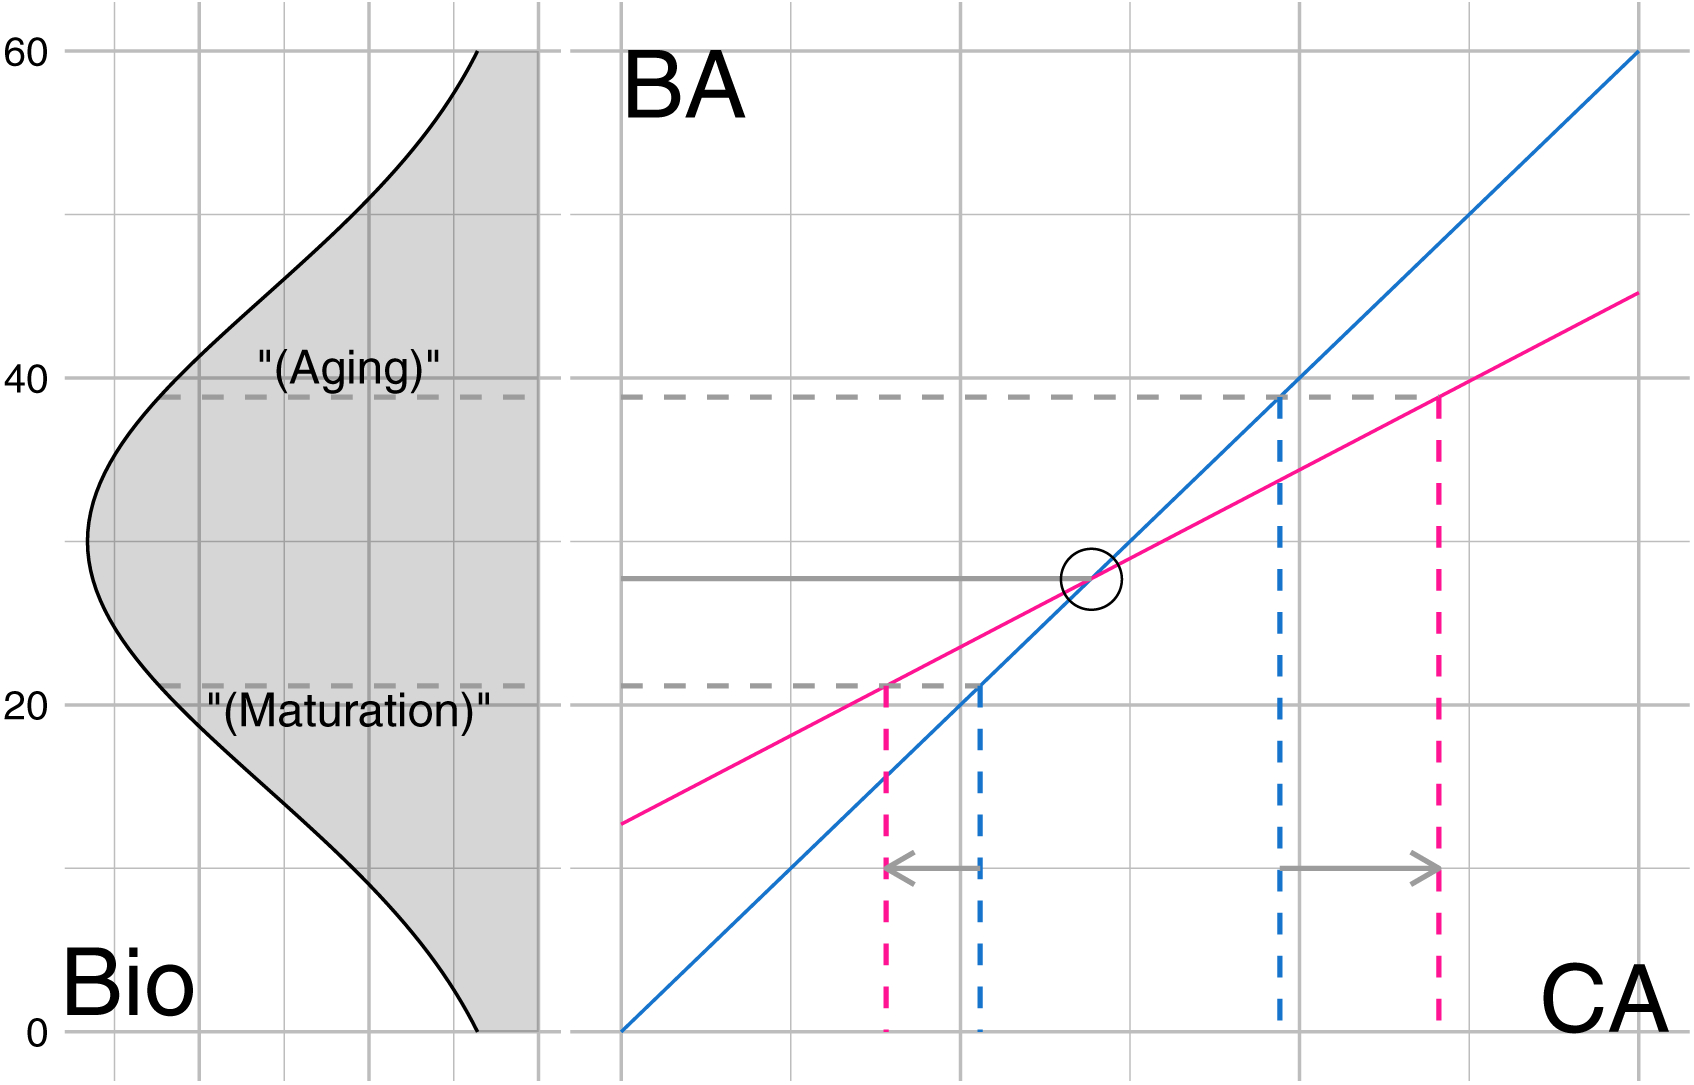
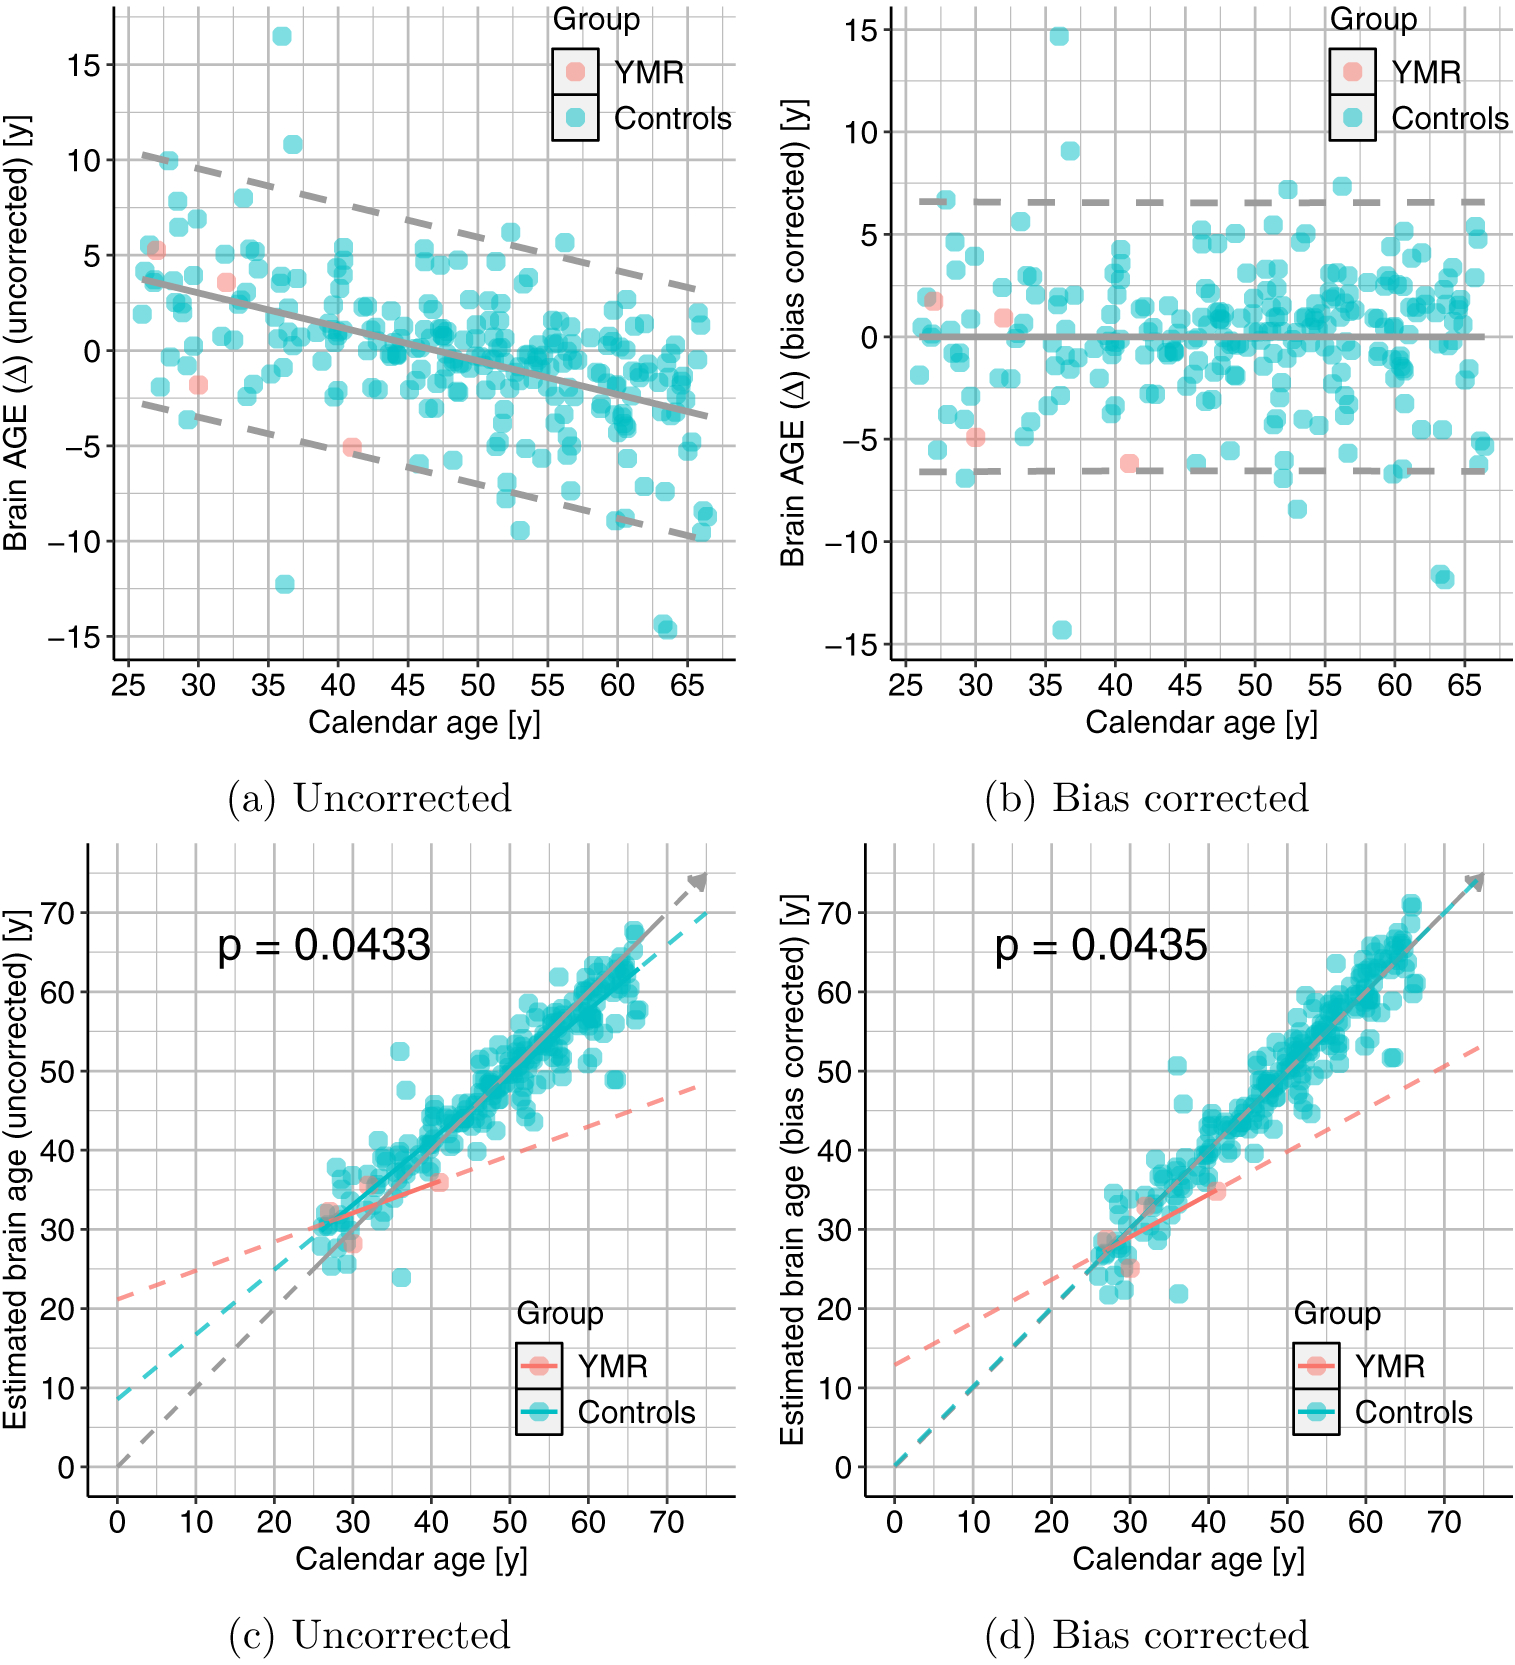
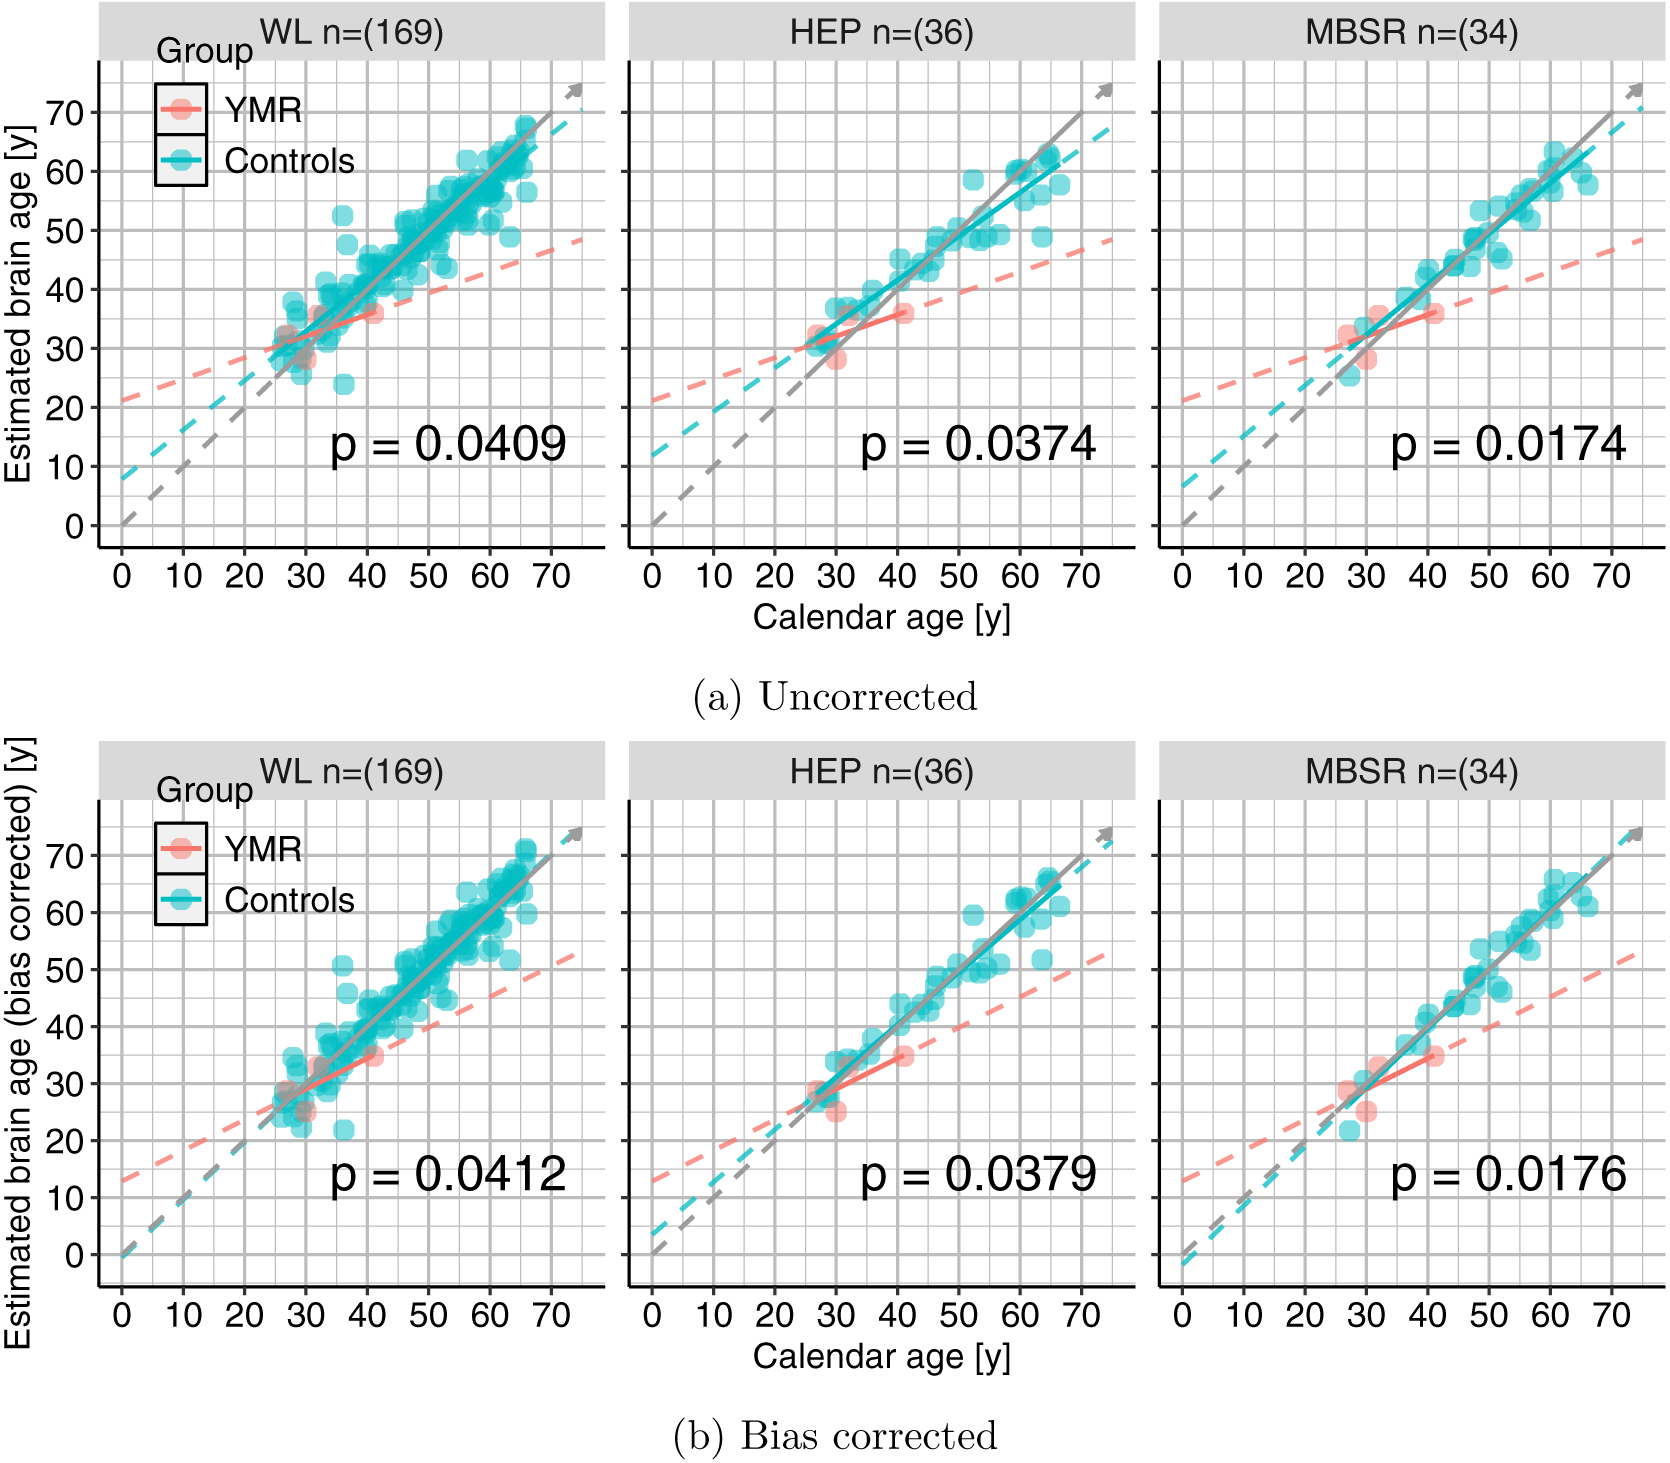
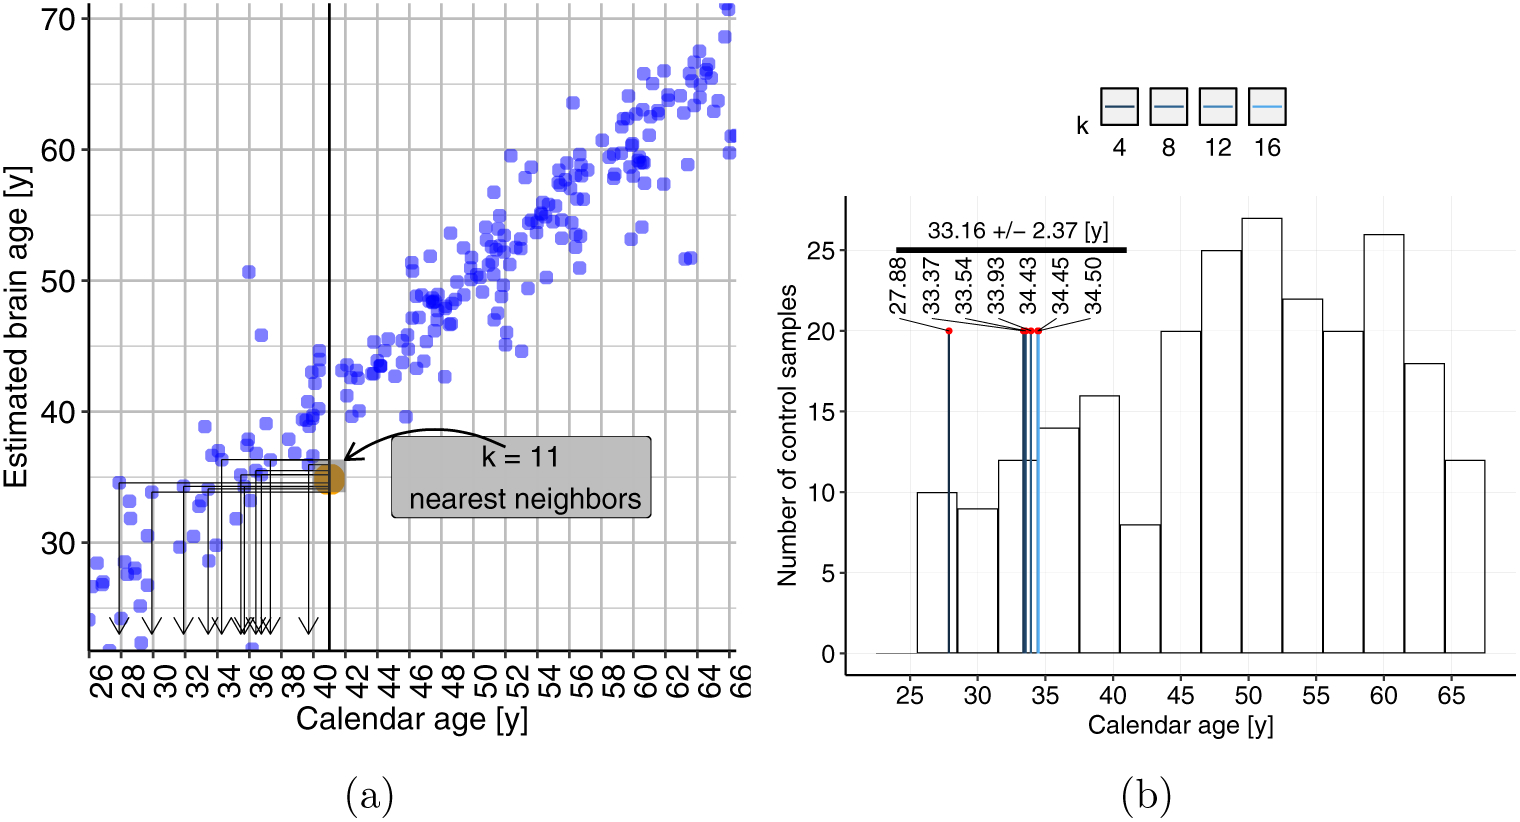
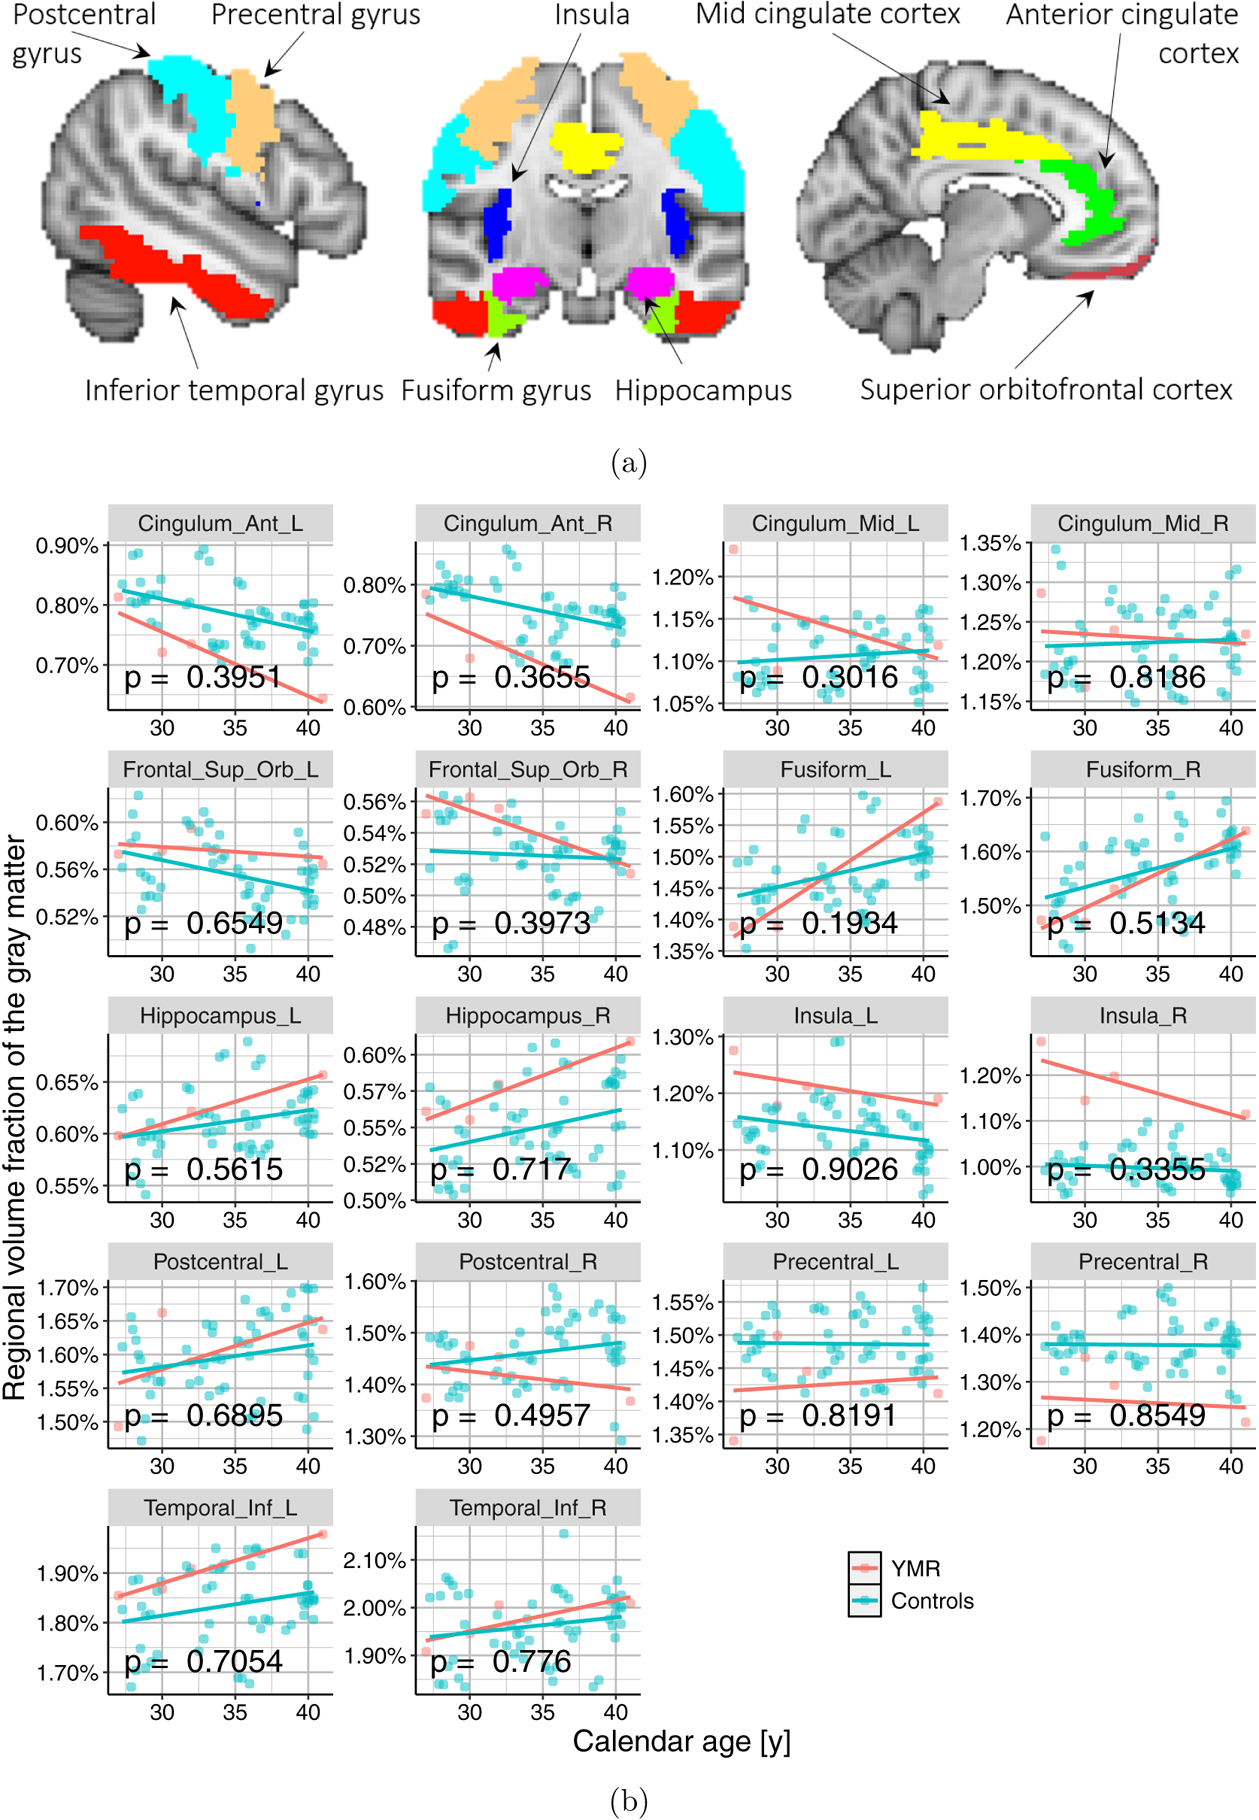
Yongey Mingyur Rinpoche (YMR) is a Tibetan Buddhist monk, and renowned meditation practitioner and teacher who has spent an extraordinary number of hours of his life meditating. The brain-aging profile of this expert meditator in comparison to a control population was examined using a machine learning framework, which estimates "brain-age" from brain imaging. YMR's brain-aging rate appeared slower than that of controls suggesting early maturation and delayed aging. At 41 years, his brain resembled that of a 33-year-old. Specific regional changes did not differentiate YMR from controls, suggesting that the brain-aging differences may arise from coordinated changes spread throughout the gray matter.

Keywords: Buddhist monk; MRI case study; long-term meditator; machine learning.


Figures

Figure 1.:
Figure 1.:. Calendar age distributions.
(a) Calendar ages. (b) Calendar age intervals between consecutive MRI visits. Since the longitudinal age differences for the controls were all less than one year, and those for YMR were all two or more years, the control data were treated cross-sectionally. With less than a year age difference for controls, the longitudinal change curves would not capture the rates of changes that would be needed to compare against data on YMR.
Figure 2.:
Figure 2.:. Representative slices of YMR’s brain from the different years he volunteered.
Image intensities are shown with the same window levels across the years. Changes in the bias levels of those intensities were accounted for by the processing pipeline (Fig. 3) and the BrainAGE estimation framework. (Franke et al., 2013, 2015, 2012, 2014, 2010; Luders et al., 2016).
Figure 3.:
Figure 3.:. Overview of the analysis.
T1-weighted MRI data were processed through SPM12 to produce gray matter volume maps. These maps were direct inputs for the BrainAGE analysis, and, separately, were segmented for regional volumetric analyses.
Figure 4.:
Figure 4.:. Quality control.
The noise variability of the regional volumes was computed for the data from the years 2002 and 2005, the earliest data available on YMR. The data were acquired on three and two consecutive days, respectively. Variability was low, providing support for the reliability of the data for downstream statistical analysis.
Figure 5.:
Figure 5.:. BrainAGE estimation framework.
The relevance vector machine (RVM) is used for estimating the age of a brain from MRI data.
Figure 6.:
Figure 6.:. BrainAGE results.
(a) Qualitative classification of the space spanned by estimated brain age and calendar age by BrainAGE (BA – CA). (b) Scatter plot showing the relationship between estimated brain age (BA) and the calendar age (CA) for YMR and the general population. The slope for the general population was β1 = .99, and the slope difference of YMR was β3 = −0.45, which was statistically significant at p = 0.0435. (c) Scatter plot showing the relationship between estimated brain age and calendar age contrasting YMR with the three control subgroups. The slope differences with respect to WL, HEP and MBSR are −0.47, −0.38, −0.5, respectively.
Figure 7.:
Figure 7.:
Conceptual graphic to demonstrate maturation and aging points. Left: growth and decay of some biological feature (Bio) (say gray matter volume) with the brain age (BA). Right: Depending on the relationship of the brain age with the calendar age, the maturation and aging points projected onto the calendar age (CA) can be shifted to the left (early maturation) or to the right (delayed aging).
Figure 8.:
Figure 8.:. Effects of bias correction.
Scatter plots showing relationship between the calendar age (CA) and (top-panel:) BrainAGE (age gap estimation Δ) and (bottom-panel:) estimated brain age (BA). We can clearly see that the inverse relationship between Δ and CA is no longer present after the correction and the models in the bottom panel tend toward the diagonal. The p-value for the group difference test is only modestly affected.
Figure 9.:
Figure 9.:. Effects of bias correction.
Plots similar to the bottom panel of Fig. 8 but for each of the three subgroups of controls. Top-panel shows those for uncorrected data and the bottom-panel shows the results with bias corrected data. We can again see that the linear models move towards the diagonal in all the three subgroups and p-values only modestly affected.
Figure 10.:
Figure 10.:. Brain resemblance results.
(a) Demonstration of the brain resemblance calculation, using k = 11, for YMR’s calendar age of 41 years. The blue scatter is from the control sample, and the orange dot shows YMR at 41. (b) The brain resemblance results, for seven different ks. The histogram of the calendar ages of the controls, on the back drop, shows the wide range of the age sample distribution, indicating that k-nearest neighbor search is not biased towards younger ages.
Figure 11.:
Figure 11.:. Regional volumetric analysis results.
(a) Nine bilateral regions previously implicated in meditation studies (Fox et al., 2014), were selected for the regional volumetric analysis in our case study. These regions were extracted bilaterally, on the left and right hemispheres of the brain, giving us a total of 18 regions per subject. (b) Scatter plots showing the relationship between calendar age and regional volume fraction, for all the 18 regions.

Similar articles

Cited by

References

    1. Alda M, Puebla-Guedea M, Rodero B, Demarzo M, Montero-Marin J, Roca M, & Garcia-Campayo J (2016). Zen meditation, length of telomeres, and the role of experiential avoidance and compassion. Mindfulness, 7(3), 651–659. - PMC - PubMed
    1. Ashburner J, & Friston KJ (2000). Voxel-based morphometrythe methods. Neuroimage, 11 (6), 805–821. - PubMed
    1. Beheshti I, Nugent S, Potvin O, & Duchesne S (2019). Bias-adjustment in neuroimaging-based brain age frameworks: A robust scheme. NeuroImage: Clinical, 24, 102063. - PMC - PubMed
    1. Casey BJ, Getz S, & Galvan A (2008). The adolescent brain. Developmental review, 28(1), 62–77. - PMC - PubMed
    1. Chaix R, Alvarez-López MJ, Fagny M, Lemee L, Regnault B, Davidson RJ, … Kaliman P (2017). Epigenetic clock analysis in long-term meditators. Psychoneuroendocrinology, 85, 210–214. - PMC - PubMed

Publication types