

C-reactive protein and albumin kinetics before community-acquired bloodstream infections - a Danish population-based cohort study
- PMID: 32100658
- PMCID: PMC7058655
- DOI: 10.1017/S0950268820000291
C-reactive protein and albumin kinetics before community-acquired bloodstream infections - a Danish population-based cohort study
Abstract
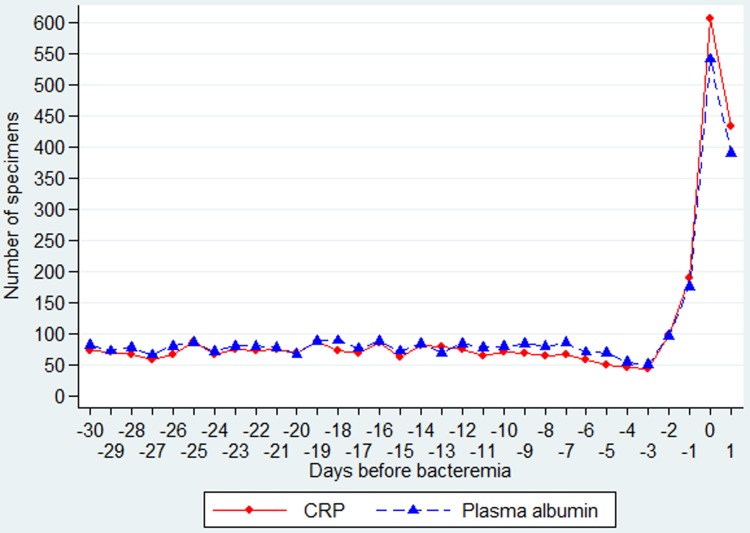
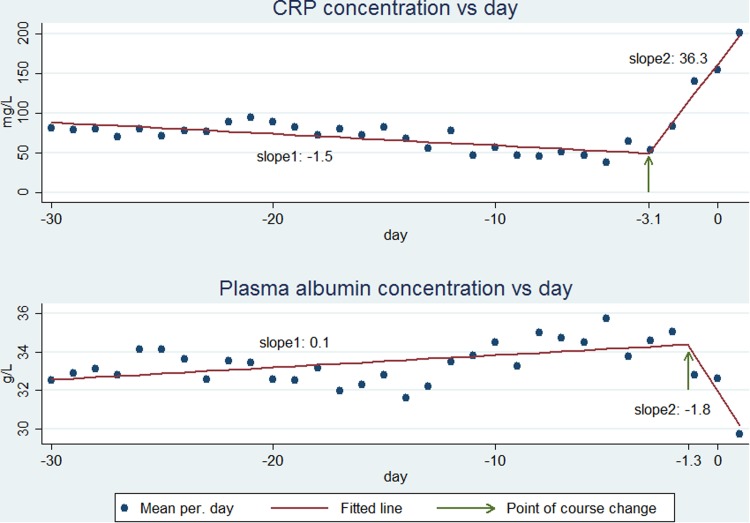
Early changes in biomarker levels probably occur before bloodstream infection (BSI) is diagnosed. However, this issue has not been fully addressed. We aimed at evaluating the kinetics of C-reactive protein (CRP) and plasma albumin (PA) in the 30 days before community-acquired (CA) BSI diagnosis. From a population-based BSI database we identified 658 patients with at least one measurement of CRP or PA from day -30 (D-30) through day -1 (D-1) before the day of CA-BSI (D0) and a measurement of the same biomarker at D0 or D1. Amongst these, 502 had both CRP and PA measurements which fitted these criteria. CRP and PA concentrations began to change inversely some days before CA-BSI diagnosis, CRP increasing by day -3.1 and PA decreasing by day -1.3. From D-30 to D-4, CRP kinetics (expressed as slopes - rate of concentration change per day) was -1.5 mg/l/day. From D-3 to D1, the CRP slope increased to 36.3 mg/l/day. For albumin, the slope between D-30 to D-2 was 0.1 g/l/day and changed to -1.8 g/l/day between D-1 and D1. We showed that biomarker levels begin to change some days before the CA-BSI diagnosis, CRP 3.1 days and PA 1.3 days before.
Keywords: Albumin; C-reactive protein; community acquired bloodstream infections.
Conflict of interest statement
None.
Figures
References
MeSH terms
Substances
LinkOut - more resources
Full Text Sources
Research Materials
Miscellaneous
