. 2020 Feb 26:9:e50580.
doi: 10.7554/eLife.50580.

Ciliary Rab28 and the BBSome negatively regulate extracellular vesicle shedding

Affiliations

Ciliary Rab28 and the BBSome negatively regulate extracellular vesicle shedding

Jyothi S Akella et al. Elife. .

Abstract

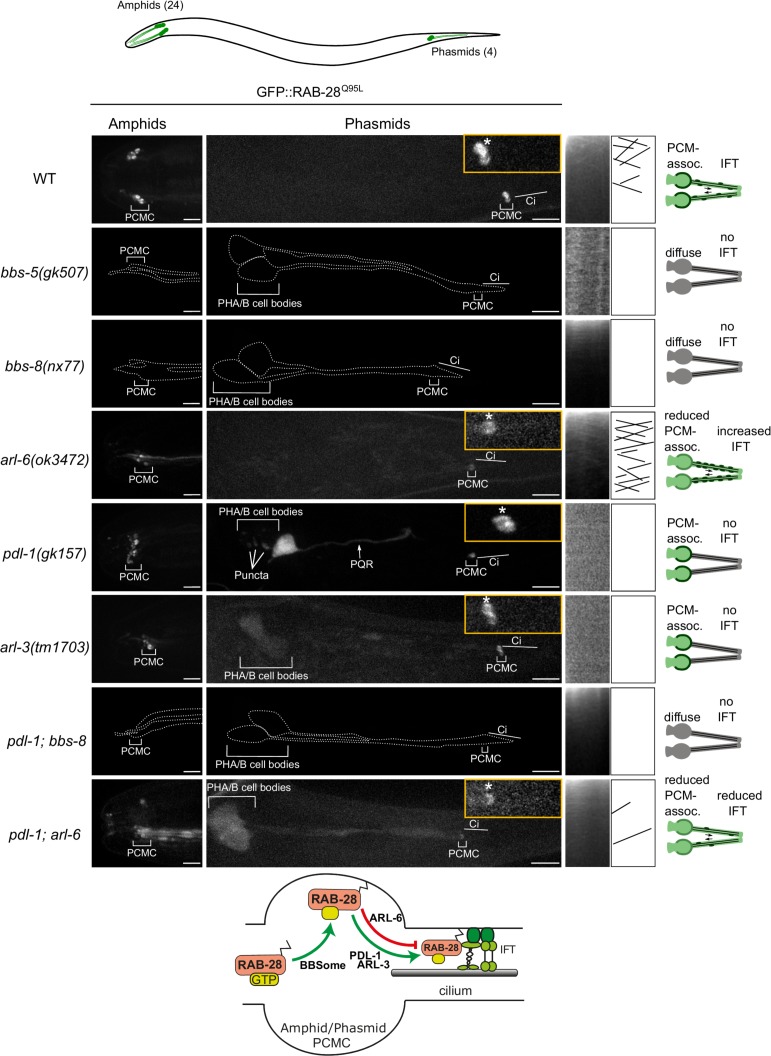
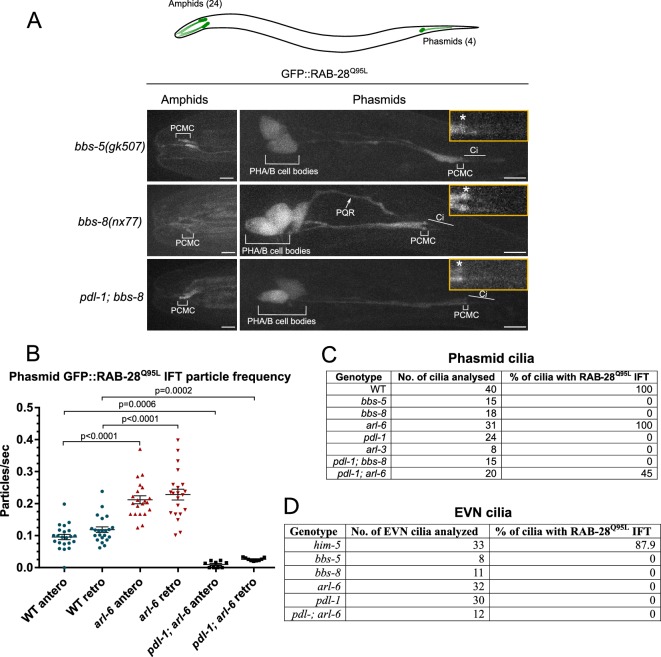
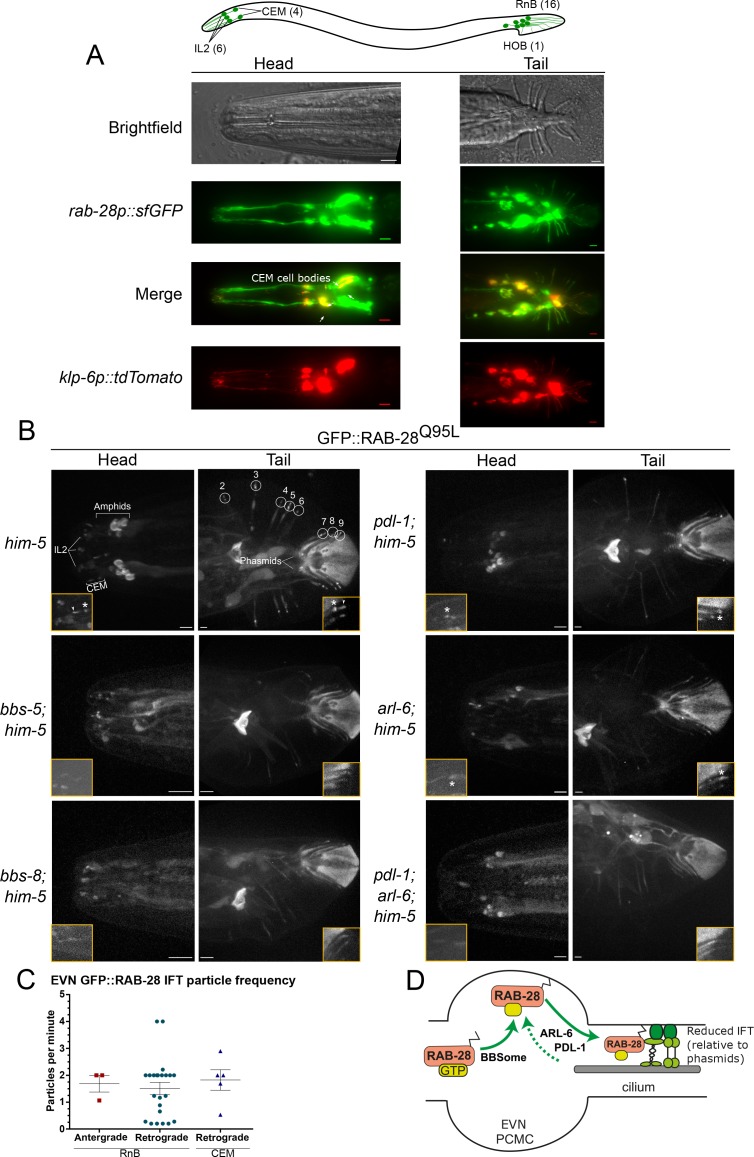
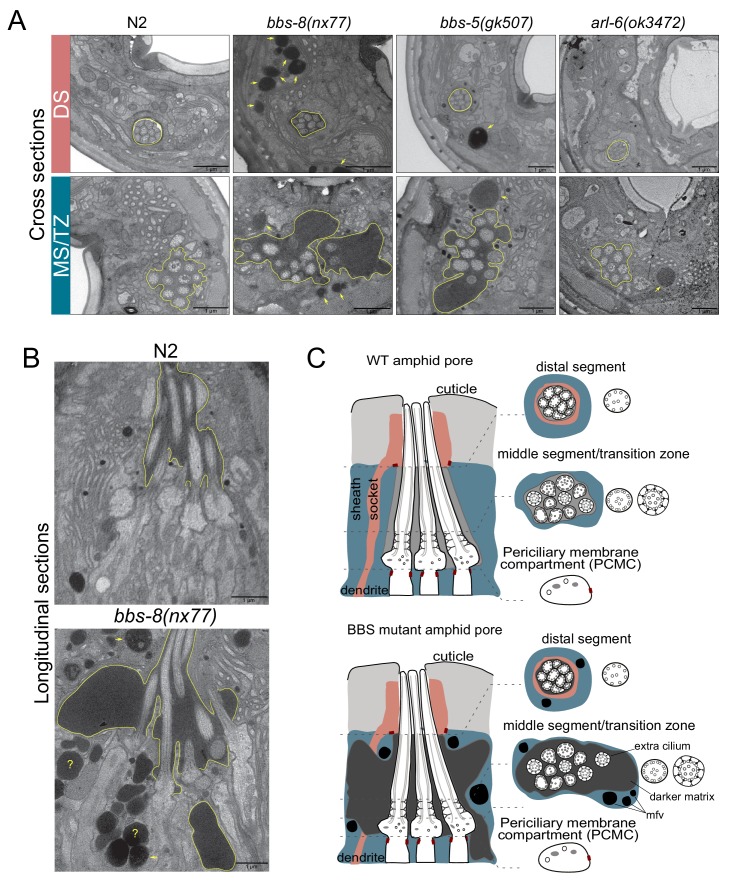
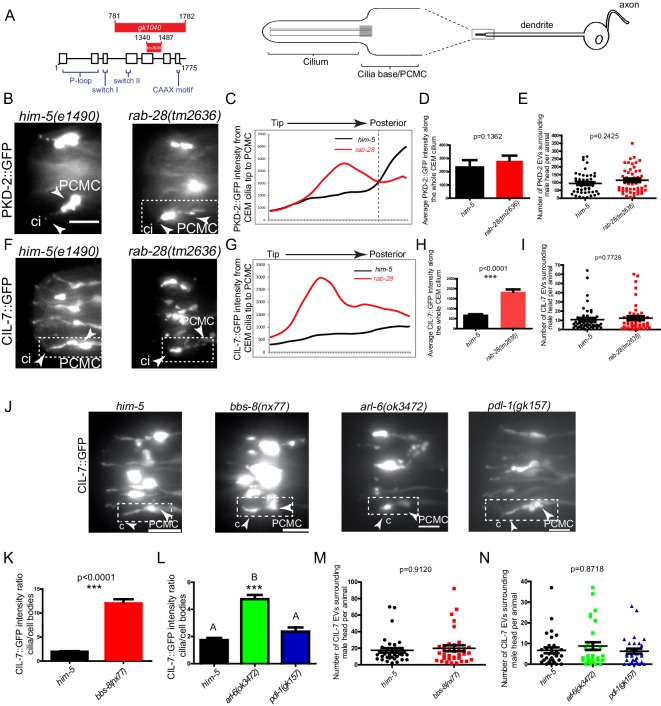
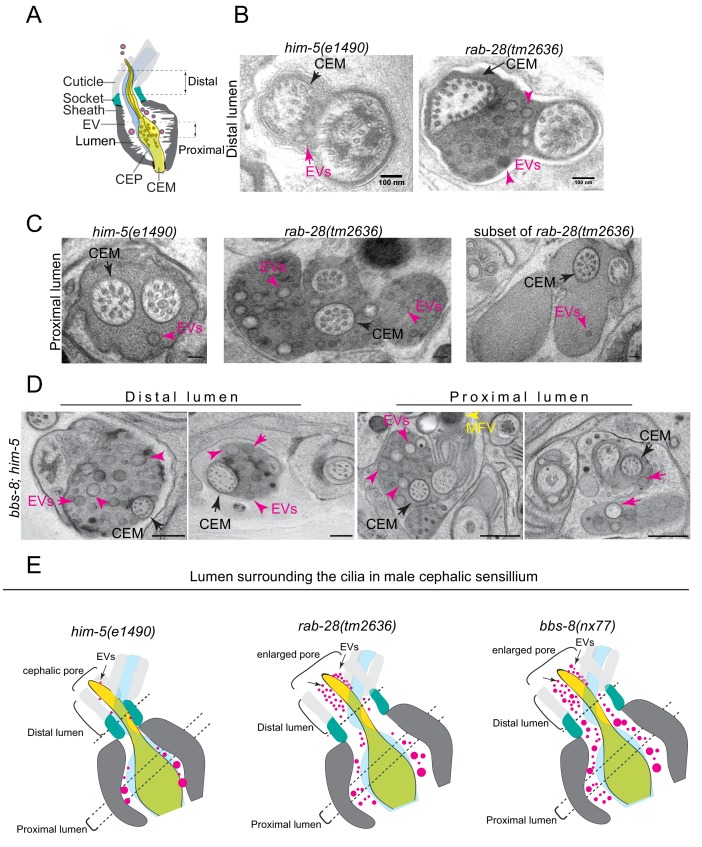
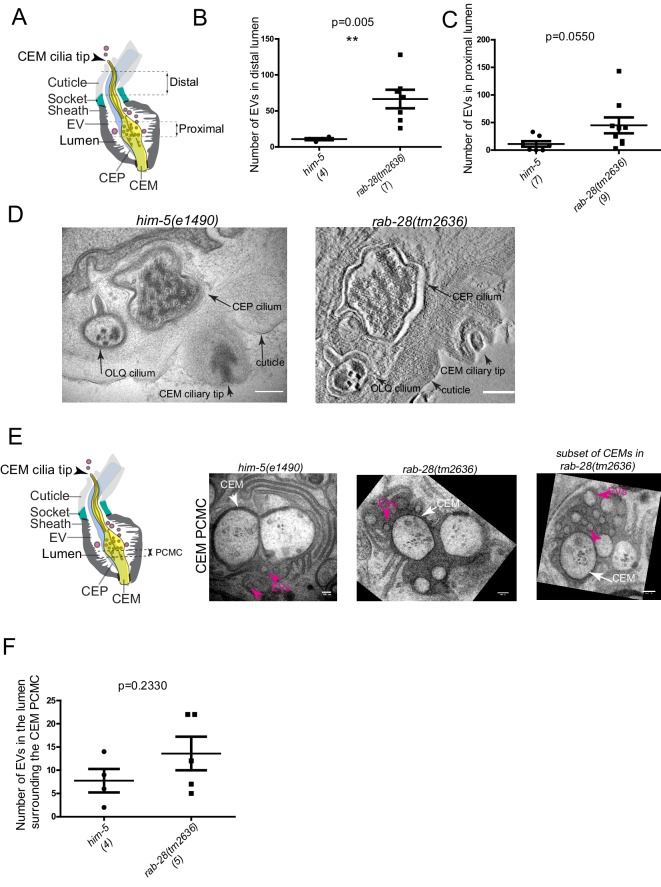
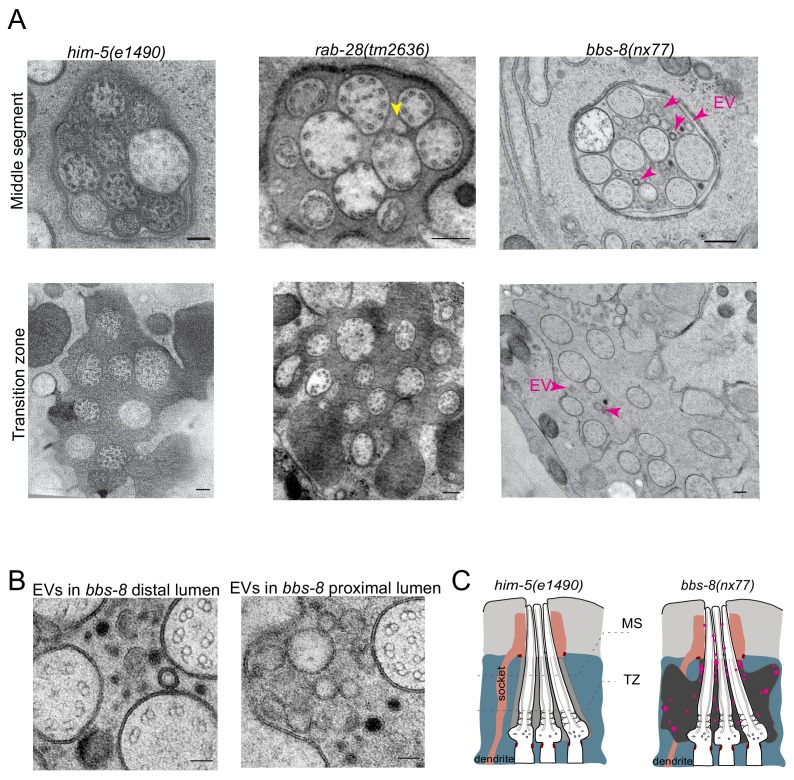
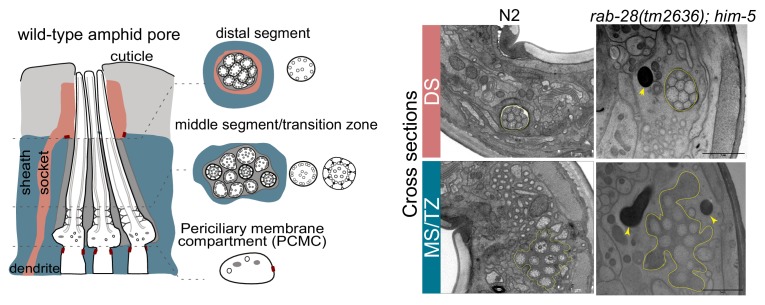
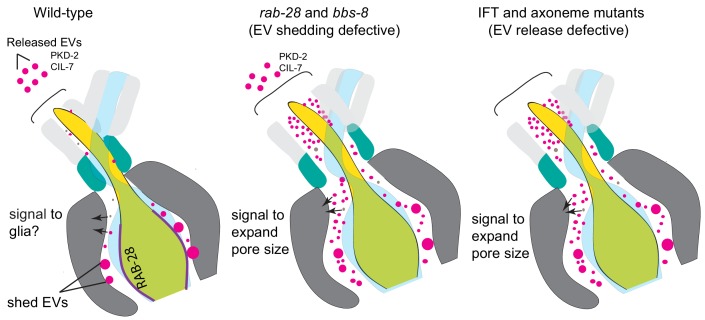
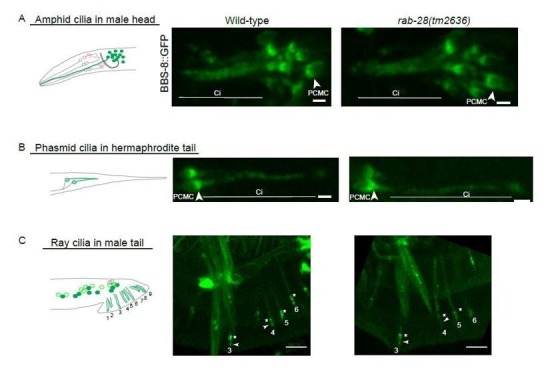
Cilia both receive and send information, the latter in the form of extracellular vesicles (EVs). EVs are nano-communication devices that influence cell, tissue, and organism behavior. Mechanisms driving ciliary EV biogenesis are almost entirely unknown. Here, we show that the ciliary G-protein Rab28, associated with human autosomal recessive cone-rod dystrophy, negatively regulates EV levels in the sensory organs of Caenorhabditis elegans in a cilia specific manner. Sequential targeting of lipidated Rab28 to periciliary and ciliary membranes is highly dependent on the BBSome and the prenyl-binding protein phosphodiesterase 6 subunit delta (PDE6D), respectively, and BBSome loss causes excessive and ectopic EV production. We also find that EV defective mutants display abnormalities in sensory compartment morphogenesis. Together, these findings reveal that Rab28 and the BBSome are key in vivo regulators of EV production at the periciliary membrane and suggest that EVs may mediate signaling between cilia and glia to shape sensory organ compartments. Our data also suggest that defects in the biogenesis of cilia-related EVs may contribute to human ciliopathies.

Keywords: BBSome; C. elegans; PKD2; Rab28; cell biology; cilia; ciliopathy; extracellular vesicles.


Conflict of interest statement

JA, SC, KN, ST, AM, MS, FR, BK, DH, MB, OB No competing interests declared

Figures

Figure 1.
Figure 1.. A BBSome-ARL-6-PDL-1 network targets RAB-28 to sensory cilia.
Representative confocal z-projection images of amphid (head) and phasmid (tail) neurons from hermaphrodites of the indicated genotype expressing GFP::RAB-28Q95L. Anterior is to the left; all images taken at identical exposure settings. Traced outlines in bbs-5, bbs-8 and pdl-1;bbs-8 panels are derived from intensity-adjusted images (see Figure 1—figure supplement 1A). Insets; higher magnification images of phasmid cilia, with PCMC denoted by asterisks. Kymograph x-axis represents distance and y-axis time (scale bars; 5 s and 1 μm), and both retrograde and anterograde particle lines are shown in the kymograph schematics. Schematics on the right summarize the phenotypes observed in a pair of phasmid cilia. Bottom schematic shows proposed model for RAB-28 transport to amphid and phasmid channel neuronal cilia. ci: cilium; PQR: additional ciliated neuron in the tail that occasionally expresses the RAB-28 reporter.
Figure 1—figure supplement 1.
Figure 1—figure supplement 1.. GFP::RAB-28 localization and IFT frequency analysis.
(A) Representative confocal z-projection images of amphid and phasmid neurons from worms of the indicated genotypes expressing GFP::RAB-28Q95L. Images are the same as those in Figure 1 except image intensity has been increased to visualize the mislocalized GFP signals. Insets show magnifications of phasmid cilia; asterisks indicate PCMC. Anterior is to the left. Scale bars; 10 μm. (B) Scatter plots showing the frequency of anterograde and retrograde GFP::RAB-28 IFT particles, in particles per second, as derived from kymographs taken from phasmid cilia of the indicated genotype expressing GFP::RAB-28Q95L. The frequency with which GFP-RAB28Q95L undergoes IFT is effectively doubled in the arl-6 background, but reduced to 7.8% (anterograde) and 16.4% (retrograde) of WT in the pdl-1; arl-6 background. Error bars show SEM; p-values calculated by one-way ANOVA with Tukey's multiple comparison test. Graphed data are from 22 WT, 21 arl-6 and 9 pdl-1;arl-6 kymographs. (C) Table summarizing the percentage of phasmid cilia with detectable IFT movement of GFP::RAB-28Q95L in the indicated mutants. (D) Table summarizing the percentage of CEM and RnB cilia with detectable IFT movement of GFP::RAB-28Q95L in the indicated mutants.
Figure 2.
Figure 2.. RAB-28 is expressed in and trafficked to EVN cilia via a modified BBSome-ARL-6-PDL-1 pathway.
(A) Epifluorescence z-projections of the heads and tails of C. elegans males expressing rab-28p::sfGFP and klp-6p::tdTomato (EVN cilia-specific reporter). Arrows denote the CEM neurons. Brightfield images of male head and tail are also shown for clarity. Anterior is to the left. Scale bars; 5 μm. (B) Representative images of the male head and tail regions of the indicated genotypes expressing GFP::RAB-28Q95L in EVNs. Insets show higher magnification images of CEM (head) and RnB (numbered 1–9 in the tail) cilia. Asterisks indicate PCMC; white arrowheads indicate accumulated GFP::RAB-28Q95L in the distal region of CEM and RnB cilia. Anterior is to the left. Scale bars; 5 μm. (C) Scatter plots of GFP::RAB-28 IFT particle frequency in CEM and RnB male cilia. Error bars show SEM. Data are from 26 worms. (D) Schematic of proposed model for RAB-28 transport to EVN cilia. Scale bars; 10 μm. PCMC: periciliary membrane compartment.
Figure 3.
Figure 3.. BBSome and arl-6 mutant hermaphrodites display defects in amphid sensory organ structure and/or associated glia.
(A) Transmission electron microscopy (TEM) images showing the amphid channels of the indicated genotype in cross section, at the positions of ciliary distal segments (DS) and middle segments (MS)/transition zones (TZ). Arrows point to matrix-filled vesicles (mfv) within the cytoplasm of the sheath glial cell that surrounds the amphid cilia. The extracellular matrix-filled amphid compartment volume is also highlighted. Scale bars; 1 μm (all panels). n = 4 hermaphrodites for WT, n = 1 hermaphrodite for arl-6, bbs-5 and bbs-8 (two amphid organs imaged per hermaphrodite). (B) TEM images of longitudinal sections through the amphid cilia of WT and bbs-8 mutant worms, highlighting the expanded compartment volume and accumulated mfv in the sheath cell (arrows). N = 2 hermaphrodites imaged per genotype, with two amphid organs imaged per hermaphrodite. Question marks denote densities for which identification as either an mfv or an expanded pore region is ambiguous. Scale bars; 1 μm. (C) Cartoon representations of amphid organ ultrastructure in WT and BBSome mutant hermaphrodites, in longitudinal and cross section. Only three cilia are shown in the longitudinal schematics for simplicity.
Figure 4.
Figure 4.. RAB-28 and BBSome components regulate the localization of ciliary EV cargoes in EV-releasing CEM cilia.
(A) Left- schematic showing the location of the deleted regions in the gk1040 and tm2636 mutant alleles of rab-28. Right- cartoon modified from Bae et al. (2006) depicting the morphology of the CEM neurons of C. elegans. PCMC; periciliary membrane compartment. (B, F) Fluorescence micrographs of CEM cilia of control and rab-28(tm2636) males expressing PKD-2::GFP or CIL-7::GFP. Dotted white boxes mark one CEM cilium (ci), including the PCMC (periciliary membrane compartment) at the base. Scale bars; 5 μm. (C, G) Plot profiles of PKD-2::GFP and CIL-7::GFP intensity across different points along the cilium in control and rab-28(tm2636) adult males. Traces run from the ciliary tip and posterior towards the PCMC. Each data point represents the average GFP intensity at an individual point on several cilia in many animals of each genotype. rab-28(tm2636) males (n = 57 cilia from 36 males) accumulate more PKD-2 anterior to the site where PKD-2 accumulation is greatest in control males (n = 46 cilia from 32 males). rab-28(tm2636) males (n = 32 cilia from 18 males) accumulate more CIL-7 along the length of the cilium compared to controls (n = 48 cilia from 34 males). (D, H) Bar charts depicting mean PKD-2::GFP and CIL-7::GFP intensity along the cilium length of control and rab-28(tm2636) adult males. Error bars depict SEM. p values calculated by a Mann-Whitney test. For control, n = 40 (D) and 47 (H); for the rab-28 mutant, n = 50 (D) and n = 32 (H) cilia. Data is from three separate experiments. (E, I) Scatter plots depicting the number of PKD-2::GFP- and CIL-7::GFP-positive EVs surrounding the male head per animal between control and rab-28(tm2636). Horizontal line depicts the mean. Error bars depict SEM. p values calculated by a Mann-Whitney test. For control, n = 47 (E) and n = 46 (I) males; for the rab-28 mutant, n = 48 (E) and n = 47 (I) males. (J) Fluorescence images of CIL-7::GFP in the male heads of the indicated genotypes. Scale bars; 5 μm. (K, L) Bar charts depicting the ratio of CIL-7::GFP intensity between the ciliary and cell body regions in the indicated genotypes. Error bars show SEM. p values in K determined by Mann-Whitney test. n = 21 males for both genotypes in K and n = 27 males for all genotypes in L. Letters above each dataset in L indicate results of statistical analysis; data sets that do not share a common letter are significantly different at p<0.0005 (Kruskal–Wallis test with Dunn’s post-hoc correction). (M, N) Scatter plots depicting the number of CIL-7::GFP-labeled EVs released from the indicated genotypes. Error bars depict SEM. p values determined by a Mann-Whitney test (M) or Kruskal-Wallis test with Dunn’s multiple comparisons (N). n = 34 (M) and n = 31 (N) males.
Figure 4—figure supplement 1.
Figure 4—figure supplement 1.. tm2636 allele of rab-28.
Top schematic shows the location of the deleted region in the tm2636 mutant allele and the location of the primer pairs used to amplify full length cDNA sequence that was sequenced using the sequencing primer (seqF). Sequences show a portion of the sequenced cDNA product amplified from control and rab-28(tm2636) mRNA. Nucleotides marked in red in control indicate the region deleted in tm2636, flanked by nucleotides in bold. tm2636 lacks the deleted sequence but makes a cDNA indicating the deletion mutation is not a null. Boxed region contains an alignment of the putative translation of sequenced cDNA products from control and rab-28(tm2636). The rab-28(tm2636) protein product is expected to lack 11 amino acids that includes a lysine in the G5 box important for nucleotide binding.
Figure 4—figure supplement 2.
Figure 4—figure supplement 2.. rab-28(gk1040) phenocopies the CIL-7 mislocalization phenotype of rab-28(tm2636) worms.
(A) Fluorescence micrographs of control and rab-28(gk1040) adult males expressing CIL-7::GFP. Close-ups of the male heads are shown on the left. Dotted white boxes mark one cilium. White arrowheads in insets mark PCMC and cilium (ci). In rab-28(gk1040), more CIL-7 is seen along the cilium. Scale bar; 10 μm. (B) Bar chart depicting the ratio of CIL-7::GFP intensity between the cilia and cell bodies in control and rab-28(gk1040). Similar to rab-28(tm2636), rab-28(gk1040) males also accumulate CIL-7::GFP along the cilium. Error bars depict SEM. p value determined by Mann-Whitney test. N = 27 animals for both genotypes. (C) Scatter plots depicting the number of CIL-7::GFP EVs surrounding the male head per animal between control and rab-28(gk1040). Error bars depict SEM. p value determined by Mann-Whitney test. N = 31 animals for both genotypes.
Figure 5.
Figure 5.. RAB-28 and BBS-8 are negative regulators of EV shedding.
(A) Cartoon of the ultrastructure of the cephalic sensory organ reproduced from Wang et al. (2014a). EVs (magenta spheres) are ‘shed’ from the PCMC/ciliary base into the lumen and ‘released’ into the environment outside of the worm. (B) Transmission electron micrographs of the cephalic lumen surrounding the distal region of CEM cilia. Black arrows point to the CEM and magenta arrows to EVs. rab-28(tm2636) accumulate significantly more EVs in the lumen distal to the singlet region of CEM compared to control males. Scale bars; 100 nm (C) Transmission electron micrographs of the cephalic organ at the level of the CEM cilium transition zone. Scale bars; 100 nm. A subset of the rab-28(tm2636) animals accumulate EVs in the cephalic lumen surrounding the TZ. (D) TEM cross sections of the proximal and distal regions for the cephalic lumen of bbs-8 mutant males. Black arrows point to the CEM cilium. Ectopic EVs (magenta arrows) are observed at distal and proximal regions of the lumen. Matrix filled vesicles (MFVs) in cephalic sheath are marked by yellow arrowheads. Scale bar; 200 nm. (E) Cartoon depictions of the lumen surrounding the cilia in the male cephalic sensillum in control, rab-28(tm2636), and bbs-8 mutants. Color scheme is the same as the cartoon in (A). Brackets enclose the cephalic sensory organ pore region. rab-28 mutant males accumulate an excess of EVs (labeled by magenta spheres and pointed to by arrows) in the lumen surrounding the more distal portion of the CEM axoneme whereas bbs-8 mutant males accumulate excessive EVs at all levels of the cephalic lumen. rab-28 and bbs-8 mutants also have an enlarged cephalic pore/opening of the sensory organ.
Figure 5—figure supplement 1.
Figure 5—figure supplement 1.. rab-28(tm2636) negatively regulates extracellular vesicle numbers in cephalic lumens.
(A, E) Cartoon of the ultrastructure of the cephalic sensory organ reproduced from Wang et al. (2014a). Color scheme is same as that in Figure 5. The distal and proximal cephalic lumens (A) and PCMC (E) are marked. (B, C, F) Scatter plots showing the mean number of EVs in the distal (B), proximal (surrounding the TZ region of the CEM cilium) (C), and PCMC (F) regions of the cephalic lumen in control (him-5(e1490)) and rab-28(tm2636) mutant males. Error bars depict SEM. p values determined by unpaired t-tests with Welch’s correction. The rab-28 mutant accumulates significantly more EVs in the cephalic lumen distal to the singlet region of the CEM cilium (B); in a subset of animals, EVs accumulate in regions surrounding the CEM cilium TZ (C) and PCMC (F). Numbers in brackets under genotypes represent the number of cilia. All measurements are from at least 2 animals. Error bars depict SEM. p values calculated by unpaired t-test with Welch’s correction. The variances for the data in panel C are significantly different as assessed by a F-test p=0.0098. (D) TEM of control CEM ciliary tip (left) and slice view of an electron tomogram of the rab-28(tm2636) CEM ciliary tip (right). Arrows point to the CEM ciliary tips, its neighboring CEP cilium, the cuticle overlying the CEM cilium, and the nearby OLQ cilium. Note that the CEM ciliary tip is open and exposed to the environment in both genotypes. Scale bar is 200 nm. (E) TEM of control (him-5) and rab-28(tm2636); him-5 cephalic lumens at the level of the CEM cilium PCMC. White arrows point to the CEM neurons. A subset of rab-28 sensory organs accumulate more EVs (magenta arrowheads) in the cephalic lumen. Scale bar is 100 nm.
Figure 6.
Figure 6.. BBS-8 suppresses ectopic EV shedding in amphid sensory organs.
(A) TEM cross sections of control, rab-28(tm2636), and bbs-8 amphid channel cilia at the middle segment (top) and at the transition zone (bottom). Yellow arrowheads in rab-28 indicate the occasional irregular structure observed in the amphid sensory organ. Magenta arrowheads in bbs-8 point to the ectopic EVs that accumulate in the lumen of amphid sensory organ. Scale bar; 200 nm. (B) High magnification images of EVs in the distal amphid channel (left) and in the proximal amphid channel (right) of bbs-8 mutants. Scale bar; 50 nm. (C) Cartoon representation of EV phenotypes in control and bbs-8 male amphid sensory organs.
Figure 6—figure supplement 1.
Figure 6—figure supplement 1.. rab-28(tm2636) male amphid sensory organs have sheath cell defects.
Left- cartoon representation of the amphid sensory organ with the locations of the different ciliary segments marked. Right-Transmission electron micrographs of chemically frozen control (N2) adult hermaphrodites and cryofixed rab-28 adult males. The amphid sensory organs are outlined in yellow. Yellow arrows indicate matrix filled vesicles. n = 4 worms for WT, n = 2 worms for rab-28 (two amphid pores imaged per worm). Scale bar is 1 μm.
Figure 7.
Figure 7.. Model Cartoon depictions of the cephalic sensory organs in wild-type, EV shedding defective rab-28 and bbs-8 mutants, and EV release defective IFT and axoneme mutants (ccpp-1, ttll-11, klp-6, tba-6).
Color scheme is the same as in Figure 5; magenta spheres represent shed EVs accumulating within sensory organs and EVs released into the environment, brown spheres represent secreted molecules within the sensory lumen. RAB-28 and BBS-8 act at the PCM to regulate EV ciliary base shedding into the lumen without affecting environmental EV release; IFT and ciliary transport components regulate EV release without abrogating EV ciliary base shedding, suggesting two sites and distinct mechanisms. Molecules released into the lumen - either ciliary EVs or secreted proteins - mediate signaling events between neurons and glia and regulate sensory organ size. EV shedding and release defective mutants both have sensory organ size defects as indicated by the expanded lumenal space in both mutant categories. RAB-28 localization in WT CEMs is indicated by purple highlighting.
Author response image 1.
Author response image 1.. BBS-8::GFP localization in rab-28(tm2636) Confocal Z-projections of BBS-8:: GFP in rab-28(tm2636) in amphid cilia (A), phasmid cilia (B), and the EV releasing ray neuron cilia (C).
BBS-8:: GFP levels in rab-28(tm2636) are slightly reduced in ray neurons but, remain unaltered in amphid and phasmid cilia. Scale bar is 1μm for amphid and phasmid panels and 5μm for ray neuron cilia.

Similar articles

Cited by

References

    1. Akella JS, Silva M, Morsci NS, Nguyen KC, Rice WJ, Hall DH, Barr MM. Cell type-specific structural plasticity of the ciliary transition zone in C. elegans. Biology of the Cell. 2019;111:95–107. doi: 10.1111/boc.201800042. - DOI - PMC - PubMed
    1. Ansley SJ, Badano JL, Blacque OE, Hill J, Hoskins BE, Leitch CC, Kim JC, Ross AJ, Eichers ER, Teslovich TM, Mah AK, Johnsen RC, Cavender JC, Lewis RA, Leroux MR, Beales PL, Katsanis N. Basal body dysfunction is a likely cause of pleiotropic Bardet-Biedl syndrome. Nature. 2003;425:628–633. doi: 10.1038/nature02030. - DOI - PubMed
    1. Bacaj T, Tevlin M, Lu Y, Shaham S. Glia are essential for sensory organ function in C. elegans. Science. 2008;322:744–747. doi: 10.1126/science.1163074. - DOI - PMC - PubMed
    1. Bae YK, Qin H, Knobel KM, Hu J, Rosenbaum JL, Barr MM. General and cell-type specific mechanisms target TRPP2/PKD-2 to cilia. Development. 2006;133:3859–3870. doi: 10.1242/dev.02555. - DOI - PubMed
    1. Bae YK, Lyman-Gingerich J, Barr MM, Knobel KM. Identification of genes involved in the ciliary trafficking of C. elegans PKD-2. Developmental Dynamics : An Official Publication of the American Association of Anatomists. 2008;237:2021–2029. doi: 10.1002/dvdy.21531. - DOI - PMC - PubMed

Publication types

MeSH terms

Substances