. 2020 Jun 1;36(11):3537-3548.
doi: 10.1093/bioinformatics/btaa126.

Discovering and interpreting transcriptomic drivers of imaging traits using neural networks

Affiliations

Discovering and interpreting transcriptomic drivers of imaging traits using neural networks

Nova F Smedley et al. Bioinformatics. .

Abstract

Motivation: Cancer heterogeneity is observed at multiple biological levels. To improve our understanding of these differences and their relevance in medicine, approaches to link organ- and tissue-level information from diagnostic images and cellular-level information from genomics are needed. However, these 'radiogenomic' studies often use linear or shallow models, depend on feature selection, or consider one gene at a time to map images to genes. Moreover, no study has systematically attempted to understand the molecular basis of imaging traits based on the interpretation of what the neural network has learned. These studies are thus limited in their ability to understand the transcriptomic drivers of imaging traits, which could provide additional context for determining clinical outcomes.

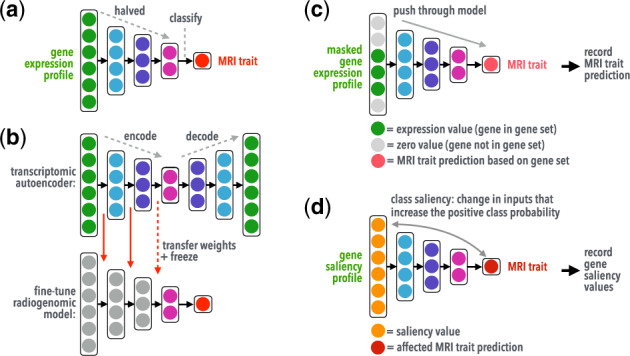
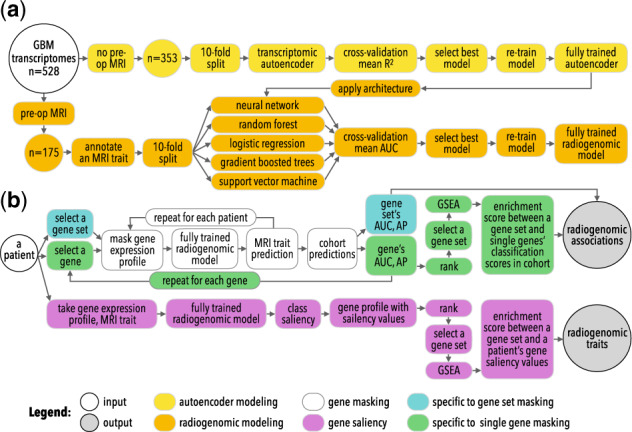
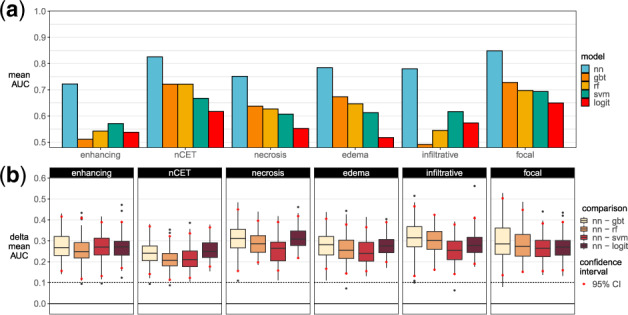
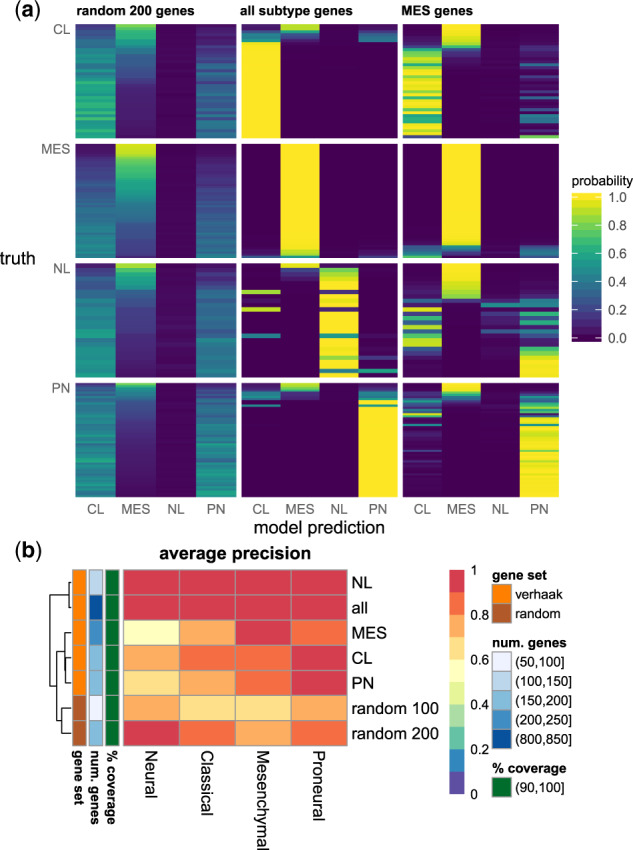
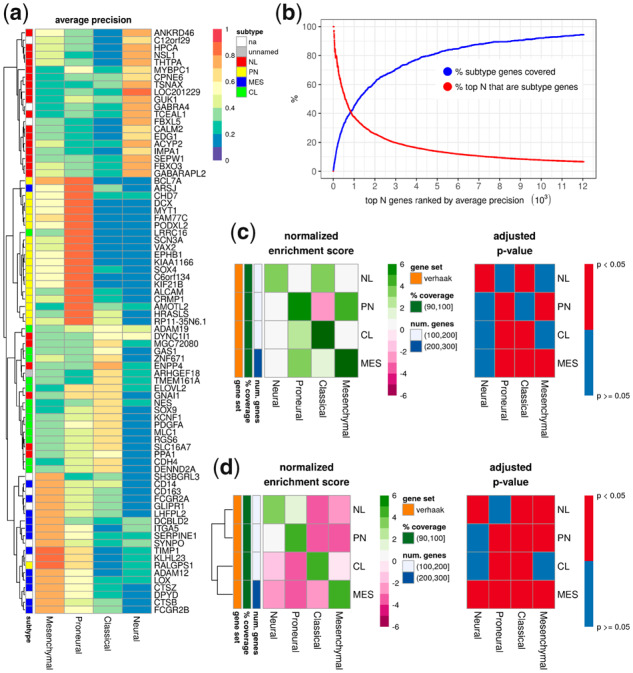
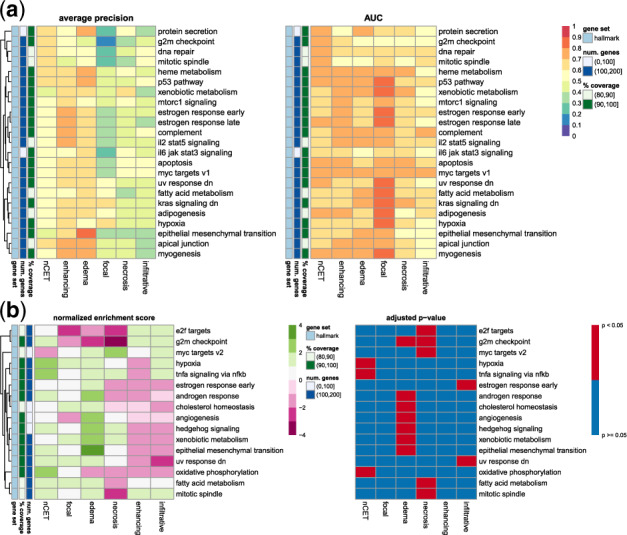
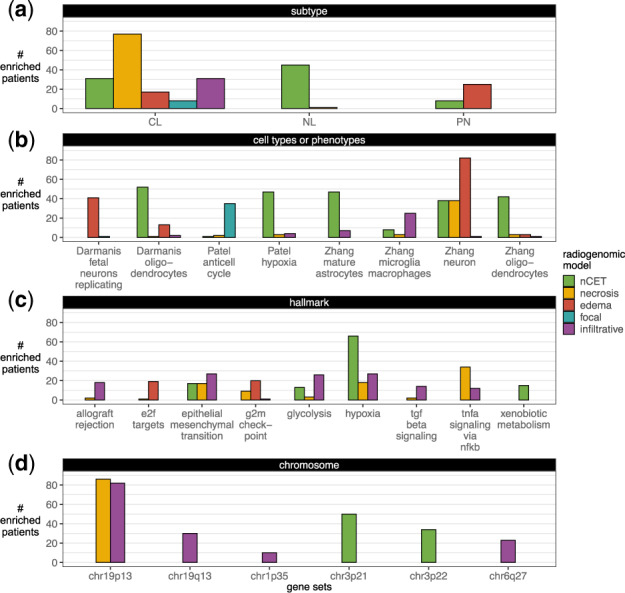
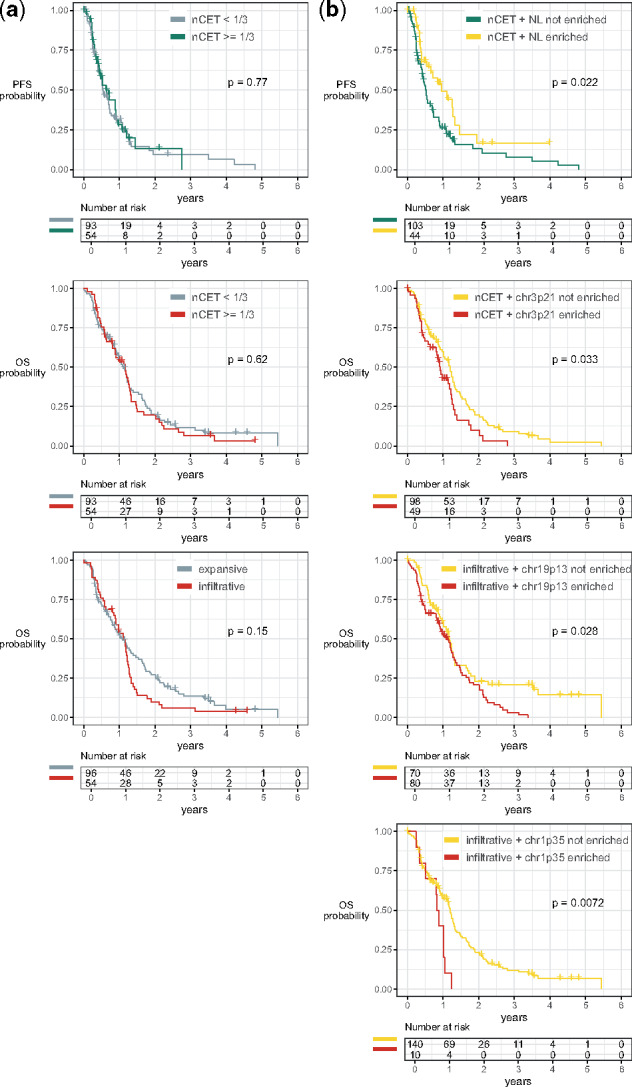
Results: We present a neural network-based approach that takes high-dimensional gene expression data as input and performs non-linear mapping to an imaging trait. To interpret the models, we propose gene masking and gene saliency to extract learned relationships from radiogenomic neural networks. In glioblastoma patients, our models outperformed comparable classifiers (>0.10 AUC) and our interpretation methods were validated using a similar model to identify known relationships between genes and molecular subtypes. We found that tumor imaging traits had specific transcription patterns, e.g. edema and genes related to cellular invasion, and 10 radiogenomic traits were significantly predictive of survival. We demonstrate that neural networks can model transcriptomic heterogeneity to reflect differences in imaging and can be used to derive radiogenomic traits with clinical value.

Availability and implementation: https://github.com/novasmedley/deepRadiogenomics.

Contact: whsu@mednet.ucla.edu.

Supplementary information: Supplementary data are available at Bioinformatics online.


Figures

Fig. 1.
Fig. 1.
Examples of phenotypic differences observed in GBM patients. Shown are single, axial images of pre-op MRI scans from the TCGA–GBM cohort. Four MRI sequences were used to annotate tumor (white arrows) imaging traits: T1W, T1W+Gd and T2W and FLAIR images. MRI traits included enhancing (enhan.), nCET, necrosis (necro.), edema, infiltrative (infil.) and focal, where class labels were indicated by black (proportions <1/3, expansive, or focal) or gray (proportions 1/3, infiltrative, or non-focal) blocks
Fig. 2.
Fig. 2.
Illustration showing(a) the radiogenomic neural network's architecture, (b) transfer learning using a deep transcriptomic autoencoder, and interpretation methods using (c) gene masking and (d) gene saliency. Pretrained weights learned in the autoencoder were transferred to a radiogenomic model, where weights were frozen (non-trainable, long red arrows) and/or fine-tuned (trainable, dashed red arrow) during radiogenomic training. (Color version of this figure is available at Bioinformatics online.)
Fig. 3.
Fig. 3.
An overview of the study’s approaches to radiogenomic neural network (a) training and (b) interpretation, gene masking and gene saliency, to extract radiogenomic associations and radiogenomic traits
Fig. 4.
Fig. 4.
Radiogenomic models performances. (a) Observed 10-fold cross-validation performances. (b) Performance differences between a neural network and another model in 100 bootstrapped datasets. nn, neural network; gbt, gradient-boosted trees; rf, random forest; svm, support vector machines; logit, logistic regression
Fig. 5.
Fig. 5.
Gene masking of the subtype neural network: (a) estimated subtype probabilities, where each row was a patient and grouped by their true subtype and (b) classification performance measured by AP in gene set masking, where each row was a gene set and each column was the subtype prediction (see also Supplementary Figs S6–S8). The random gene set excluded ones in a subtype set. For visualization purposes, rows were sorted by the mesenchymal probabilities. CL, classical; MES, mesenchymal; NL, neural; PN, proneural; all, all 840 subtype genes; coverage, percent of gene set that exist in gene expression profiles
Fig. 6.
Fig. 6.
Single gene masking in the subtype model: (a) the top 20 genes used to predict each subtype; (b) the percent of subtype genes covered in the top N genes; and (c) GSEA with genes ranked by AP, where positive enrichment indicated the subtype gene set was correlated with high AP and vice versa. (d) An alternative GSEA was performed by ranking genes based on their correlation with a subtype, where positive enrichment indicated the subtype gene set was correlated with a subtype and vice versa. na, not a part of the subtype genes; unnamed, a part of the subtype genes, but not tied to a single subtype
Fig. 7.
Fig. 7.
Gene masking of the radiogenomic models with the MSigDB hallmark gene sets. (a) Model performance in gene set masking. Shown are the top five gene sets ranked by AP in each MRI trait (see also Supplementary Fig. S9). (b) Enrichment among genes ranked by AP in single gene masking. Positive enrichment indicated gene sets were predictive of an MRI trait and negative enrichment indicated the opposite. Shown are hallmarks with at least one significant enrichment
Fig. 8.
Fig. 8.
Radiogenomic traits. In gene saliency, each patient’s genes were considered enriched for a gene set at an adjusted P-value of <0.05. (a) Subtype (Verhaak et al., 2010), (b) cell types or phenotypes (Darmanis et al., 2015; Patel et al., 2014; Zhang et al., 2016) and MSigDB’s (c) hallmark and (d) chromosome gene sets with at least ten enriched patients are shown. For more gene saliency results (see Supplementary Fig. S26)
Fig. 9.
Fig. 9.
OS and PFS dichotomized by (left) imaging traits and (right) radiogenomic traits. Patients split in (b) had a median PFS of 0.96 versus 0.52 years (161-day difference). Similarly, the median OS was (d) 1.19 versus 0.91 years (101-day difference), (f) 1.18 versus 1.14 years (15-day difference) and (g) 1.19 versus 0.85 years (125-day difference). No differences were found in (a, c, e)

Similar articles

Cited by

References

    1. Aerts H.J. et al. (2014) Decoding tumour phenotype by noninvasive imaging using a quantitative radiomics approach. Nat. Commun., 5, 4006. - PMC - PubMed
    1. Agarwala R. et al. (2018) Database resources of the National Center for Biotechnology Information. Nucleic Acids Res., 46, D8–D13. - PMC - PubMed
    1. Bengio Y. (2009) Learning Deep Architectures for AI, Vol. 2. Now Publishers, Inc, Boston, MA, USA.
    1. Bourgonje A.M. et al. (2014) Intracellular and extracellular domains of protein tyrosine phosphatase PTPRZ-B differentially regulate glioma cell growth and motility. Oncotarget, 5, 8690–8702. - PMC - PubMed
    1. Chang K. et al. (2018) Residual convolutional neural network for the determination of IDH status in low- and high-grade gliomas from MR imaging. Clin. Cancer Res., 24, 1073–1081. - PMC - PubMed

Publication types