Artificial intelligence deciphers codes for color and odor perceptions based on large-scale chemoinformatic data
- PMID: 32101298
- PMCID: PMC7043059
- DOI: 10.1093/gigascience/giaa011
Artificial intelligence deciphers codes for color and odor perceptions based on large-scale chemoinformatic data
Abstract
Background: Color vision is the ability to detect, distinguish, and analyze the wavelength distributions of light independent of the total intensity. It mediates the interaction between an organism and its environment from multiple important aspects. However, the physicochemical basis of color coding has not been explored completely, and how color perception is integrated with other sensory input, typically odor, is unclear.
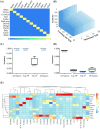
Results: Here, we developed an artificial intelligence platform to train algorithms for distinguishing color and odor based on the large-scale physicochemical features of 1,267 and 598 structurally diverse molecules, respectively. The predictive accuracies achieved using the random forest and deep belief network for the prediction of color were 100% and 95.23% ± 0.40% (mean ± SD), respectively. The predictive accuracies achieved using the random forest and deep belief network for the prediction of odor were 93.40% ± 0.31% and 94.75% ± 0.44% (mean ± SD), respectively. Twenty-four physicochemical features were sufficient for the accurate prediction of color, while 39 physicochemical features were sufficient for the accurate prediction of odor. A positive correlation between the color-coding and odor-coding properties of the molecules was predicted. A group of descriptors was found to interlink prominently in color and odor perceptions.
Conclusions: Our random forest model and deep belief network accurately predicted the colors and odors of structurally diverse molecules. These findings extend our understanding of the molecular and structural basis of color vision and reveal the interrelationship between color and odor perceptions in nature.
Keywords: color perception; deep belief network; odor perception; physicochemical features; random forest.
© The Author(s) 2020. Published by Oxford University Press.
Figures


Similar articles
-
Accurate prediction of personalized olfactory perception from large-scale chemoinformatic features.Gigascience. 2018 Feb 1;7(2):1-11. doi: 10.1093/gigascience/gix127. Gigascience. 2018. PMID: 29267859 Free PMC article.
-
Automatic scent creation by cheminformatics method.Sci Rep. 2024 Dec 28;14(1):31284. doi: 10.1038/s41598-024-82654-7. Sci Rep. 2024. PMID: 39733041 Free PMC article.
-
Olfactory perception of chemically diverse molecules.BMC Neurosci. 2016 Aug 8;17(1):55. doi: 10.1186/s12868-016-0287-2. BMC Neurosci. 2016. PMID: 27502425 Free PMC article.
-
The perception of odor is not a surrogate marker for chemical exposure: a review of factors influencing human odor perception.Clin Toxicol (Phila). 2013 Feb;51(2):70-6. doi: 10.3109/15563650.2013.767908. Clin Toxicol (Phila). 2013. PMID: 23387344 Review.
-
Is It Possible to Predict the Odor of a Molecule on the Basis of its Structure?Int J Mol Sci. 2019 Jun 20;20(12):3018. doi: 10.3390/ijms20123018. Int J Mol Sci. 2019. PMID: 31226833 Free PMC article. Review.
Cited by
-
Prognosis Prediction of Uveal Melanoma After Plaque Brachytherapy Based on Ultrasound With Machine Learning.Front Med (Lausanne). 2022 Jan 21;8:777142. doi: 10.3389/fmed.2021.777142. eCollection 2021. Front Med (Lausanne). 2022. PMID: 35127747 Free PMC article.
-
Deep learning system for screening AIDS-related cytomegalovirus retinitis with ultra-wide-field fundus images.Heliyon. 2024 May 15;10(10):e30881. doi: 10.1016/j.heliyon.2024.e30881. eCollection 2024 May 30. Heliyon. 2024. PMID: 38803983 Free PMC article.
-
Insight into the Structure-Odor Relationship of Molecules: A Computational Study Based on Deep Learning.Foods. 2022 Jul 9;11(14):2033. doi: 10.3390/foods11142033. Foods. 2022. PMID: 35885276 Free PMC article.
-
Combining the Classification and Pharmacophore Approaches to Understand Homogeneous Olfactory Perceptions at Peripheral Level: Focus on Two Aroma Mixtures.Molecules. 2023 May 11;28(10):4028. doi: 10.3390/molecules28104028. Molecules. 2023. PMID: 37241770 Free PMC article.
-
Automatically Diagnosing Disk Bulge and Disk Herniation With Lumbar Magnetic Resonance Images by Using Deep Convolutional Neural Networks: Method Development Study.JMIR Med Inform. 2021 May 21;9(5):e14755. doi: 10.2196/14755. JMIR Med Inform. 2021. PMID: 34018488 Free PMC article.
References
-
- Vukusic P, Sambles JR. Photonic structures in biology. Nature. 2003;424:852–5. - PubMed
-
- Kinoshita S, Yoshioka S, Miyazaki J. Physics of structural colors. Rep Prog Phys. 2008;71:076401.
-
- Wilkinson FA, Murillo SG. Advanced Inorganic Chemistry. Wiley: 1988.
-
- McMurry J. Organic Chemistry. Brooks Cole: 2007.
Publication types
MeSH terms
LinkOut - more resources
Full Text Sources

