Review
. 2020 Apr;93(1108):20190948.
doi: 10.1259/bjr.20190948. Epub 2020 Feb 26.

Radiomics: from qualitative to quantitative imaging

Affiliations
Review

Radiomics: from qualitative to quantitative imaging

William Rogers et al. Br J Radiol. 2020 Apr.

Abstract

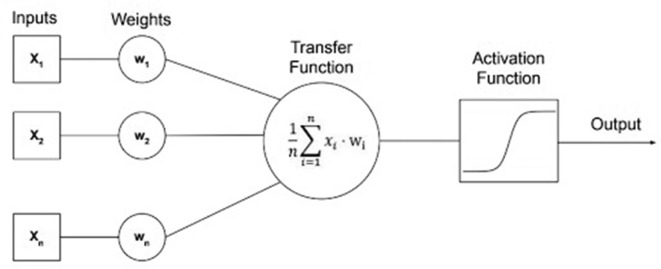
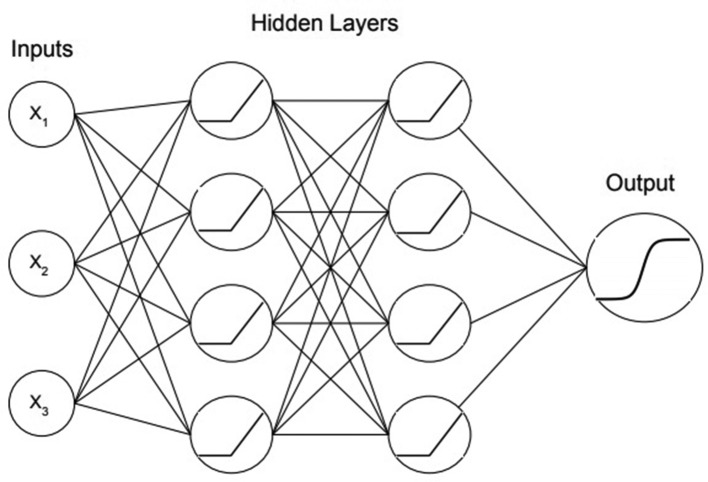
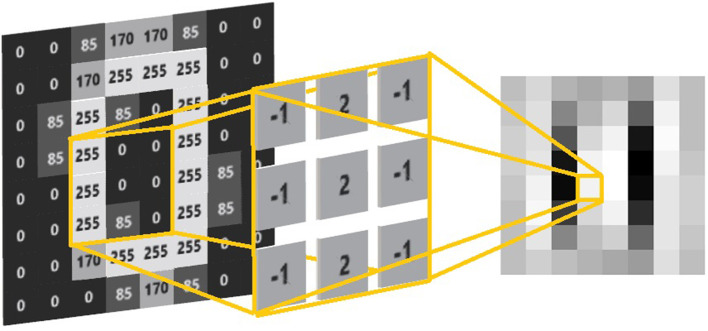
Historically, medical imaging has been a qualitative or semi-quantitative modality. It is difficult to quantify what can be seen in an image, and to turn it into valuable predictive outcomes. As a result of advances in both computational hardware and machine learning algorithms, computers are making great strides in obtaining quantitative information from imaging and correlating it with outcomes. Radiomics, in its two forms "handcrafted and deep," is an emerging field that translates medical images into quantitative data to yield biological information and enable radiologic phenotypic profiling for diagnosis, theragnosis, decision support, and monitoring. Handcrafted radiomics is a multistage process in which features based on shape, pixel intensities, and texture are extracted from radiographs. Within this review, we describe the steps: starting with quantitative imaging data, how it can be extracted, how to correlate it with clinical and biological outcomes, resulting in models that can be used to make predictions, such as survival, or for detection and classification used in diagnostics. The application of deep learning, the second arm of radiomics, and its place in the radiomics workflow is discussed, along with its advantages and disadvantages. To better illustrate the technologies being used, we provide real-world clinical applications of radiomics in oncology, showcasing research on the applications of radiomics, as well as covering its limitations and its future direction.


Conflict of interest statement

Conflict of interest: Dr Philippe Lambin reports, within and outside the submitted work, grants/sponsored research agreements from Varian medical, Oncoradiomics, ptTheragnostic, Health Innovation Ventures and DualTpharma. He received an advisor/presenter fee and/or reimbursement of travel costs/external grant writing fee and/or in-kind manpower contribution from Oncoradiomics, BHV, Merck and Convert pharmaceuticals. Dr Lambin has shares in the company Oncoradiomics SA and Convert pharmaceuticals SA and is co-inventor of two issued patents with royalties on radiomics (PCT/NL2014/050248, PCT/NL2014/050728) licensed to Oncoradiomics and one issue patent on mtDNA (PCT/EP2014/059089) licensed to ptTheragnostic/DNAmito, three non-patentable invention (software) licensed to ptTheragnostic/DNAmito, Oncoradiomics and Health Innovation Ventures.

Dr Woodruff has (minority) shares in the company Oncoradiomics.

Figures

Figure 1.
Figure 1.
Timeline highlighting key developments in medical imaging. CAD, computer-aided diagnosis; GLCM, grey level co-occurring matrix; PET, positron emission tomography.
Figure 2.
Figure 2.
The difference between using (A) a contoured binary mask, and (B) using a bounding box.
Figure 3.
Figure 3.
Possible angles for the calculation of co-occurrence matrices in two and three dimensions. (A) Shows the 4 possible directions in 2 dimensions while (B) shows the 13 possible directions in 3 dimensions.
Figure 4.
Figure 4.
Calculating a GLCM for horizontal co-occurring pixel intensities. In total, 3 co-occurring pixel intensities of 3 and 2 that are next to each other on a horizontal plane can be totalled and tracked in the corresponding matrix. GLCM, grey level co-occurring matrix.
Figure 5.
Figure 5.
An example of fivefold cross-validation which can be used to evaluate machine learning models. Cross-validation gives the ability to test the result across the entirety of a data set, giving a better estimation of a model’s overall performance.
Figure 6.
Figure 6.
The architecture of a single neuron with a transfer function and a sigmoid activation function visualised.
Figure 7.
Figure 7.
A three layer neural network that is a binary classifier with three inputs. Nodes with Xn refer to inputs while other nodes refer to activation functions. The connecting lines between the nodes represent weights.
Figure 8.
Figure 8.
A filter that is able to filter out vertical lines. The yellow lines represent the kernel or sliding window, while the image on the right is the result of performing convolutions across the entirety of the original image.

Similar articles

Cited by

References

    1. Scatliff JH, Morris PJ. From roentgen to magnetic resonance imaging: the history of medical imaging. N C Med J 2014; 75: 111–3. doi: 10.18043/ncm.75.2.111 - DOI - PubMed
    1. Giakos GC, Pastorino M, Russo F, Chowdhury S, Shah N, Davros W. Noninvasive imaging for the new century [Internet]. Vol. 2. IEEE Instrumentation & Measurement Magazine 1999; 49: 32–5.
    1. Prince J, Links J. Medical Imaging: Signals and Systems (Prince, J.L. and Links, J.M.; 2006) [Book Review. IEEE Signal Process Mag 2008; 25: 152–3. doi: 10.1109/MSP.2008.4408454 - DOI
    1. Kesner A, Laforest R, Otazo R, Jennifer K, Pan T. Medical imaging data in the digital innovation age. Med Phys 2018; 45: e40–52. doi: 10.1002/mp.12794 - DOI - PubMed
    1. Miller GA. The magical number seven plus or minus two: some limits on our capacity for processing information. Psychol Rev 1956; 63: 81–97. doi: 10.1037/h0043158 - DOI - PubMed