. 2020 Feb 26;16(2):e1007701.
doi: 10.1371/journal.pcbi.1007701. eCollection 2020 Feb.

Individualized genetic network analysis reveals new therapeutic vulnerabilities in 6,700 cancer genomes

Affiliations

Individualized genetic network analysis reveals new therapeutic vulnerabilities in 6,700 cancer genomes

Chuang Liu et al. PLoS Comput Biol. .

Abstract

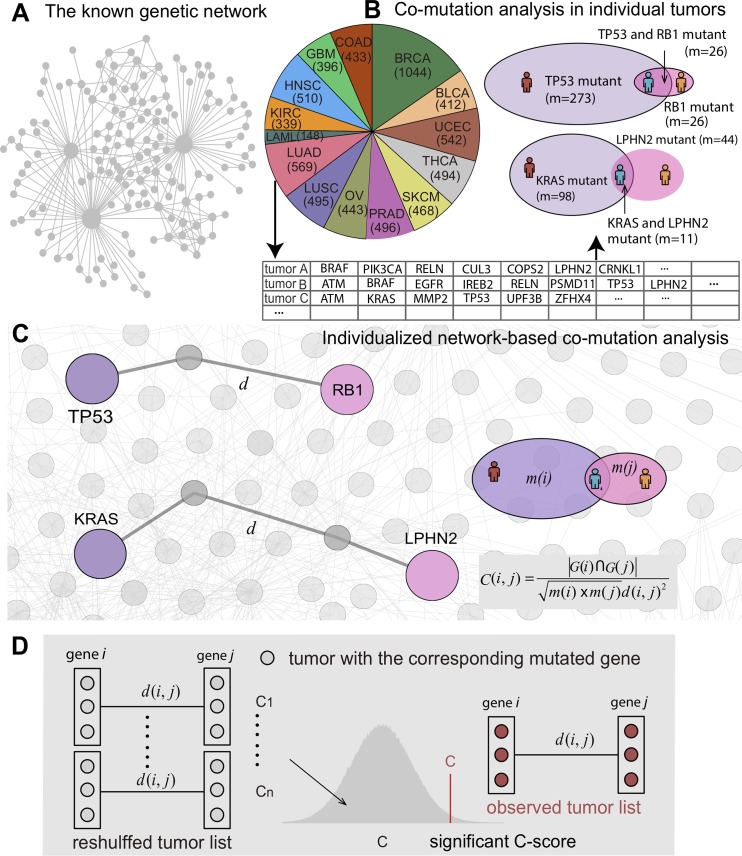
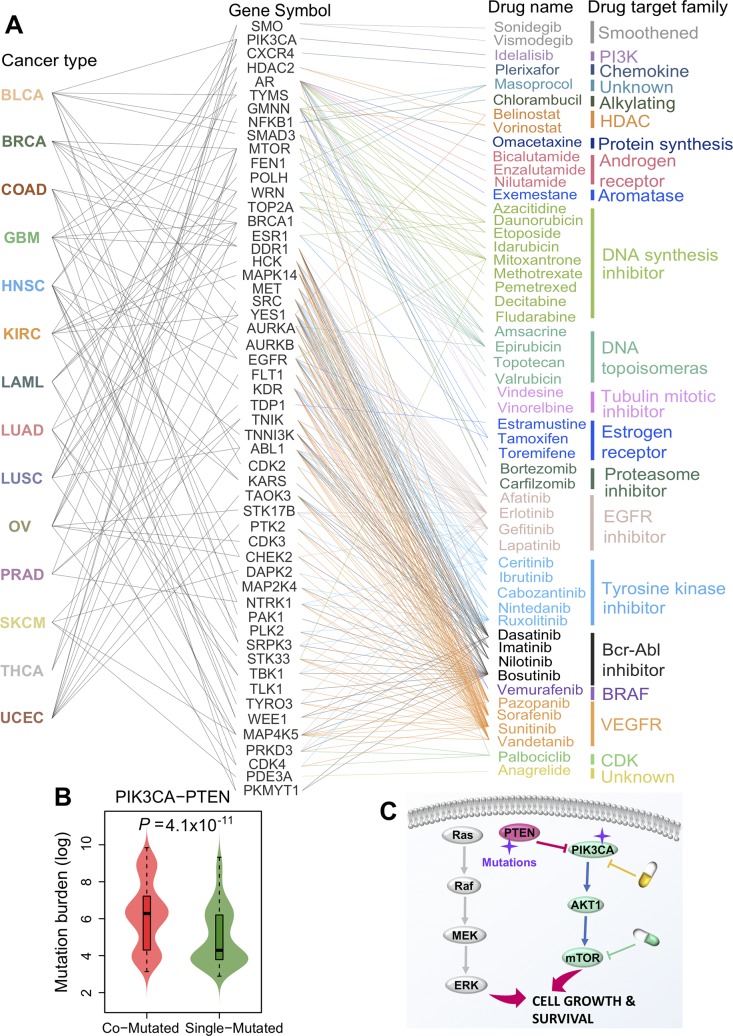
Tumor-specific genomic alterations allow systematic identification of genetic interactions that promote tumorigenesis and tumor vulnerabilities, offering novel strategies for development of targeted therapies for individual patients. We develop an Individualized Network-based Co-Mutation (INCM) methodology by inspecting over 2.5 million nonsynonymous somatic mutations derived from 6,789 tumor exomes across 14 cancer types from The Cancer Genome Atlas. Our INCM analysis reveals a higher genetic interaction burden on the significantly mutated genes, experimentally validated cancer genes, chromosome regulatory factors, and DNA damage repair genes, as compared to human pan-cancer essential genes identified by CRISPR-Cas9 screenings on 324 cancer cell lines. We find that genes involved in the cancer type-specific genetic subnetworks identified by INCM are significantly enriched in established cancer pathways, and the INCM-inferred putative genetic interactions are correlated with patient survival. By analyzing drug pharmacogenomics profiles from the Genomics of Drug Sensitivity in Cancer database, we show that the network-predicted putative genetic interactions (e.g., BRCA2-TP53) are significantly correlated with sensitivity/resistance of multiple therapeutic agents. We experimentally validated that afatinib has the strongest cytotoxic activity on BT474 (IC50 = 55.5 nM, BRCA2 and TP53 co-mutant) compared to MCF7 (IC50 = 7.7 μM, both BRCA2 and TP53 wild type) and MDA-MB-231 (IC50 = 7.9 μM, BRCA2 wild type but TP53 mutant). Finally, drug-target network analysis reveals several potential druggable genetic interactions by targeting tumor vulnerabilities. This study offers a powerful network-based methodology for identification of candidate therapeutic pathways that target tumor vulnerabilities and prioritization of potential pharmacogenomics biomarkers for development of personalized cancer medicine.


Conflict of interest statement

The authors declare no competing financial interest.

Figures

Fig 1
Fig 1. Diagram illustrating the pipeline of Individualized Network-based Co-Mutation (INCM) measure.
(A) A network diagram showing prior topological architecture in the known human genetic interaction network. (B) Network-based co-mutation analysis by integrating over 2.5 million nonsynonymous somatic mutations derived from 6,789 tumor exomes across 14 cancer types from TCGA. (C) Individualized network-based co-mutation measure. The d denotes the shortest path length between genes i and j in the cancer type-specific co-expressed human genetic interaction network (see Methods). (D) The INCM measure (C-score) integrates the somatic mutations and network topology information of mutated genes in the experimentally validated human genetic interaction network (see Methods).
Fig 2
Fig 2. A pan-cancer genetic interaction network.
(A) Network visualization of a pan-cancer genetic interaction network identified by Individualized Network-based Co-Mutation (INCM) measure across 14 cancer types (S4 Table). (B) Network overlapping analysis of cancer type-specific genetic interaction networks across 14 cancer types. The node size in B represents the number of genes in each cancer type-specific genetic interaction network, and the thickness of the edges between the vertexes represents the number of overlapping genes. (C) Canonical cancer pathway enrichment analysis for the INCM-identified cancer type-specific genetic interaction networks across 14 cancer types: bladder urothelial carcinoma (BLCA), breast invasive carcinoma (BRCA), colon adenocarcinoma (COAD), glioblastoma multiforme (GBM), head and neck squamous cell carcinoma (HNSC), kidney renal clear cell carcinoma (KIRC), acute myeloid leukemia (LAML), lung adenocarcinoma (LUAD), lung squamous cell carcinoma (LUSC), ovarian serous cystadenocarcinoma (OV), prostate adenocarcinoma (PRAD), skin cutaneous melanoma (SKCM), thyroid carcinoma (THCA), and uterine corpus endometrial carcinoma (UCEC).
Fig 3
Fig 3. Individualized Network-based Co-Mutation (INCM) measure is a good proxy for tumorigenesis.
(A and B) Boxplots show distribution of INCM-based co-mutation scores for five functional gene sets: significantly mutated genes (SMGs), experimentally validated cancer genes (Cancer Gene Census [CGC]), chromatin regulation factors (CRFs), DNA Damage Repair (DDR) genes, and pan-cancer essential genes across 14 cancer types. P-value was computed by Wilcoxon test. * 0.01<p-value<0.05, ** p-value<0.01. (C and D) The gene enrichment analysis for genes in the INCM-identified putative genetic interactions across four functional gene sets across 14 cancer types. The box-plots in C and D are the distribution of the random expectation while the cycles represent the number of the genes for the overlap of the final subnetworks and the cancer related gene sets (red circle: p-value<0.01, green cycle: 0.01<p-value<0.05, and gray cycle: p-value > 0.05). A detailed comparison to random expectation and statistical testing is provided in S2–S5 Figs. The full name of 14 cancer types are provided in Fig 2’s legend.
Fig 4
Fig 4. Network-predicted genetic interactions correlate with patient survival in human skin cutaneous melanoma (SKCM).
(A) The putative genetic interaction network in SKCM identified by individualized network-based co-mutation (INCM) measure. (B-E) The INCM-predicted significantly putative genetic interactions correlate with patient survival rate. BACH2-KRAS (B) and SEPT1-BRIP1 (D) are significantly co-mutated in individual SKCM patients (S4 Table). Patients have non-synonymous somatic mutations (Mutant [Mut] group) on genes of BACH2-KRAS (C) and SEPT1-BRIP1 (E) are significantly correlate with poor survival rate comparing to wild-type [WT] status on both genes. Survival analysis is performed by the “survival” package in R (v3.4.3) and p-value is compared by log-rank test.
Fig 5
Fig 5. Network-predicted genetic interactions offer cancer pharmacogenomics.
(A) A bubble plot illustrates that the predicted putative genetic interactions by individualized network-based co-mutation (INCM) measure correlate with drug responses (sensitivity/resistance) for 14 selected anticancer agents. Each dot represents the genetic interaction (gene pair). The size of dots denotes the adjusted P-value (q) of relationship between INCM-predicted putative genetic interactions and drug responses. Three types of genetic interactions are illustrated: known genetic interactions (GI), INCM-predicted GI only in individual tumors (Network-predicted GIs), and known GIs and INCM-predicted GI in individual tumors. (B-D) Bean plots illustrating two selected genetic interactions (highlighted by arrow in a) correlating with drug resistance or sensitivity of known anti-cancer agents: Bicalutamide (B), JQ1 (C), and (D) Afatinib. The detailed data for Fig 5A is provided in the S7 Table. P-value is computed using R anova function package (v3.4.3). (E) Cell viability assay of afatinib on three breast cancer cell lines with different genotypes: BT474 (BRCA2 mutant [p.S3094*] and TP53 mutant [p.E285K]), MCF7 (both BRCA2 and TP53 wild-type), and MDA-MB-231 (BRCA2 wild type but TP53 mutant [p.R280K]). The half maximal inhibitory concentration (IC50) value is determined from the results of at least three independent tests (see Methods).
Fig 6
Fig 6. Clinically actionable genes on the network-predicted genetic interactions.
(A) The mapping between FDA-approved or clinically investigational drugs and their related clinically actionable genes on the putative genetic interactions identified by individualized network-based co-mutation (INCM) measure. The drugs are grouped based on their primary target families (S8 Table). (B) Mutation burden for PIK3CA-PTEN co-mutant (co-mutated) tumors compared to single-mutant tumors on PIK3CA or PTEN alone in uterine corpus endometrial carcinoma (UCEC). P-value was computed by Wilcoxon test. (C) A proposed pharmacogenomics model for drug sensitivity/resistance mechanism of somatic mutations on PTEN-PIK3CA in human cancers. PIK3CA-PTEN (P < 1.0x10⁻⁴) was significantly co-mutated in UCEC identified by INCM measure. The full name of 14 cancer types are provided in Fig 2’s legend.

Similar articles

Cited by

References

    1. Vogelstein B, Papadopoulos N, Velculescu VE, Zhou S, Diaz LA Jr., Kinzler KW. Cancer genome landscapes. Science. 2013; 339(6127):1546–58. 10.1126/science.1235122 - DOI - PMC - PubMed
    1. Martincorena I, Campbell PJ. Somatic mutation in cancer and normal cells. Science. 2015; 349(6255):1483–9. 10.1126/science.aab4082 - DOI - PubMed
    1. Garraway LA, Lander ES. Lessons from the cancer genome. Cell. 2013; 153(1):17–37. 10.1016/j.cell.2013.03.002 - DOI - PubMed
    1. Bailey MH, Tokheim C, Porta-Pardo E, Sengupta S, Bertrand D, Weerasinghe A, et al. Comprehensive characterization of cancer driver genes and mutations. Cell. 2018; 173(2):371–85 e18. 10.1016/j.cell.2018.02.060 - DOI - PMC - PubMed
    1. Mullard A. 2016. FDA drug approvals. Nat Rev Drug Discov. 2017; 16(2):73–6. 10.1038/nrd.2017.14 - DOI - PubMed

Publication types

MeSH terms