Comparative Study
. 2020 Feb 26;15(2):e0229134.
doi: 10.1371/journal.pone.0229134. eCollection 2020.

Comparison of choroidal thickness measurements using swept source and spectral domain optical coherence tomography in pachychoroid diseases

Affiliations
Comparative Study

Comparison of choroidal thickness measurements using swept source and spectral domain optical coherence tomography in pachychoroid diseases

Min-Woo Lee et al. PLoS One. .

Abstract

Purpose: To determine the comparability of choroidal thickness (ChT) measurements using swept source (SS) and spectral domain (SD) optical coherence tomography (OCT) devices in patients with pachychoroid diseases.

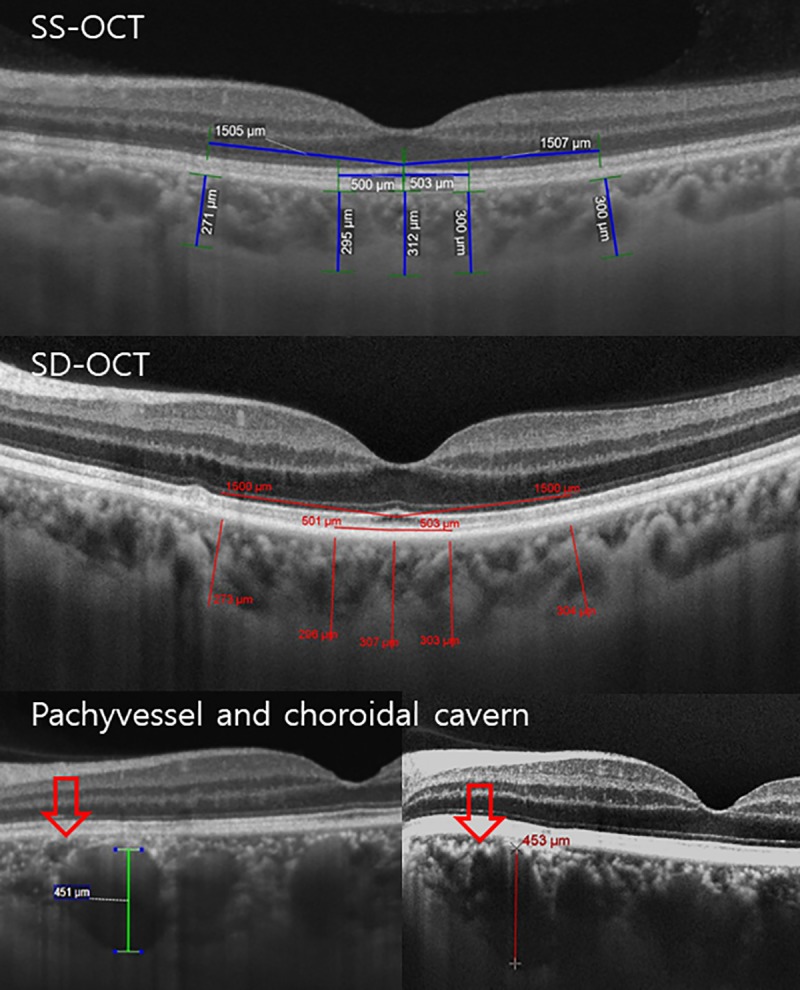
Methods: Patients with pachychoroid diseases were recruited. OCT scans were performed sequentially with a Cirrus HD OCT 5000 and Plex Elite 9000. Images were analyzed by two independent observers. Each image was independently measured twice by each observer to determine the intraobserver repeatability.

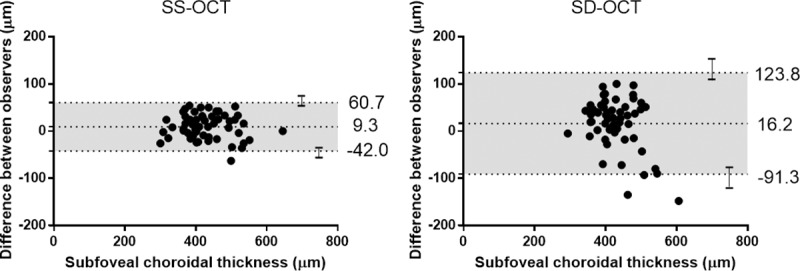
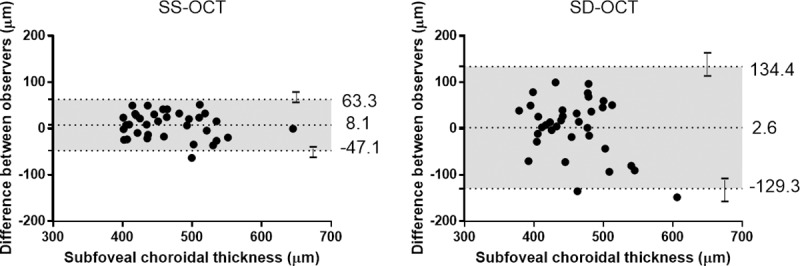
Results: A total of 55 eyes were included. The average ChT of the subfoveal area using SS-OCT and SD-OCT was 430.5 ± 68.1 and 428.5 ± 57.9 μm, respectively, which did not show a significant result as the main effect in the repeated-measure analysis of variance (P = 0.067). Using SS-OCT, the intraobserver intraclass correlation coefficient (ICC) of both observers was > 0.950 at every measured point, and the interobserver coefficient of repeatability (CR) of the subfoveal area was 45.1 μm (95% confidence interval (CI), 40.8-49.4). Using SD-OCT, the intraobserver ICC of both observers was > 0.800, and the interobserver CR of the subfoveal area was 71.2 μm (95% CI, 64.4-78.0). Additionally, the intraobserver and interobserver CRs showed significantly better repeatability in SS-OCT than SD-OCT in F-test. In patients with ChT ≥ 400 μm, the interobserver CRs of SS-OCT and SD-OCT were 48.4 (95% CI, 42.6-54.2) and 95.2 μm (95% CI, 83.9-106.6), respectively. In patients with a subfoveal active lesion, the interobserver CRs were 44.5 (95% CI, 37.6-51.4) and 100.1 μm (95% CI, 84.6-115.5), respectively.

Conclusions: Although the ChT measurements were comparable between SS-OCT and SD-OCT devices in pachychoroid diseases, SD-OCT showed low reliability in patients with ChT ≥ 400 μm and subfoveal active lesions. SS-OCT would be therefore more suitable for observation and follow-up of choroidal structures in pachychoroid diseases.


Conflict of interest statement

NO authors have competing interests.

Figures

Fig 1
Fig 1. Choroidal thickness, pachyvessel diameter, and choroidal cavern (red arrows) on swept source (SS) and spectral domain (SD) optical coherence tomography (OCT) images.
Chroidal thickness was obtained by measuring the perpendicular distance from the outer portion of the hyperreflective line corresponding to the retinal pigment epithelium to the inner surface of the sclera using software calipers at five points: the subfoveal area, and at the temporal and nasal points at radii of 500 and 1500 μm.
Fig 2
Fig 2. Bland-Altman plots for agreement between two observers using swept source (SS) and spectral domain (SD) optical coherence tomography (OCT).
The dashed lines show mean difference and 95% limits of agreement, and error bars mean 95% confidence intervals for limits of agreement. The spread points of SS-OCT were much smaller than those of SD-OCT.
Fig 3
Fig 3. Bland-Altman plots for agreement between two observers using swept source (SS) and spectral domain (SD) (B) optical coherence tomography (OCT) in eyes with choroidal thickness ≥ 400 μm.
The dashed lines show mean difference and 95% limits of agreement, and error bars mean 95% confidence intervals for limits of agreement. The differences in SD-OCT tended to be larger in patients with thicknesses ≥ 400 μm, whereas the differences in SS-OCT measurements were similar.
Fig 4
Fig 4. Representative optical coherence tomography (OCT) images showing the difference in the clarity of the choroid-scleral boundary between swept source (SS) and spectral domain (SD) OCT.
SS-OCT scan (A) and SD-OCT scan (B) of a patient with resolved central serous chorioretinopathy (CSC). The choroid-scleral boundary is observed more clearly in A than in B. SS-OCT scan (C) and SD-OCT scan (D) of a CSC patient with subretinal fluid (SRF). The choroid-scleral boundary of D is faint behind the SRF because of a shadow and hyperreflective layer within the choroid, whereas C shows a relatively clear choroid-scleral boundary.

Similar articles

Cited by

References

    1. Warrow DJ, Hoang QV, Freund KB. Pachychoroid pigment epitheliopathy. Retina. 2013;33(8):1659–72. 10.1097/IAE.0b013e3182953df4 - DOI - PubMed
    1. Pang CE, Freund KB. Pachychoroid neovasculopathy. Retina. 2015;35(1):1–9. 10.1097/IAE.0000000000000331 - DOI - PubMed
    1. Dansingani KK, Balaratnasingam C, Naysan J, Freund KB. En face imaging of pachychoroid spectrum disorders with swept-source optical coherence tomography. Retina. 2016;36(3):499–516. 10.1097/IAE.0000000000000742 - DOI - PubMed
    1. Gallego-Pinazo R, Dolz-Marco R, Gómez-Ulla F, Mrejen S, Freund KB. Pachychoroid diseases of the macula. Medical Hypothesis, Discovery and Innovation in Ophthalmology. 2014;3(4):111. - PMC - PubMed
    1. Laviers H, Zambarakji H. Enhanced depth imaging-OCT of the choroid: a review of the current literature. Graefe's Archive for Clinical and Experimental Ophthalmology. 2014;252(12):1871–83. 10.1007/s00417-014-2840-y - DOI - PubMed

Publication types