Transcriptomic profiling of PBDE-exposed HepaRG cells unveils critical lncRNA- PCG pairs involved in intermediary metabolism
- PMID: 32101552
- PMCID: PMC7043721
- DOI: 10.1371/journal.pone.0224644
Transcriptomic profiling of PBDE-exposed HepaRG cells unveils critical lncRNA- PCG pairs involved in intermediary metabolism
Abstract
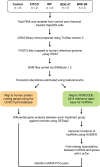
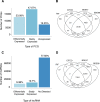
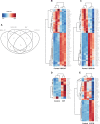
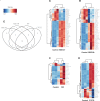
Polybrominated diphenyl ethers (PBDEs) were formally used as flame-retardants and are chemically stable, lipophlic persistent organic pollutants which are known to bioaccumulate in humans. Although its toxicities are well characterized, little is known about the changes in transcriptional regulation caused by PBDE exposure. Long non-coding RNAs (lncRNAs) are increasingly recognized as key regulators of transcriptional and translational processes. It is hypothesized that lncRNAs can regulate nearby protein-coding genes (PCGs) and changes in the transcription of lncRNAs may act in cis to perturb gene expression of its neighboring PCGs. The goals of this study were to 1) characterize PCGs and lncRNAs that are differentially regulated from exposure to PBDEs; 2) identify PCG-lncRNA pairs through genome annotation and predictive binding tools; and 3) determine enriched canonical pathways caused by differentially expressed lncRNA-PCGs pairs. HepaRG cells, which are human-derived hepatic cells that accurately represent gene expression profiles of human liver tissue, were exposed to BDE-47 and BDE-99 at a dose of 25 μM for 24 hours. Differentially expressed lncRNA-PCG pairs were identified through DESeq2 and HOMER; significant canonical pathways were determined through Ingenuity Pathway Analysis (IPA). LncTar was used to predict the binding of 19 lncRNA-PCG pairs with known roles in drug-processing pathways. Genome annotation revealed that the majority of the differentially expressed lncRNAs map to PCG introns. PBDEs regulated overlapping pathways with PXR and CAR such as protein ubiqutination pathway and peroxisome proliferator-activated receptor alpha-retinoid X receptor alpha (PPARα-RXRα) activation but also regulate distinctive pathways involved in intermediary metabolism. PBDEs uniquely down-regulated GDP-L-fucose biosynthesis, suggesting its role in modifying important pathways involved in intermediary metabolism such as carbohydrate and lipid metabolism. In conclusion, we provide strong evidence that PBDEs regulate both PCGs and lncRNAs in a PXR/CAR ligand-dependent and independent manner.
Conflict of interest statement
The authors have declared that no competing interests exist.
Figures



Similar articles
-
Regulation of protein-coding gene and long noncoding RNA pairs in liver of conventional and germ-free mice following oral PBDE exposure.PLoS One. 2018 Aug 1;13(8):e0201387. doi: 10.1371/journal.pone.0201387. eCollection 2018. PLoS One. 2018. PMID: 30067809 Free PMC article.
-
Regulation of Hepatic Long Noncoding RNAs by Pregnane X Receptor and Constitutive Androstane Receptor Agonists in Mouse Liver.Drug Metab Dispos. 2019 Mar;47(3):329-339. doi: 10.1124/dmd.118.085142. Epub 2018 Dec 28. Drug Metab Dispos. 2019. PMID: 30593543 Free PMC article.
-
Flame retardant BDE-47 effectively activates nuclear receptor CAR in human primary hepatocytes.Toxicol Sci. 2014 Feb;137(2):292-302. doi: 10.1093/toxsci/kft243. Epub 2013 Nov 11. Toxicol Sci. 2014. PMID: 24218150 Free PMC article.
-
Transcriptional and post-transcriptional regulation of the pregnane X receptor: a rationale for interindividual variability in drug metabolism.Arch Toxicol. 2021 Jan;95(1):11-25. doi: 10.1007/s00204-020-02916-x. Epub 2020 Nov 9. Arch Toxicol. 2021. PMID: 33164107 Review.
-
Critical review of soil contamination by polybrominated diphenyl ethers (PBDEs) and novel brominated flame retardants (NBFRs); concentrations, sources and congener profiles.Environ Pollut. 2017 Nov;230:741-757. doi: 10.1016/j.envpol.2017.07.009. Epub 2017 Jul 18. Environ Pollut. 2017. PMID: 28732337 Review.
Cited by
-
Understanding the physiological functions of the host xenobiotic-sensing nuclear receptors PXR and CAR on the gut microbiome using genetically modified mice.Acta Pharm Sin B. 2022 Feb;12(2):801-820. doi: 10.1016/j.apsb.2021.07.022. Epub 2021 Jul 29. Acta Pharm Sin B. 2022. PMID: 35256948 Free PMC article.
-
Role of non-coding-RNAs in response to environmental stressors and consequences on human health.Redox Biol. 2020 Oct;37:101580. doi: 10.1016/j.redox.2020.101580. Epub 2020 Jul 18. Redox Biol. 2020. PMID: 32723695 Free PMC article. Review.
-
Mechanisms of Male Reproductive Toxicity of Polybrominated Diphenyl Ethers.Int J Mol Sci. 2022 Nov 17;23(22):14229. doi: 10.3390/ijms232214229. Int J Mol Sci. 2022. PMID: 36430706 Free PMC article. Review.
-
BDE-47, -99, -209 and Their Ternary Mixture Disrupt Glucose and Lipid Metabolism of Hepg2 Cells at Dietary Relevant Concentrations: Mechanistic Insight through Integrated Transcriptomics and Proteomics Analysis.Int J Mol Sci. 2022 Nov 21;23(22):14465. doi: 10.3390/ijms232214465. Int J Mol Sci. 2022. PMID: 36430946 Free PMC article.
-
Polybrominated diphenyl ether flame retardants inhibit growth factor-induced activation of EGFR by binding to its extracellular domain.Arch Toxicol. 2025 Feb;99(2):745-753. doi: 10.1007/s00204-024-03926-9. Epub 2024 Dec 12. Arch Toxicol. 2025. PMID: 39668266
References
-
- Zhang J., Chen L., Xiao L., Ouyang F., Zhang Q.Y., and Luo Z.C. (2017). Polybrominated Diphenyl Ether Concentrations in Human Breast Milk Specimens Worldwide. Epidemiology 28 Suppl 1, S89–S97. - PubMed
-
- Lilienthal H., Hack A., Roth-Harer A., Grande S.W., and Talsness C.E. (2006). Effects of developmental exposure to 2,2,4,4,5-pentabromodiphenyl ether (PBDE-99) on sex steroids, sexual development, and sexually dimorphic behavior in rats. Environ Health Perspect 114, 194–201. 10.1289/ehp.8391 - DOI - PMC - PubMed
Publication types
MeSH terms
Substances
Grants and funding
LinkOut - more resources
Full Text Sources
Molecular Biology Databases

