. 2020 Feb 26;15(2):e0229495.
doi: 10.1371/journal.pone.0229495. eCollection 2020.

Quantile-dependent expressivity of postprandial lipemia

Affiliations

Quantile-dependent expressivity of postprandial lipemia

Paul T Williams. PLoS One. .

Abstract

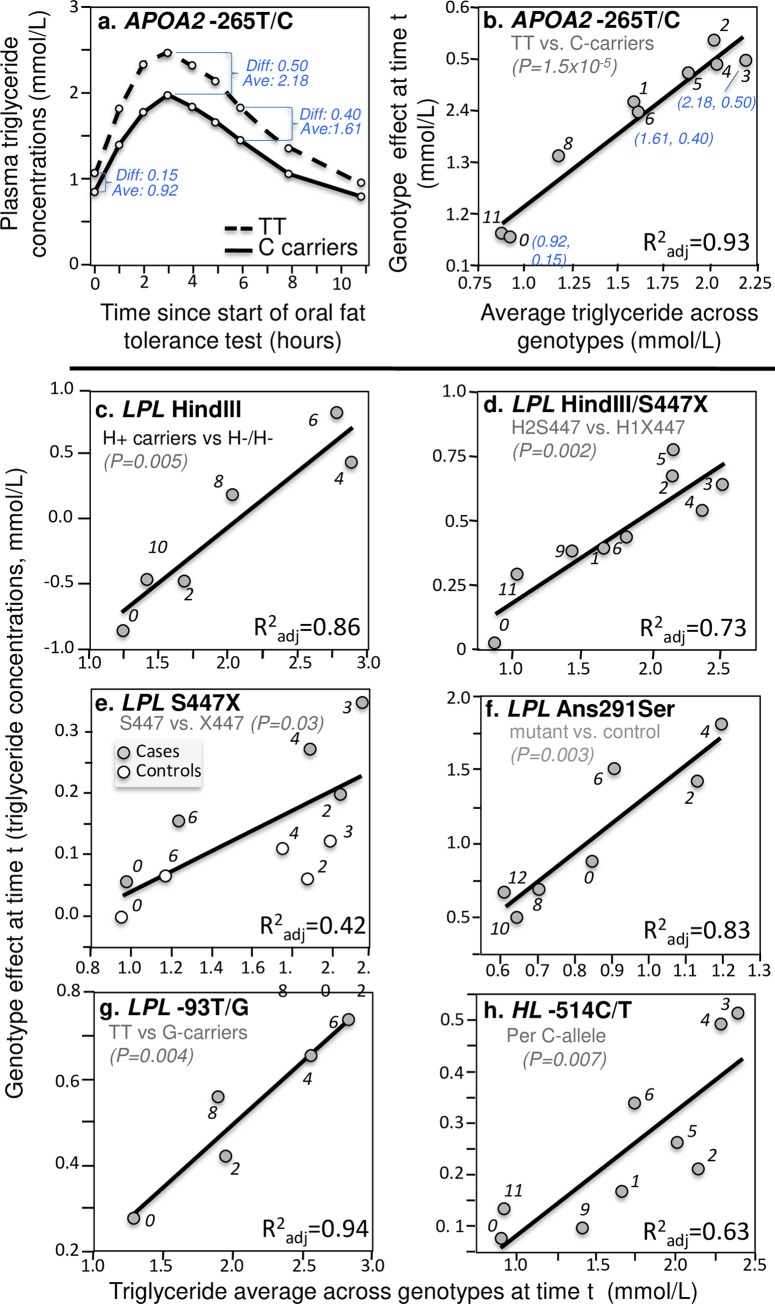
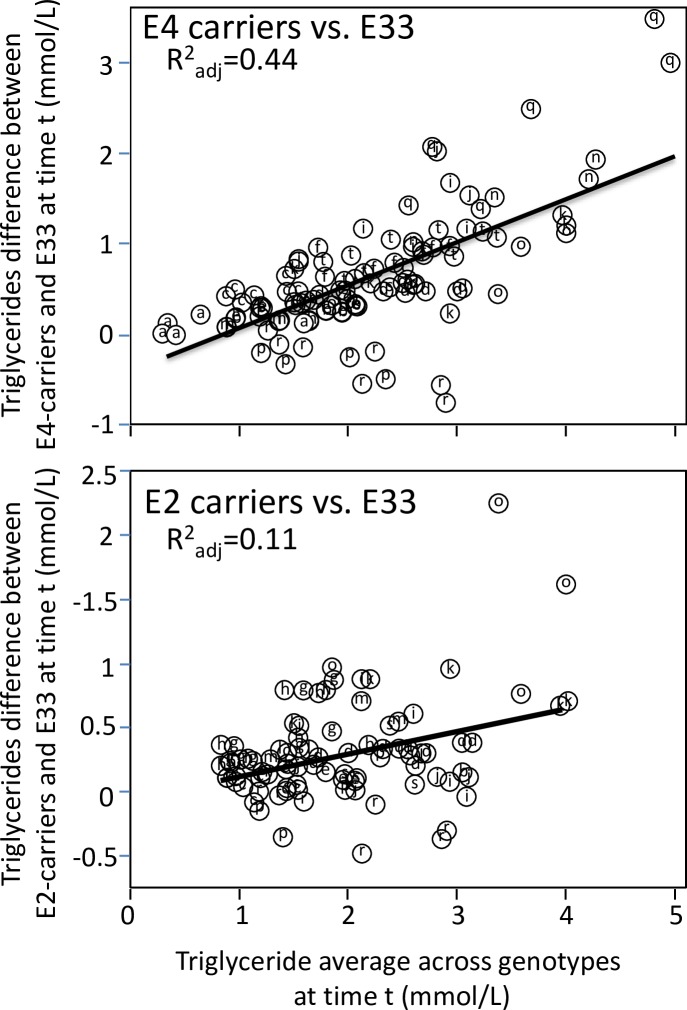
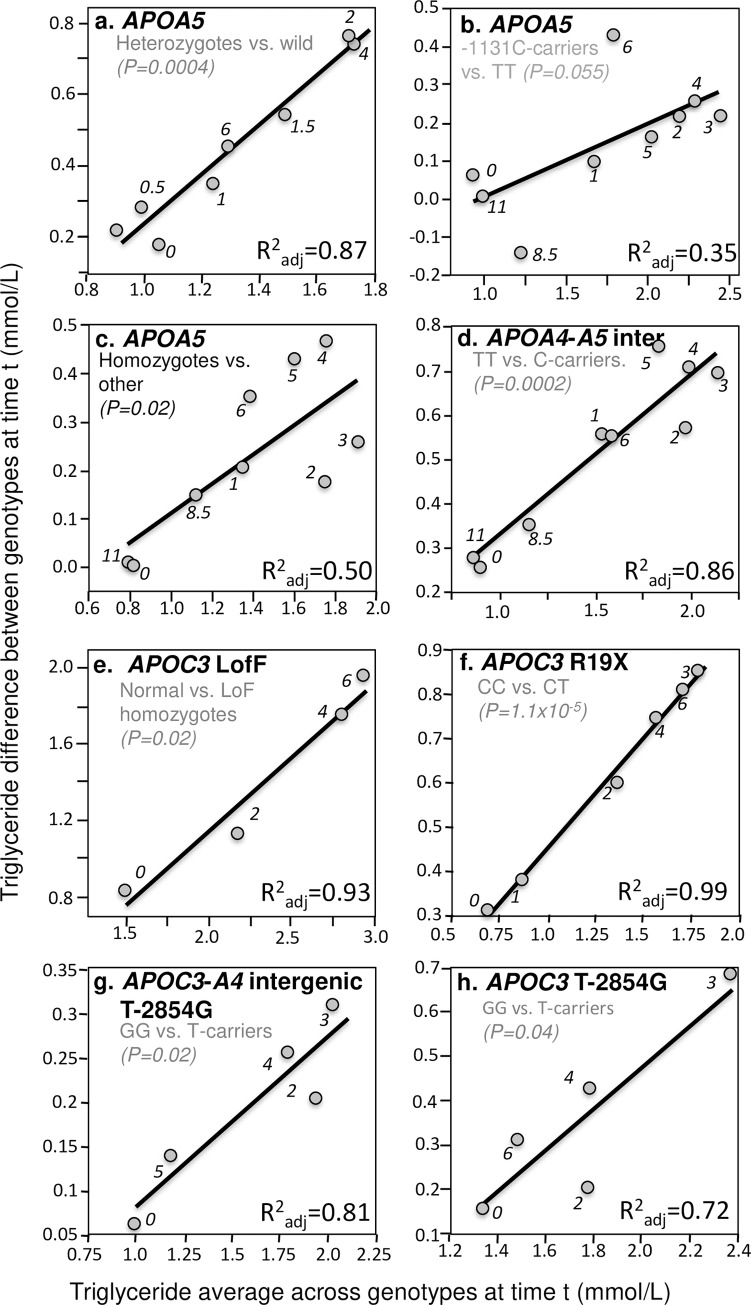
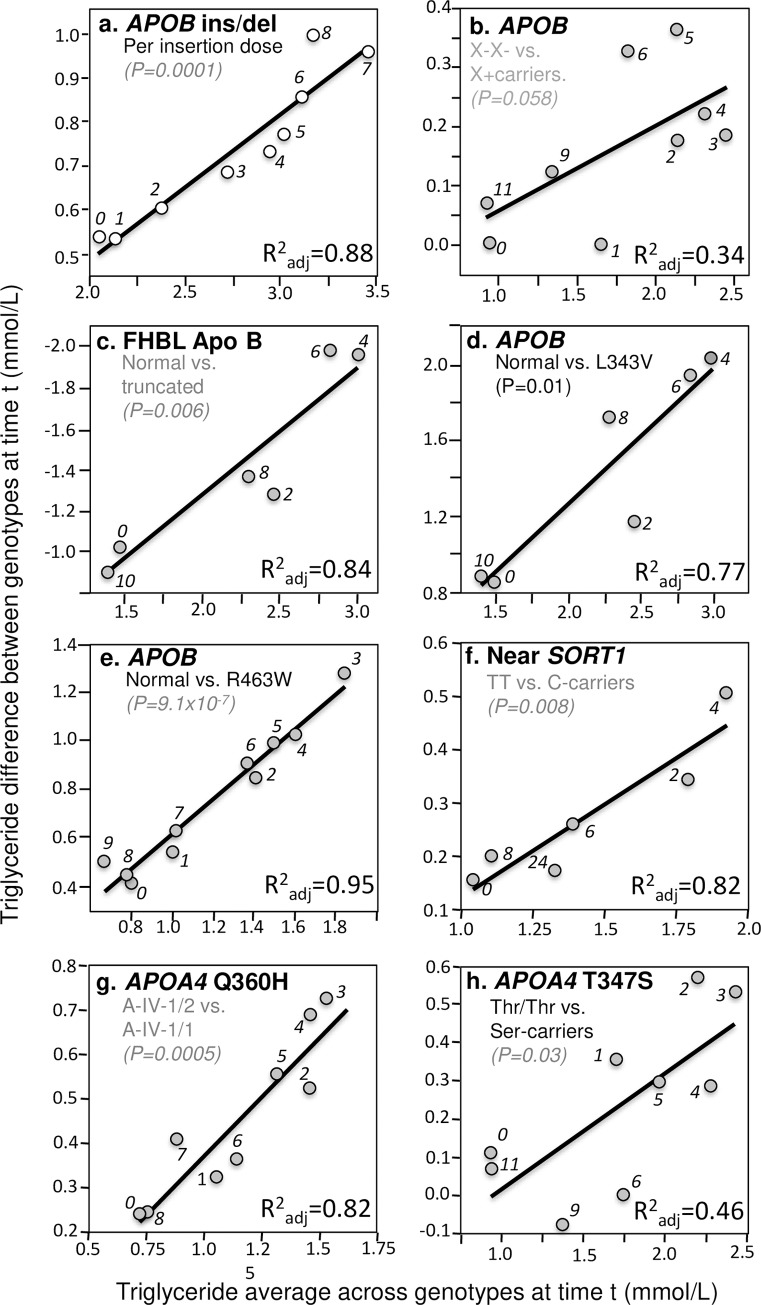
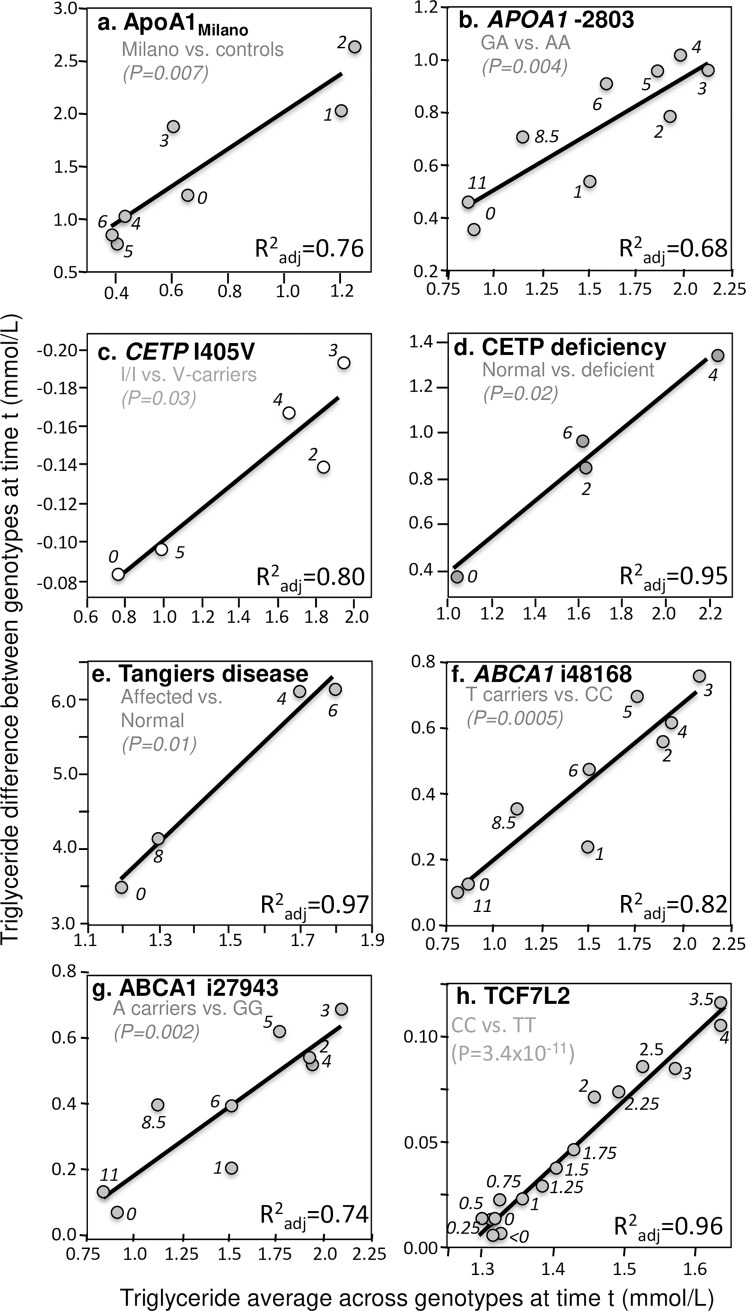
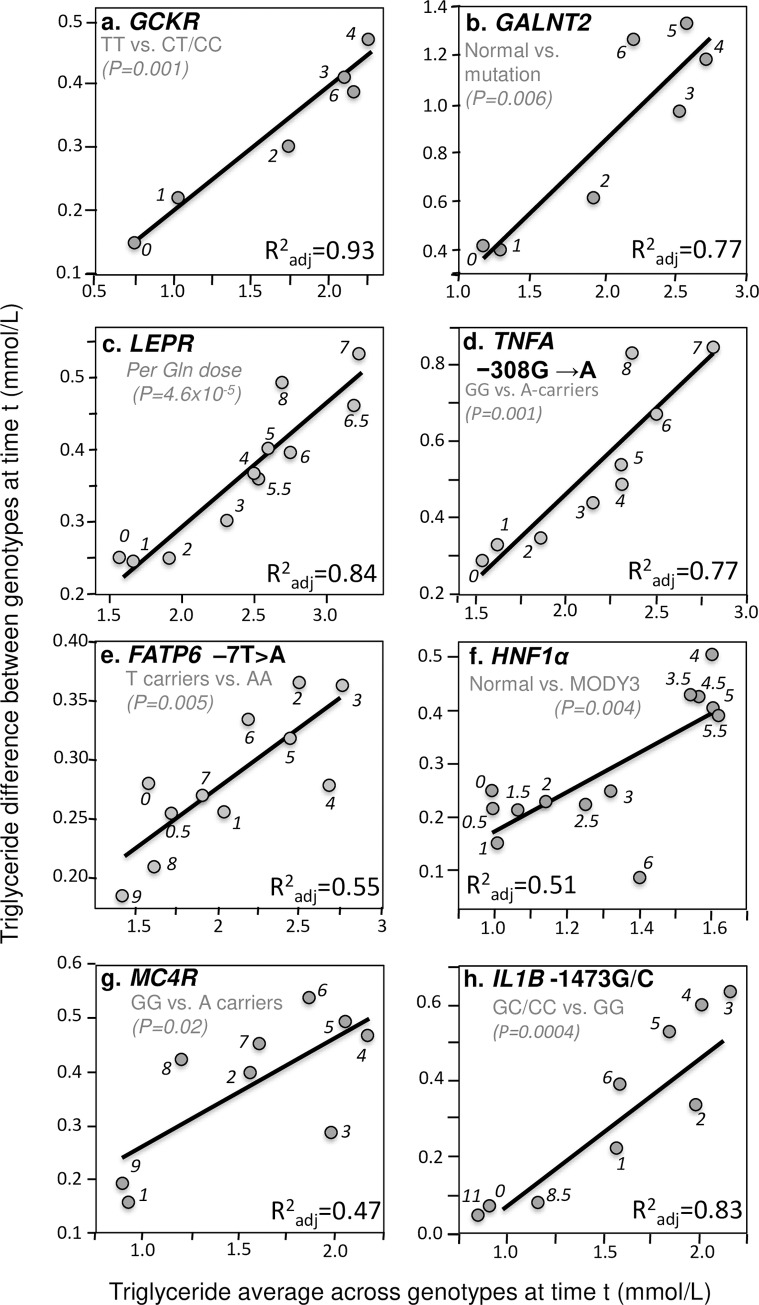
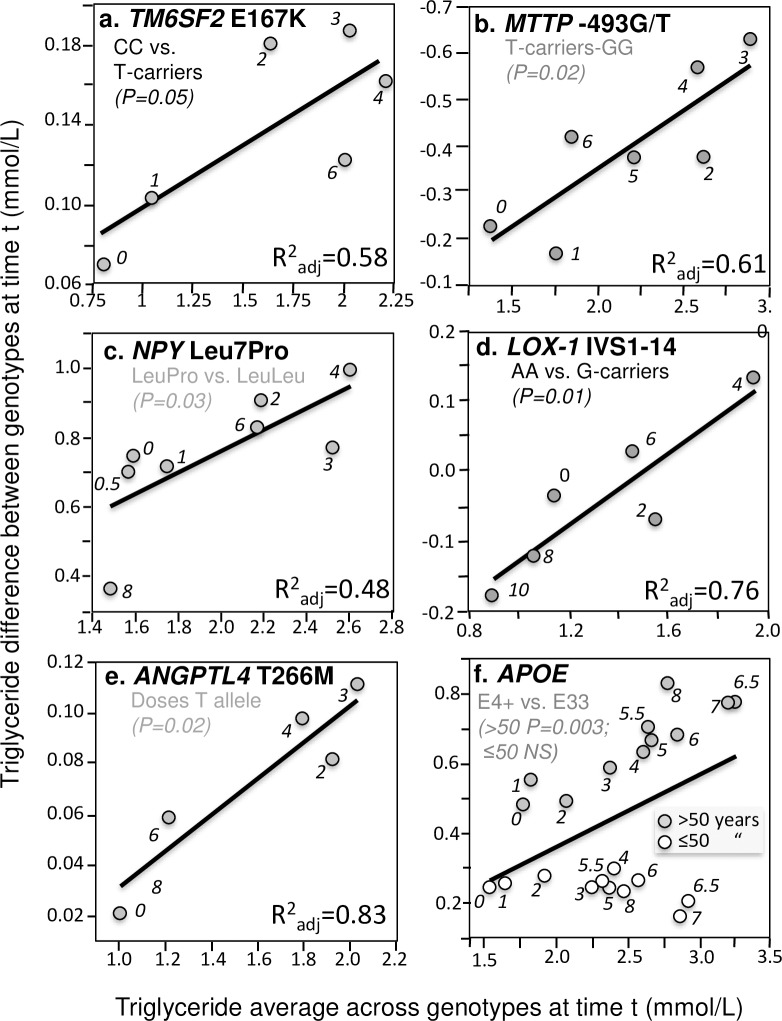
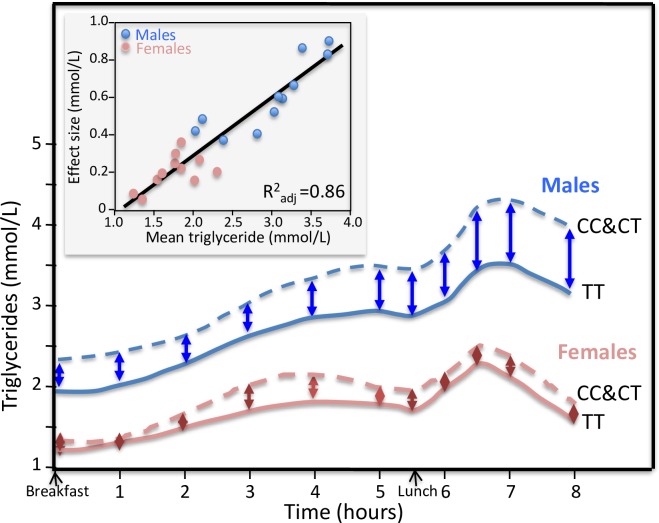
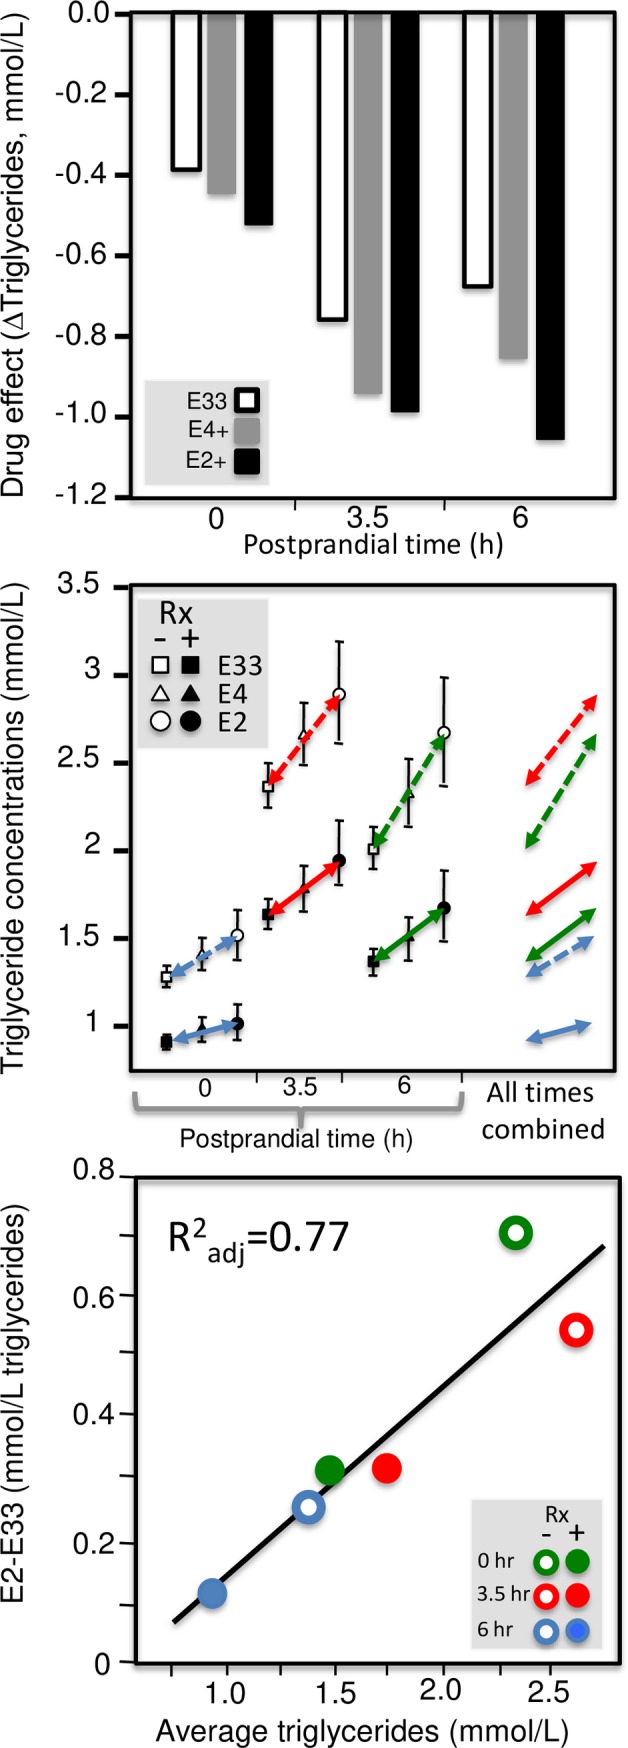
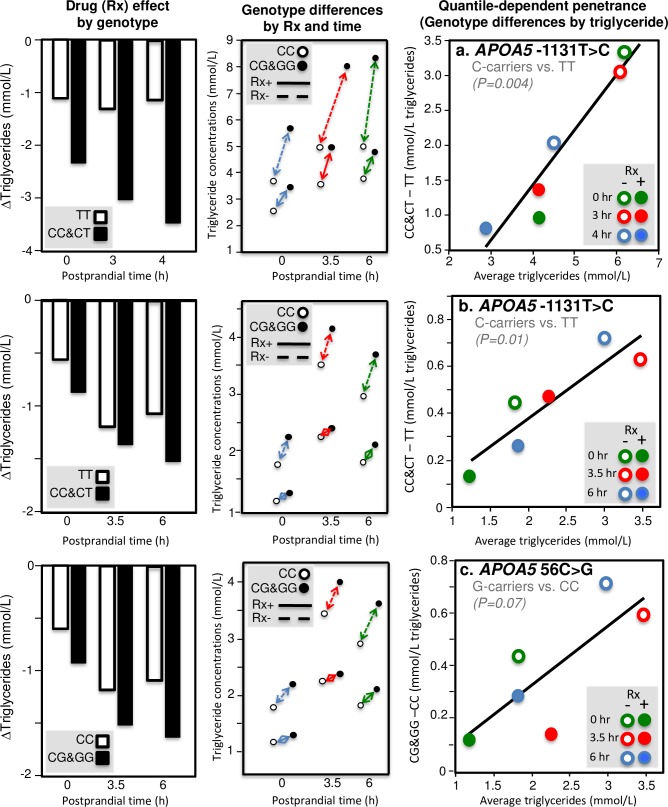
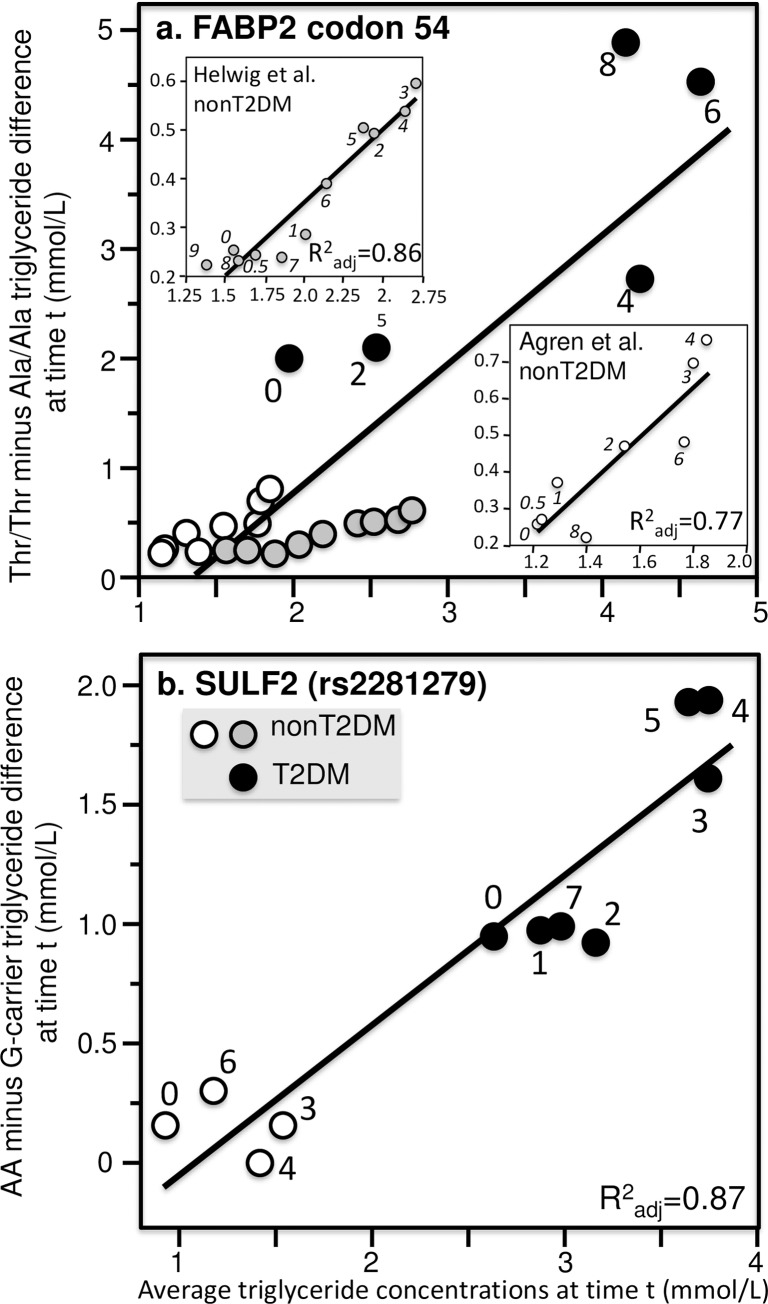
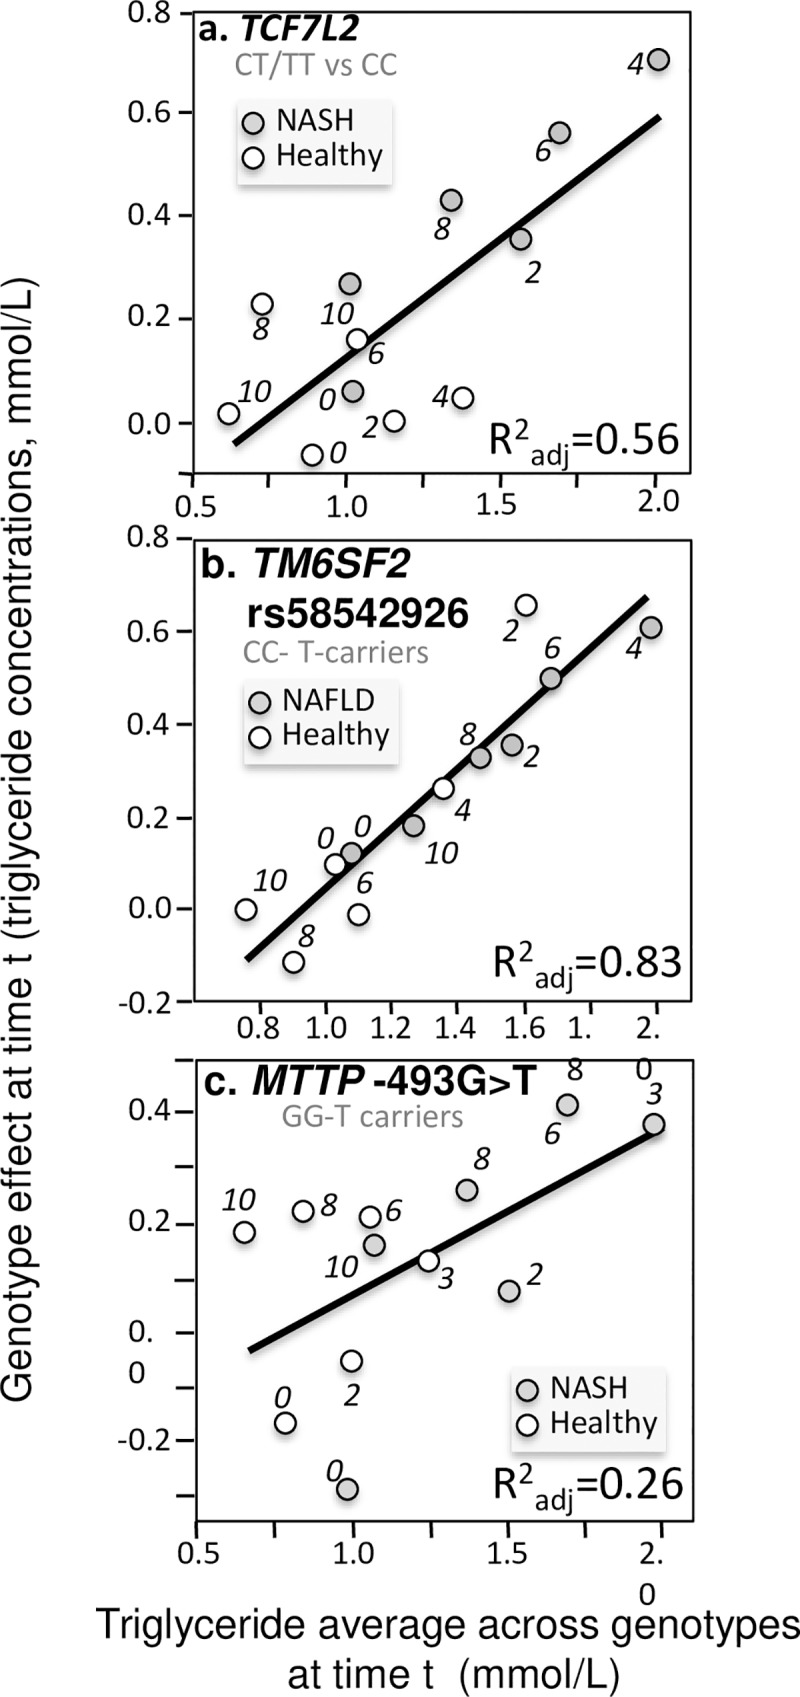
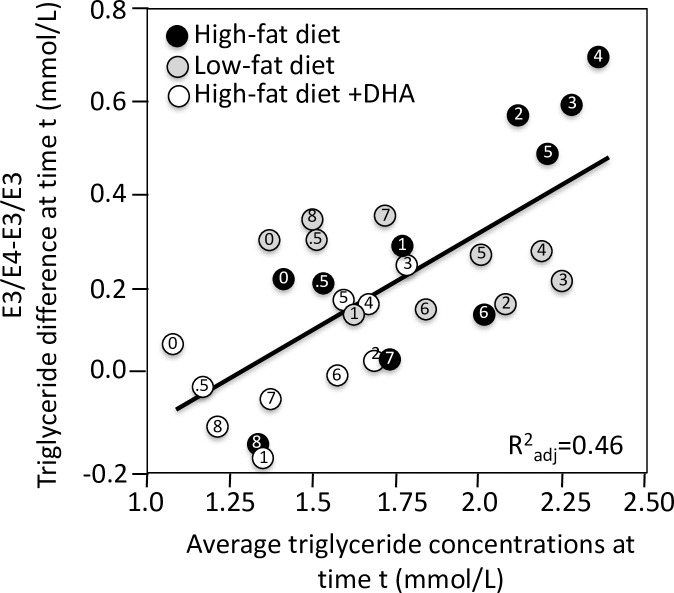
Purpose: "Quantile-dependent expressivity" describes an effect of the genotype that depends upon the level of the phenotype (e.g., whether a subject's triglycerides are high or low relative to its population distribution). Prior analyses suggest that the effect of a genetic risk score (GRS) on fasting plasma triglyceride levels increases with the percentile of the triglyceride distribution. Postprandial lipemia is well suited for testing quantile-dependent expressivity because it exposes each individual's genotype to substantial increases in their plasma triglyceride concentrations. Ninety-seven published papers were identified that plotted mean triglyceride response vs. time and genotype, which were converted into quantitative data. Separately, for each published graph, standard least-squares regression analysis was used to compare the genotype differences at time t (dependent variable) to average triglyceride concentrations at time t (independent variable) to assess whether the genetic effect size increased in association with higher triglyceride concentrations and whether the phenomenon could explain purported genetic interactions with sex, diet, disease, BMI, and drugs.

Results: Consistent with the phenomenon, genetic effect sizes increased (P≤0.05) with increasing triglyceride concentrations for polymorphisms associated with ABCA1, ANGPTL4, APOA1, APOA2, APOA4, APOA5, APOB, APOC3, APOE, CETP, FABP2, FATP6, GALNT2, GCKR, HL, IL1b, LEPR, LOX-1, LPL, MC4R, MTTP, NPY, SORT1, SULF2, TNFA, TCF7L2, and TM6SF2. The effect size for these polymorphisms showed a progressively increasing dose-response, with intermediate effect sizes at intermediate triglyceride concentrations. Quantile-dependent expressivity provided an alternative interpretation to their interactions with sex, drugs, disease, diet, and age, which have been traditionally ascribed to gene-environment interactions and genetic predictors of drug efficacy (i.e., personalized medicine).

Conclusion: Quantile-dependent expressivity applies to the majority of genetic variants affecting postprandial triglycerides, which may arise because the impaired functionalities of these variants increase at higher triglyceride concentrations. Purported gene-drug interactions may be the manifestations of quantile-dependent expressivity, rather than genetic predictors of drug efficacy.


Conflict of interest statement

The authors have declared that no competing interests exist.

Figures

Fig 1
Fig 1. Quantile-dependent expressivity plots for postprandial triglyceride responses by APOA2, HL, and LPL polymorphisms.
Panels (a) and (b) illustrate the methodology: (a) the re-rendering of the published triglyceride response to an oral fat tolerance test by APOA2 -265T/C genotypes (rs5082) [25], from which is produced: (b) its quantile-dependent expressivity plot showing the linear relationship between the genotype differences (dependent variable) vs. the average triglyceride values (independent variable) at each time point “t” and its significance level. The lower panels present quantile-dependent expressivity plots derived from figures by: (c) Reiber et al. for 27 H+/+ and H+/- vs. 5 H-/- patients for the LPL intron 8 HindIII polymorphism (rs320) [103]; (d) López-Miranda et al. for 26 H2S447 vs. 15 H1X447 haplotypes (rs328) [68]; (e) Humphries et al. for 70.4% H+S447 and 19.2% H-S447 vs. 10.4% H-X447 male haplotypes (rs328) [49]; (f) Pimstone et al. for three Asn291Ser mutations of the LPL gene vs. five controls (rs268) [99]; (g) Talmud et al. for 70 TT homozygotes vs. 25 G-allele carriers of the -93T/G polymorphism in the LPL promoter region (rs1800590) [117]; and (h) Gómez et al. for 26 CC, 22 CT, and 3 TT of the -514C/T polymorphism in the promoter region of the hepatic lipase (HL) gene (rs1800588) [40]. The numerical labels refer to time (“0” is fasting).
Fig 2
Fig 2. Quantile-dependent expressivity plots for postprandial triglyceride responses by APOE genotypes.
Quantile-dependent expressivity showing increasing genetic effect of apo E4- and E2-carriers vs. E33 homozygotes with increasing average triglyceride levels. Data estimated from the published excursion plots from 10,876 measurements in E33, 4682 measurements in E4-carriers, and 2311 measurements in E2-carriers. Point source coded as follows: a) Bergeron et al. [7], b) Boerwinkle et al. [9], c) Brown et al. [11], d) Carvalho-Wells et al. [18], e) Dallongeville et al. [22], f) Dart et al. [23], g) Erkkila et al. at 8 weeks [30], h) Erkkilä et al. at baseline [30], i) Ferreira et al. for intensive training [32], j) Ferreira et al. for moderate training [32], k) Ferreira et al. for sedentary activity [32], l) Irvin et al. post-treatment [51], m) Irvin et al. pre-treatment [51], n) Kobayashi et al. [60], o) Nikkilä et al. cases [85], p) Nikkilä et al. controls [85], q) Reiber et al. [103], r) Reznik et al. [104], s) Vansant et al. [122], and t) Wolever et al. [129].
Fig 3
Fig 3. Quantile-dependent expressivity plots for postprandial triglyceride responses by APOA4, APOA5, and APOC3 polymorphisms.
Derived from the postprandial response figures published by: (a) Zemánková et al. for ten heterozygotes (seven -1131T->C and three 56C>G heterozygotes, rs662799 and rs3135506, respectively) vs. 20 wild type carriers of the APOA5 gene [131]; (b) Moreno et al. for 12 C-allele carriers vs. 39 TT patients for the -1131T>C polymorphism of the APOA5 promoter region (rs662799) [79]; (c) Moreno-Luna et al. for 65 patients with the haplotype defined by homozygous for the major alleles of -1131T>C (rs662799), c.-3A>G (rs651821), c56C>G (rs3135506), IVS3+476G>A (rs2072560) and c.1259T>C (rs2266788) vs. 21 others [80]; (d) Delgado-Lista et al. for 30 TT, 42 TC and 16 CC genotypes from the intergenic region between APOA4 and APOA5 (rs1263177) [27]; (e) Saleheen et al. for seven normal vs. six APOC3 loss of function homozygotes (rs76353203) [108]; (f) Pollin et al. for 763 CC vs. 39 CT for the R19X mutation of the APOC3 gene (rs76353203) [100]; (g) Waterworth et al. for 284 TT, 348 TG, and 85GG patients for the T-2854G polymorphism (rs1263177) within the APOC3-APOA4 intergenic region [126]; and (h) Woo et al. for 18 GG vs. 42 T-carriers for this polymorphism within the APOC3-APOA4 intergenic region [130].
Fig 4
Fig 4. Quantile-dependent expressivity plots for postprandial triglyceride responses by APOA4, APOB, and SORT1 polymorphisms.
Derived from the postprandial response figures published by: (a) Vimaleswaran et al. for 52 del/del, 70 del/ins, and 25 ins/ins patients for the APOB insertion/deletion (ins/del) polymorphism (rs17240441) [124]; (b) Lopez-Miranda et al. for 31 carriers of the X+ allele vs. 20 X- homozygotes for the XbaI restriction site adjacent to APOB (rs693) [67]; (c) Hooper et al. for 10 normolipidemic controls vs. six heterozygous (three apoB-6.9, one apoB-25.8, and two apoB-40.3) familial hypobetalipoproteinemia (FHBL) patients [47]; (d) Hooper et al. for 10 healthy controls v. three heterogeneous APOB L343V mutations for FHBL [48]; (e) Noto et al. for six healthy controls vs. four heterogeneous APOB R463W mutations [86]; (f) Connors et al. for 15 TT homozygotes vs. 15 C-allele carriers for rs646776 variant of the 1p13 locus (near SORT1) [20]; (g) Hockey et al. for 14 A-IV-2 heterozygous vs. 14 A-IV-1 homozygous and for the APOA4 Q360H polymorphism (rs5110) [45]; and (h) Ostos et al. for 36 Thr/Thr homozygote vs. 14 Ser-allele carriers for the APOA4 347Ser polymorphism [91].
Fig 5
Fig 5. Quantile-dependent expressivity plots for postprandial triglyceride responses by ABCA1, APOA1, CETP, and TCF7L2 polymorphisms.
Derived from the postprandial response figures published by: (a) Calabresi et al. for 6 heterozygous apo A-IMilano vs. 6 matched controls [13]; (b) Delgado-Lista et al. for 32 GA vs. 9 AA genotypes for the -2803G/A polymorphisn in the APOA1 promoter region (rs2727784) [27]; (c) Gudnason et al. for 60 I/I, 55 I/V, and 27 V/V men for the I405V CETP polymorphism in men homozygous for the TaqIB B2 allele (rs5882) [42]; (d) Inazu et al. for 10 normal vs. 4 CETP deficient patients (mutations of intron 14(+1) G-to-A (14A) and D442G) [50]; (e) Kolovou et al. for five Tangier disease patients (3 homozygotes, 2 heterozygotes) vs. 25 normal male controls [61]; (f) Delgado-Lista et al. for 65 T-carriers vs. 23 CC homozygotes for the i48168 variant of the ABCA1 gene (rs4149272) [26]; (g) Delgado-Lista et al. for 67 A-allele carriers vs. 15 GG homozygotes vs. for the i27943 variant (rs2575875) of the ABCA1 gene [26]; and (h) Engelbrechtsen et al. for 31 CC vs. 31 TT homozygotes of the TCF7L2 polymorphism (rs7903146) [29].
Fig 6
Fig 6. Quantile-dependent expressivity plots for postprandial triglycerides by GALNT2, GCKR, lL1B, LEPR, MC4R and TNFA polymorphisms.
Derived from the postprandial response figures published by: (a) Shen et al. in 80 TT homozygotes vs. 690 carriers of the C allele of the P446L polymorphism in the GCKR gene (rs1260326) [112]; (b) Holleboom et al. for 4 normal and 4 patients with c.941A>C, p.D314A mutations in the GALNT2 gene [46]; (c) Jackson et al. for 71 patients with zero, 122 with one, and 38 patients with two doses of the Gln allele for the Gln223Arg polymorphism (rs1137101) in the common leptin receptor (LEPR) gene [52]; (d) Jackson et al. for 64 carriers of the A allele vs. 162 GG homozygotes for the TNFA −308 G/A polymorphism (rs1800629) [54]; (e) Auinger et al. 583 T carriers vs. 102 AA homozygotes for the FATP6 –7T>A polymorphism (rs2526246) [6]; (f) St-Jean et al. for 9 normal vs. 5 genotypically confirmed Mature Onset Diabetes of the Young type 3 (MODY3) patients (two C.872insC and three P.arg159trp patients) [115]; (g) Perez-Martinez et al. for 53 GG homozygotes vs. 35 A-carriers for rs12970134 polymorphism near the MC4R gene [97], and (h) Delgado-Lista et al. for 43 carriers of the C allele vs. 45 GG homozygotes of the -1473G/C polymorphism (rs1143623) in the lL1B promoter region [28].
Fig 7
Fig 7. Quantile-dependent expressivity plots for postprandial triglycerides by ANGPTL4, APOE, LOX-1, MTTP, NPY, and TM6SF2 polymorphisms.
Derived from the postprandial response figures published by: (a) O’Hare et al. for 853 CC homozygotes vs.130 T-carriers for the TM6SF2 loss-of-function variant (rs58542926) [87]; (b) Lundahl et al. for 24 GG homozygote vs. 36 carriers of the T-allele of the -493G/T polymorphism of the microsomal triglyceride transfer protein (MTTP, rs1800591) (P = 0.02) [69]; (c) Schwab et al. for 7 LeuPro heterozygotes vs. 7 LeuLeu homozygotes for the Leu7Pro polymorphism of the neuropeptide Y (NPY, rs16139) gene [109]; (d) Musso et al. for 26 AA homozygotes vs. 54 G-carriers of the lectin-like oxidized LDL receptor-1 (LOX-1) IVS4-14 A/G polymorphism in the pooled sample of NASH and healthy control patients [82]; (e) Talmud et al. for 1355 TT, 1108 TM, and 262 MM genotypes of ANGPTL4 T266M (rs1044250) [118]; (f) Carvalho-Wells et al. for 143 E33 and 64 E4 carriers verifying their different postprandial response by age when matched for average triglyceride concentrations [18].
Fig 8
Fig 8. Sex-specific postprandial triglyceride responses in C-carrier vs. TT homozygotes of the APOA5–1131 T>C polymorphism.
Re-rendering of the sex-specific postprandial triglyceride response published by Olano-Martin et al. [88]. The insert presents the quantile-dependent expressivity plot showing that males and females represent largely nonoverlapping triglyceride concentrations over which higher mean triglyceride concentrations predict increasing larger effect size between the C-carriers and TT homozygotes (P = 3.9x10⁻¹⁰).
Fig 9
Fig 9. Quantile-dependent expressivity plots for pre- and post-fenofibrate treated postprandial triglyceride responses by APOE genotypes.
Using data presented by Irvin et al. [51]: pre vs. post fenofibrate treated triglyceride concentrations by genotype (upper panel); genotype-specific mean triglyceride concentrations by treatment and genotype by time since meal (middle panel); quantile-dependent expressivity plot of the E2-E33 effect size vs. average triglyceride concentrations (bottom panel), suggesting the effect size is largely attributable to its relationship to mean triglyceride concentrations.
Fig 10
Fig 10. Quantile-dependent expressivity plots for pre- and post-fenofibrate treated postprandial triglyceride responses by APOA5 genotypes.
Derived from data presented by Cardona et al. for the -1131T>C of the APOA5 gene (top row) [16] and Lai et al. for the -1131T>C (middle row) and 56C>G polymorphisms (bottom row) of the APOA5 gene [63]. Left column presents pre vs. post fenofibrate treated triglyceride concentrations by genotype; center column present genotype-specific mean triglyceride concentrations by treatment and genotype by time since meal, and right column present quantile-dependent expressivity plot of the genetic effect size vs. average triglyceride concentrations, suggesting the effect sizes are largely attributable to their relationship to overall mean triglyceride concentrations.
Fig 11
Fig 11. Quantile-dependent expressivity plots for postprandial triglyceride responses by FABP2 and SULF2 polymorphisms.
(a) Derived from the postprandial response figures published by Helwig et al. for 360 AlaAla, 287 AlaThr, and 53 ThrThr nondiabetic patients [44] (shaded circles, P = 2.2x10⁻⁵), Agren et al. for 7 AlaAla and 8 ThrThr nondiabetic patients [4] (open circles, P = 0.003), and Georgopoulos et al. for 9 T2DM AlaAla and 6 T2DM ThrThr (P = 0.10) [37] of the codon 54 polymorphism of the FABP2 gene (solid black circles rs1799883). Significance of the combined data: P = 8.1x10⁻⁸. (b) Matikainen et al. for 22 AA and 46 carriers of the G allele in nondiabetics (P = 0.54) [74] and Hassing et al. for 11 AA and 18 carriers of the G-allele in T2DM (P = 0.007) of the SULF2 rs2281279 polymorphism [43] (combined data: P = 6.3x10⁻⁶).
Fig 12
Fig 12. Quantile-dependent expressivity plots for postprandial triglyceride responses by TCF7L2, TM6SF2, and MTTP polymorphisms.
Derived from the postprandial responses in NAFLD and non-NAFLD patients published by: a) Musso et al. for 38 T-carriers vs. 30 CC homozygotes of the rs7903146 polymorphism in the TCF7L2 gene (P = 0.003) [81]; b) Musso et al. for 853 CC homozygotes vs. 130 T-carriers for the TM6SF2 loss-of-function variant (rs58542926, P = 2.5x10⁻⁵) [83]; c) Gambino et al. for 32 GG homozygotes vs. 24 T-carriers for the -493 G/T polymorphism in the MTTP gene (P = 0.05) [35].
Fig 13
Fig 13. Quantile-dependent expressivity plots for postprandial triglyceride responses by APOE polymorphisms and diet.
Derived from the postprandial response figures published by Jackson et al. for differences between 11 APOE E34 vs. 12 E33 men on low-fat diet; high saturated-fat diet; and high saturated-fat diet with fish oil [53].

Similar articles

Cited by

References

    1. Roche HM, Gibney MJ. Postprandial triacylglycerolaemia: nutritional implications. Prog Lipid Res. 1995;34:249–266. 10.1016/0163-7827(95)00012-o - DOI - PubMed
    1. Zilversmit DB. Atherogenesis: A postprandial phenomenon. Circulation. 1979;60:473–485 10.1161/01.cir.60.3.473 - DOI - PubMed
    1. Williams PT. Quantile-specific expressivity of genes affecting lipoproteins, adiposity and height. PLoS One. 2012;7:e28764 10.1371/journal.pone.0028764 - DOI - PMC - PubMed
    1. Agren JJ, Valve R, Vidgren H, Laakso M, Uusitupa M. Postprandial lipemic response is modified by the polymorphism at codon 54 of the fatty acid-binding protein 2 gene. Arterioscler Thromb Vasc Biol. 1998;18:1606–1610. 10.1161/01.atv.18.10.1606 - DOI - PubMed
    1. Anagnostopoulou KK, Kolovou GD, Kostakou PM, Mihas C, Hatzigeorgiou G, Marvaki C, et al. Sex-associated effect of CETP and LPL polymorphisms on postprandial lipids in familial hypercholesterolaemia. Lipids Health Dis. 2009:8:24 10.1186/1476-511X-8-24 - DOI - PMC - PubMed

MeSH terms