. 2020 Apr 8;27(4):659-670.e5.
doi: 10.1016/j.chom.2020.01.021. Epub 2020 Feb 25.

Dysbiosis-Induced Secondary Bile Acid Deficiency Promotes Intestinal Inflammation

Affiliations

Dysbiosis-Induced Secondary Bile Acid Deficiency Promotes Intestinal Inflammation

Sidhartha R Sinha et al. Cell Host Microbe. .

Abstract

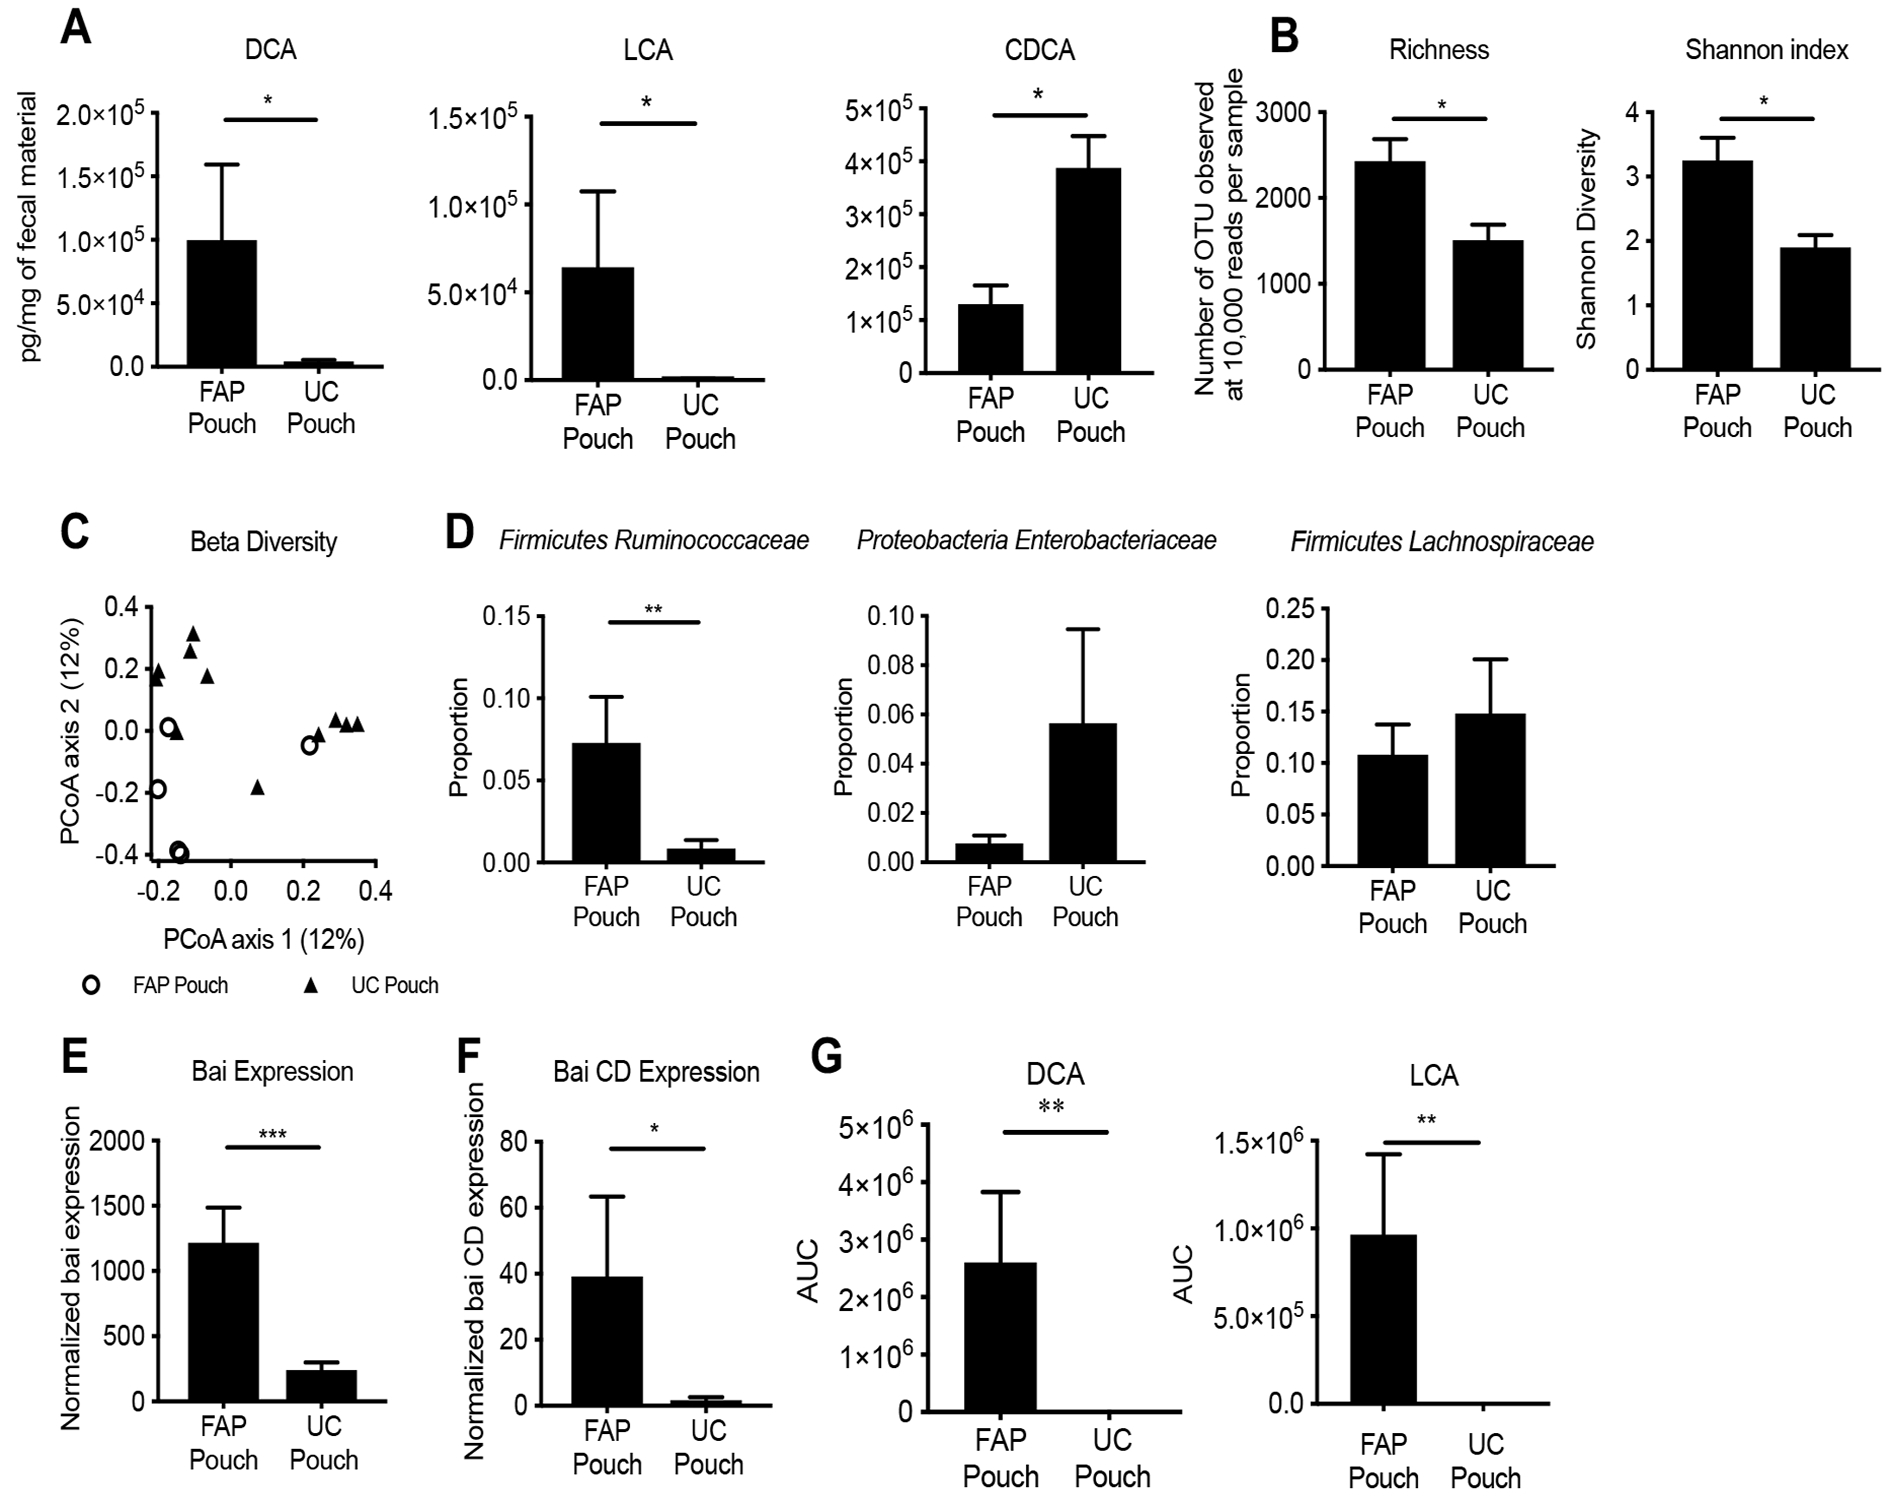
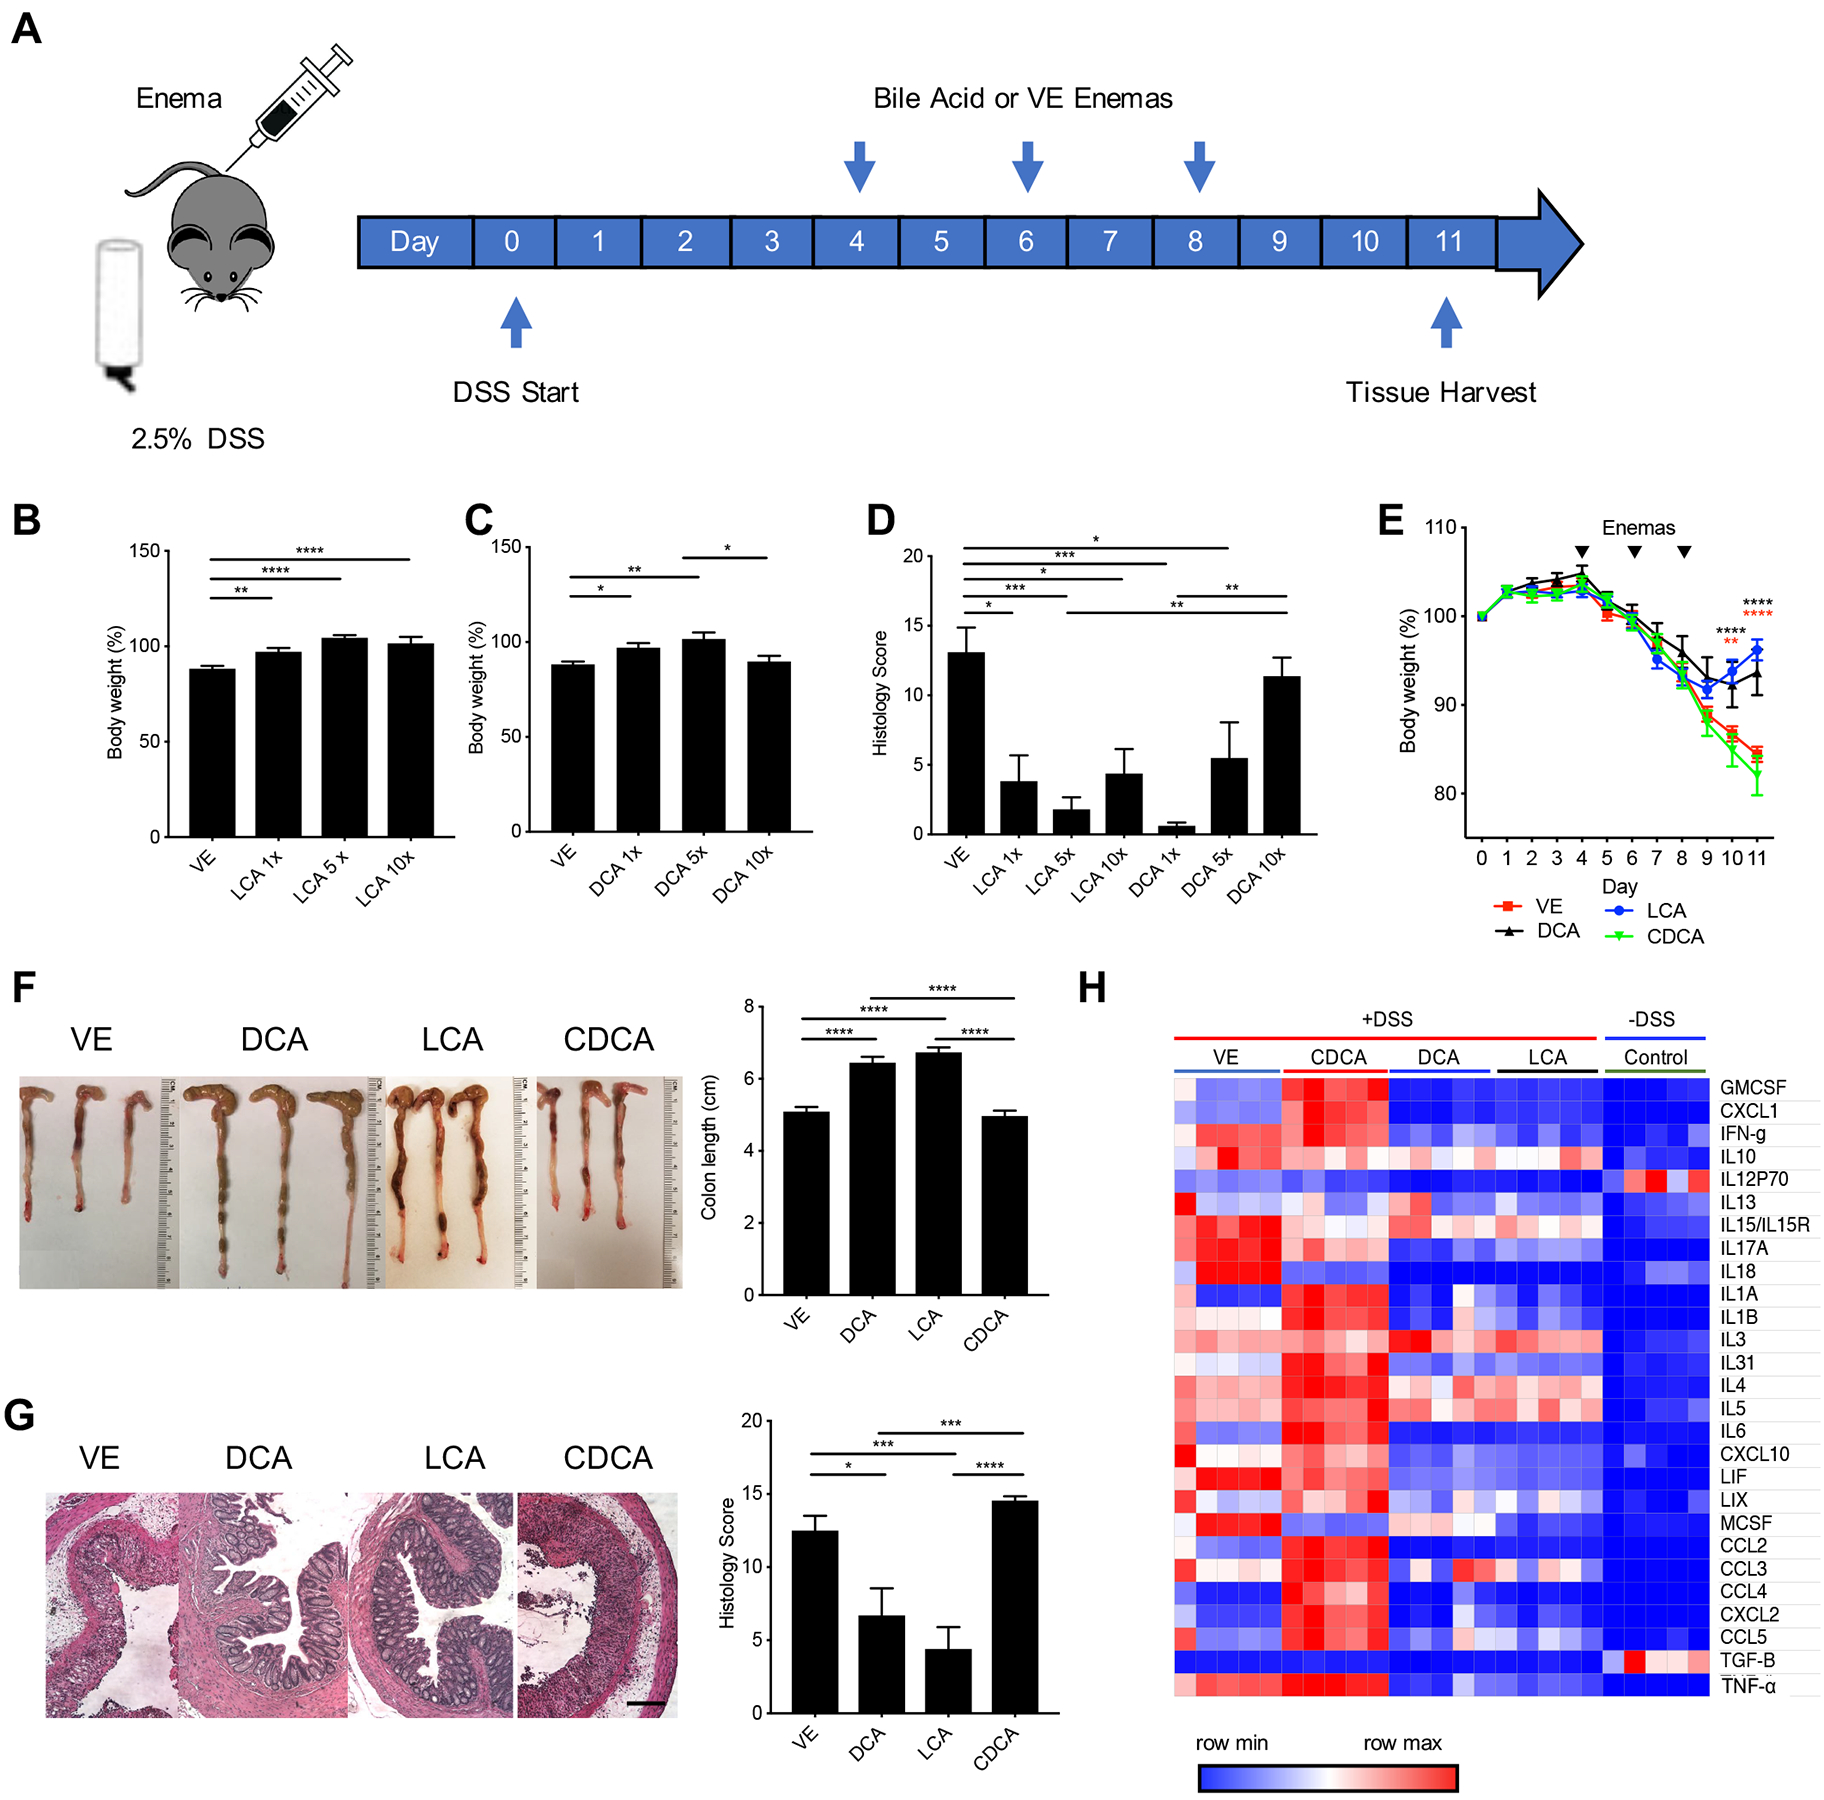
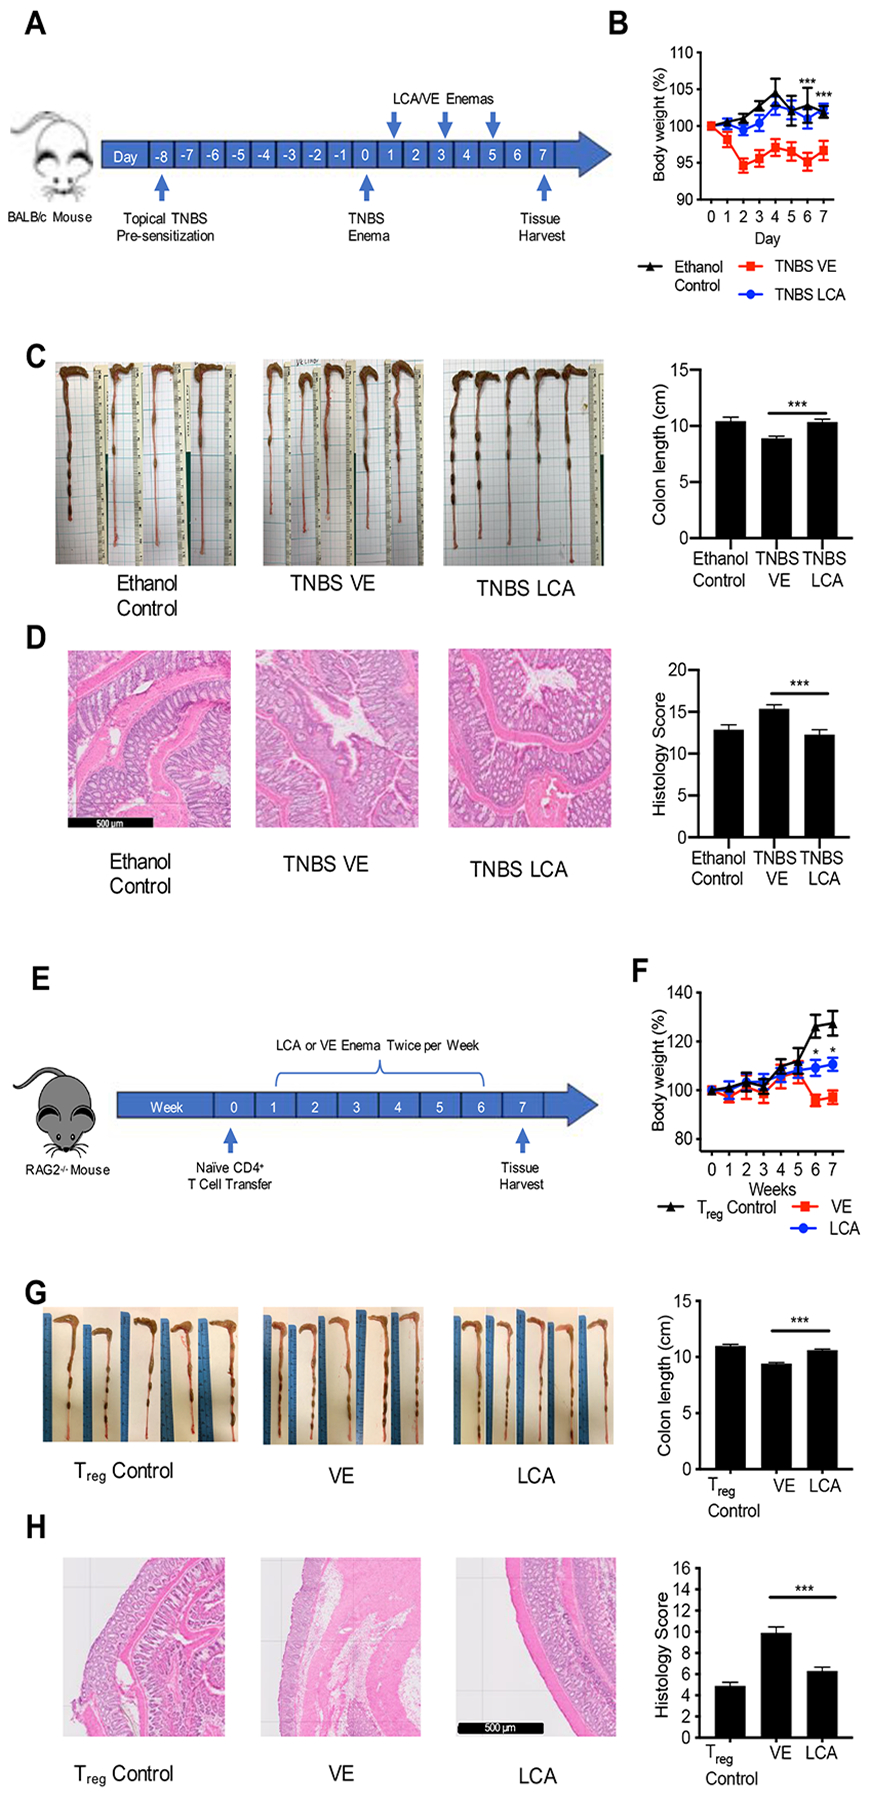
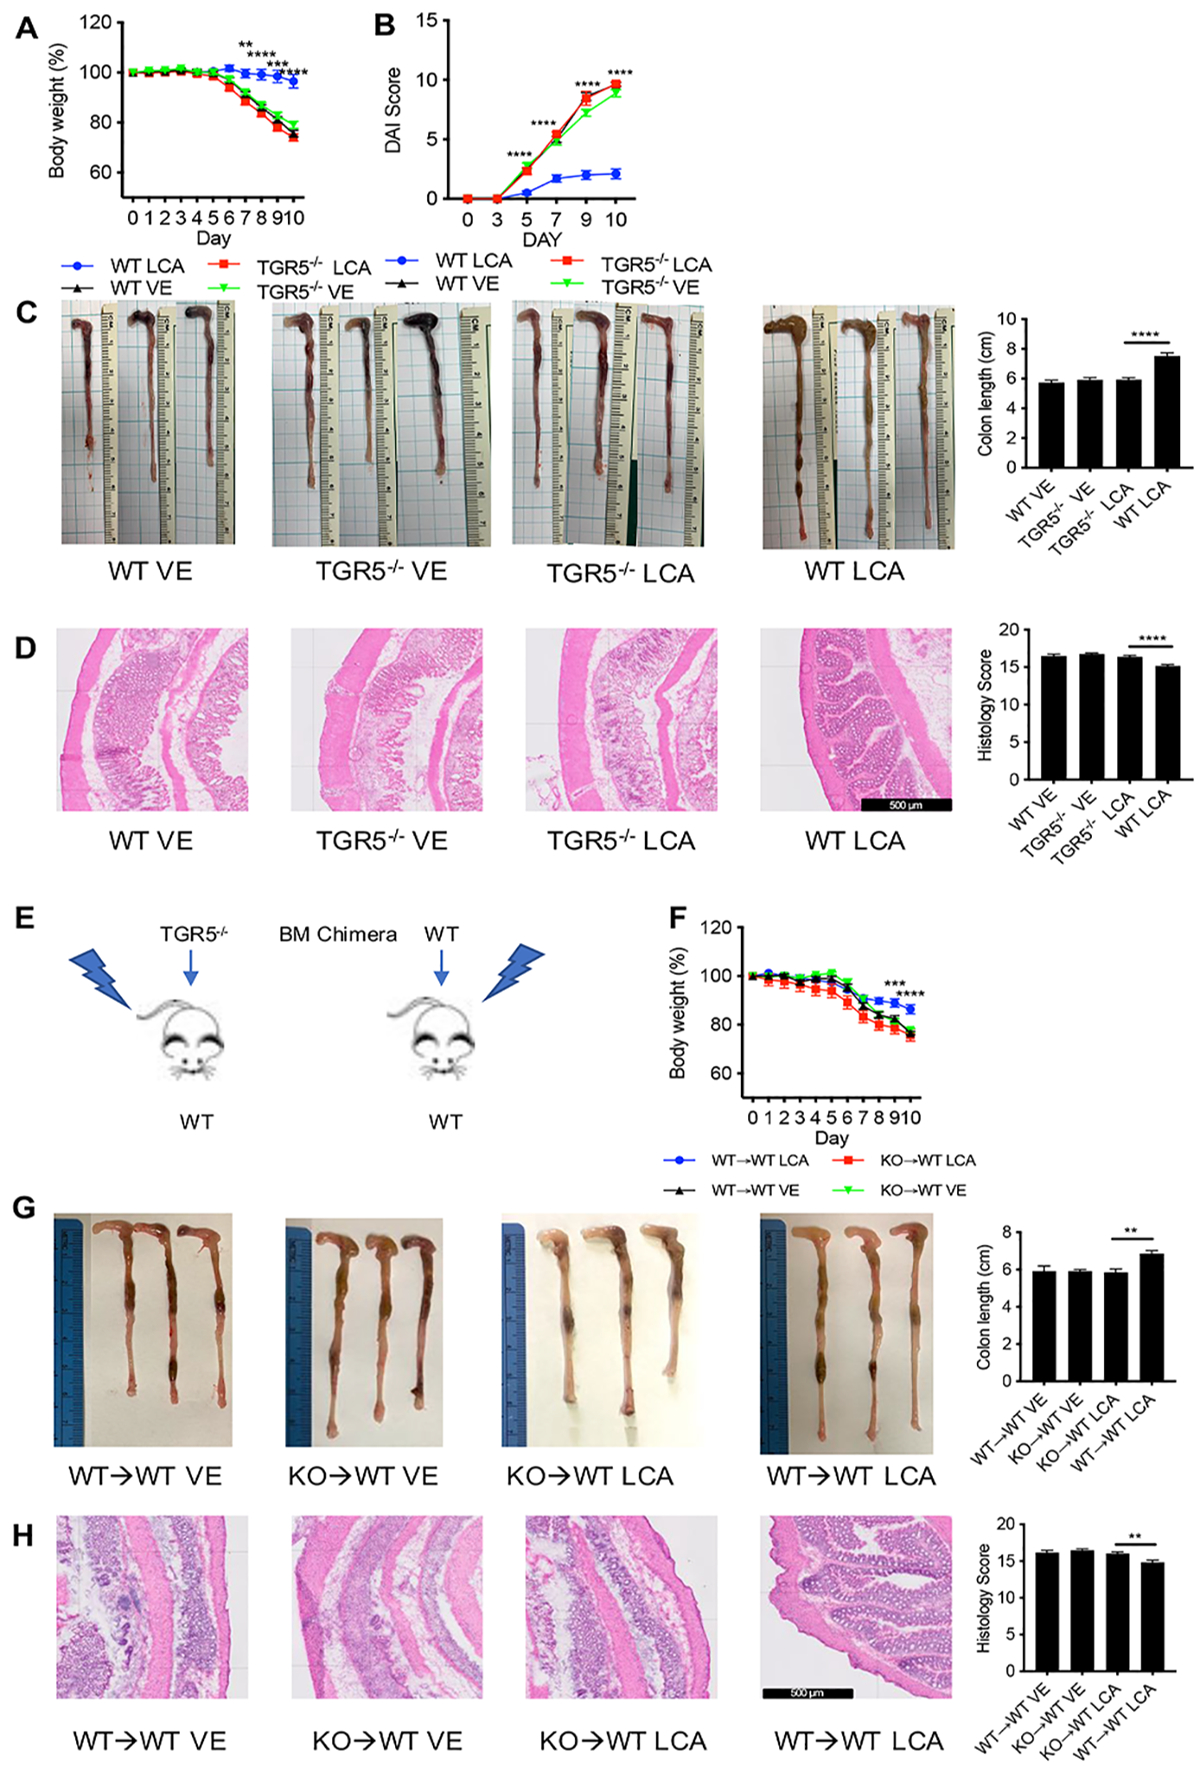
Secondary bile acids (SBAs) are derived from primary bile acids (PBAs) in a process reliant on biosynthetic capabilities possessed by few microbes. To evaluate the role of BAs in intestinal inflammation, we performed metabolomic, microbiome, metagenomic, and transcriptomic profiling of stool from ileal pouches (surgically created resevoirs) in colectomy-treated patients with ulcerative colitis (UC) versus controls (familial adenomatous polyposis [FAP]). We show that relative to FAP, UC pouches have reduced levels of lithocholic acid and deoxycholic acid (normally the most abundant gut SBAs), genes required to convert PBAs to SBAs, and Ruminococcaceae (one of few taxa known to include SBA-producing bacteria). In three murine colitis models, SBA supplementation reduces intestinal inflammation. This anti-inflammatory effect is in part dependent on the TGR5 bile acid receptor. These data suggest that dysbiosis induces SBA deficiency in inflammatory-prone UC patients, which promotes a pro-inflammatory state within the intestine that may be treated by SBA restoration.

Keywords: bile acids; colitis; dysbiosis; inflammatory bowel disease; metabolomics; pouchitis; ulcerative colitis.


Conflict of interest statement

Declaration of Interests All authors declare no competing interests.

Figures

Figure 1.
Figure 1.. UC pouch stool has diminished secondary bile acids and altered microbial composition, which is associated with lower expression of bai genes, and less efficiency to convert primary bile acid to secondary bile acid in vitro than FAP pouch
(A) Levels of DCA and LCA are significantly lower in UC versus FAP pouches, whereas CDCA is significantly higher measured by LC-MS. (B) Total bacterial species present (at 10,000 reads per sample) show reduced richness and Shannon diversity in UC pouch microbiota. (C) Bray-Curtis distances to assess β-diversity at community level differences between UC pouch and FAP pouch, as measured by PERMANOVA test. (D) Relative proportions of most abundant species revealed reduced taxon abundance of Firmicutes Ruminococcaceae in UC compared to FAP pouches. (E) Bai A-K gene transcription (established by RNA-Seq) is lower in UC pouches compared to FAP pouches. (F) Bai CD gene expression, a key enzyme in SBA biosynthesis, is also lower in UC pouches compared to FAP pouches. (G) The stool from UC pouch was less efficient in converting exogenous CA and CDCA to DCA and LCA respectively than FAP pouch. Data represented as mean ± SEM. (A) UC pouch n=17, FAP pouch n=7, * P<.05, two-tailed t-test, post multiple t-test with Benjamini and Hochberg posttest correction, (B) UC pouch n=11, FAP pouch n=5; * P<.05, two-tailed t-test, (C) UC pouch n=11, FAP pouch n=5, Permanova test, R2=.093, (D) UC pouch n=11, FAP pouch n=5, ** P<.01, two-tailed t-test, (E) UC pouch n=7, FAP pouch n=3, *** P<0.001, two-tailed t-test, (F) UC pouch n=7, FAP pouch n=3, * P<0.05, two-tailed t-test, (G) UC pouch n=17, FAP pouch n=7, ** P<.01, two-tailed t-test.
Figure 2.
Figure 2.. LCA and DCA ameliorate DSS-induced colitis
(A) C57BL/6 mice were given water containing 2.5% DSS (w/v) for 11 days and treated with suspension of bile acid or vehicle control (VE) per rectum on days 4, 6 and 8 with 150 μL of either 1 mg (1X), 5 mg (5X), or 10 mg (10X) of bile acid. LCA and DCA treatment result in dose-dependent protection, evident by an improvement in (B, C) body weight and (D) histopathology. LCA and DCA-treated mice maintained (E) higher body weights, (F) healthier gross colon morphology and longer colon lengths compared to VE or CDCA-treated mice. (G) LCA and DCA reduced distal colon inflammation and histopathology score. Scale bar = 20 m. (H) Luminex heat map data shows a decrease of pro-inflammatory associated cytokines in colon homogenate isolated from LCA and DCA-treated mice. Colon homogenate from mice untreated with DSS was used as a control. Data represented as mean ± SEM, analyzed by one-way ANOVA with Tukey’s post-hoc (B, C, D, F, G) or two-way ANOVA with Bonferroni’s post-hoc (E), and significance reported as * P<.05, ** P<.01, *** P<.001, and **** P<0.0001 (B) VE n=23, LCA 1X n=20, LCA 5x n=10, LCA 10x n=9, (C) VE n=23, DCA 1X n=17, DCA 5x n=9, DCA 10x n=9 (D) VE n=5, LCA 1X n=3, LCA 5x n=5, LCA 10x n=4, DCA 1X n=4, DCA 5x n=4, DCA 10x n=4, (E-F) VE, LCA, DCA n=14, CDCA n=13, (G) All groups n=10, (H) All groups n=5.
Figure 3.
Figure 3.. LCA ameliorates TNBS-induced colitis and CD45RBhi CD4+ T cell transfer colitis
(A) Mice were pre-sensitized with topical TNBS, and further sensitized with recto-transfer of TNBS. Suppository treatment of TNBS mice with LCA on day 1, 3 and 5 resulted in (B) higher body weight, (C) longer colon length and healthier gross colon morphology, and (D) reduced distal colon inflammation and histopathology score. (E) Naïve T cells were transferred into RAG2−/− mice. The control group received Treg cells intravenous injection. Beginning at week 1, the naïve T cell mice were treated with LCA or VE suppository twice per week for 6 weeks. LCA treatment maintained (F) higher body weight, (G) longer colon lengths, and healthier gross colon morphology. (H) LCA reduced distal colon inflammation and histopathology score. Scale bar = 500 m. Data represented as mean ± SEM, analyzed by two-way ANOVA with Bonferroni’s post-hoc (B, F) or one-way ANOVA with Tukey’s post-hoc (C, D, G, H). and significance reported as * P<.05, ** P<.01, *** P<.001, and **** P<0.0001. (B) (B) TNBS VE n=19, TNBS LCA n=19 Ethanol Control n= 8, (C) TNBS VE n=18, TNBS LCA n=17 Ethanol Control n= 8, (D) TNBS VE n=15, TNBS LCA n= 14 Ethanol Control n= 8, (F-H) VE n=5, LCA n=5, Treg control n=5.
Figure 4.
Figure 4.. The protective effect of LCA on DSS-induced colitis is lost in mice with TGR5 deficient immune cells
Treatment of TGR5−/− with LCA was not protective against (A) loss of body weight, (B) disease activity reflected by disease activity index (DAI), (C) shortening of colon length, and (D) inflammation and histopathology in DSS-induced colitis. (E) In chimeric mice generated by transplanting TGR5−/− (KO) bone marrow into lethally irradiate WT mice, 2.5% DSS resulted in (F) decreased body weight (G) shorter colon lengths, and (H) lower histology scores compared to mice receiving WT bone marrow grafts. Scale bar = 500 m. Data represented as mean ± SEM, analyzed by two-way ANOVA with Bonferroni’s post-hoc (A, B, and F) or one-way ANOVA with Tukey’s post-hoc (C, D, G, H). and significance reported as * P<.05, ** P<.01, *** P<.001, and **** P<0.0001. (A, C) WT VE n=15, TGR5−/− VE n=14, TGR5−/− LCA n=19, WT LCA n=19, (B) WT VE n=10, TGR5−/− VE n=9, TGR5−/− LCA n=9, WT LCA n=10, (D) WT VE n=10, TGR5−/− VE n=10, TGR5−/− LCA n=15, WT LCA n=15, (F-H) KO→WT VE n=6, WT→WT VE n=6, KO→WT LCA n=10, WT→WT LCA n=10.

Similar articles

Cited by

References

    1. ANDERS S & HUBER W 2010. Differential expression analysis for sequence count data. Genome Biol, 11, R106. - PMC - PubMed
    1. ANDERSON MJ 2001. A new method for non-parametric multivariate analysis of variance. Austral Ecology, 26, 32–46.
    1. BANKS C, BATEMAN A, PAYNE R, JOHNSON P & SHERON N 2003. Chemokine expression in IBD. Mucosal chemokine expression is unselectively increased in both ulcerative colitis and Crohn’s disease. J Pathol, 199, 28–35. - PubMed
    1. BEHR C, SPERBER S, JIANG X, STRAUSS V, KAMP H, WALK T, HEROLD M, BEEKMANN K, RIETJENS I & VAN RAVENZWAAY B 2018. Microbiome-related metabolite changes in gut tissue, cecum content and feces of rats treated with antibiotics. Toxicol Appl Pharmacol, 355, 198–210. - PubMed
    1. BUFFIE CG, BUCCI V, STEIN RR, MCKENNEY PT, LING L, GOBOURNE A, NO D, LIU H, KINNEBREW M, VIALE A, LITTMANN E, VAN DEN BRINK MR, JENQ RR, TAUR Y, SANDER C, CROSS JR, TOUSSAINT NC, XAVIER JB & PAMER EG 2015. Precision microbiome reconstitution restores bile acid mediated resistance to Clostridium difficile. Nature, 517, 205–8. - PMC - PubMed

Publication types

MeSH terms

Substances