

Coexistence of Lipid Phases Stabilizes Interstitial Water in the Outer Layer of Mammalian Skin
- PMID: 32101711
- PMCID: PMC7136285
- DOI: 10.1016/j.bpj.2020.01.044
Coexistence of Lipid Phases Stabilizes Interstitial Water in the Outer Layer of Mammalian Skin
Abstract
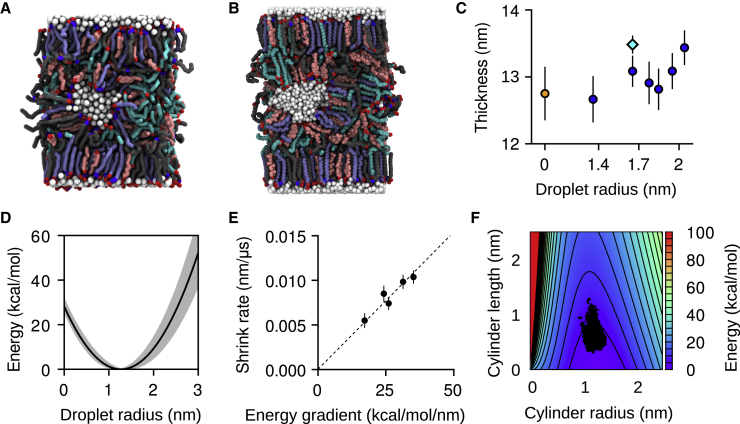
The lipid matrix in the outer layer of mammalian skin, the stratum corneum, has been previously investigated by multiple biophysical techniques aimed at identifying hydrophilic and lipophilic pathways of permeation. Although consensus is developing over the microscopic structure of the lipid matrix, no molecular-resolution model describes the permeability of all chemical species simultaneously. Using molecular dynamics simulations of a model mixture of skin lipids, the self-assembly of the lipid matrix lamellae has been studied. At higher humidity, the resulting lamellar phase is maintained by partitioning excess water into isolated droplets of controlled size and spatial distribution. The droplets may fuse together to form intralamellar water channels, thereby providing a pathway for the permeation of hydrophilic species. These results reconcile competing data on the outer skin's structure and broaden the scope of molecular-based methods to improve the safety of topical products and to advance transdermal drug delivery.
Copyright © 2020 Biophysical Society. Published by Elsevier Inc. All rights reserved.
Figures


Similar articles
-
Structure of the skin barrier and its modulation by vesicular formulations.Prog Lipid Res. 2003 Jan;42(1):1-36. doi: 10.1016/s0163-7827(02)00028-0. Prog Lipid Res. 2003. PMID: 12467638 Review.
-
Stratum corneum lipid matrix: Location of acyl ceramide and cholesterol in the unit cell of the long periodicity phase.Biochim Biophys Acta. 2016 Aug;1858(8):1926-34. doi: 10.1016/j.bbamem.2016.05.006. Epub 2016 May 8. Biochim Biophys Acta. 2016. PMID: 27169629
-
Effect of Chemical Permeation Enhancers on Skin Permeability: In silico screening using Molecular Dynamics simulations.Sci Rep. 2019 Feb 6;9(1):1456. doi: 10.1038/s41598-018-37900-0. Sci Rep. 2019. PMID: 30728438 Free PMC article.
-
Stratum corneum modulation by chemical enhancers and lipid nanostructures: implications for transdermal drug delivery.Ther Deliv. 2017 Jul;8(8):701-718. doi: 10.4155/tde-2017-0045. Ther Deliv. 2017. PMID: 28730938 Review.
-
Physical methods for studying stratum corneum lipids.Semin Dermatol. 1992 Jun;11(2):129-38. Semin Dermatol. 1992. PMID: 1498016 Review.
Cited by
-
Understanding Drug Skin Permeation Enhancers Using Molecular Dynamics Simulations.J Chem Inf Model. 2023 Aug 14;63(15):4900-4911. doi: 10.1021/acs.jcim.3c00625. Epub 2023 Jul 18. J Chem Inf Model. 2023. PMID: 37462219 Free PMC article.
-
Multiscale Simulation of Ternary Stratum Corneum Lipid Mixtures: Effects of Cholesterol Composition.Langmuir. 2022 Jun 21;38(24):7496-7511. doi: 10.1021/acs.langmuir.2c00471. Epub 2022 Jun 7. Langmuir. 2022. PMID: 35671175 Free PMC article.
-
Computational Methods for Modeling Lipid-Mediated Active Pharmaceutical Ingredient Delivery.Mol Pharm. 2025 Mar 3;22(3):1110-1141. doi: 10.1021/acs.molpharmaceut.4c00744. Epub 2025 Jan 29. Mol Pharm. 2025. PMID: 39879096 Free PMC article. Review.
-
Using molecular simulation to understand the skin barrier.Prog Lipid Res. 2022 Nov;88:101184. doi: 10.1016/j.plipres.2022.101184. Epub 2022 Aug 19. Prog Lipid Res. 2022. PMID: 35988796 Free PMC article. Review.
-
Skin permeability prediction with MD simulation sampling spatial and alchemical reaction coordinates.Biophys J. 2022 Oct 18;121(20):3837-3849. doi: 10.1016/j.bpj.2022.09.009. Epub 2022 Sep 13. Biophys J. 2022. PMID: 36104960 Free PMC article.
References
-
- Elias P.M. Stratum corneum defensive functions: an integrated view. J. Invest. Dermatol. 2005;125:183–200. - PubMed
-
- Hirvonen J., Kalia Y.N., Guy R.H. Transdermal delivery of peptides by iontophoresis. Nat. Biotechnol. 1996;14:1710–1713. - PubMed
-
- Caspers P.J., Lucassen G.W., Puppels G.J. In vivo confocal Raman microspectroscopy of the skin: noninvasive determination of molecular concentration profiles. J. Invest. Dermatol. 2001;116:434–442. - PubMed
-
- Wertz P.W., Swartzendruber D.C., Squier C.A. Regional variation in the structure and permeability of oral mucosa and skin. Adv. Drug Deliv. Rev. 1993;12:1–12.
Publication types
MeSH terms
Substances
LinkOut - more resources
Full Text Sources
