. 2020 Feb 25;30(8):2540-2554.e4.
doi: 10.1016/j.celrep.2020.01.095.

Predicting Successful Generation and Inhibition of Seizure-like Afterdischarges and Mapping Their Seizure Networks Using fMRI

Affiliations

Predicting Successful Generation and Inhibition of Seizure-like Afterdischarges and Mapping Their Seizure Networks Using fMRI

Ben A Duffy et al. Cell Rep. .

Abstract

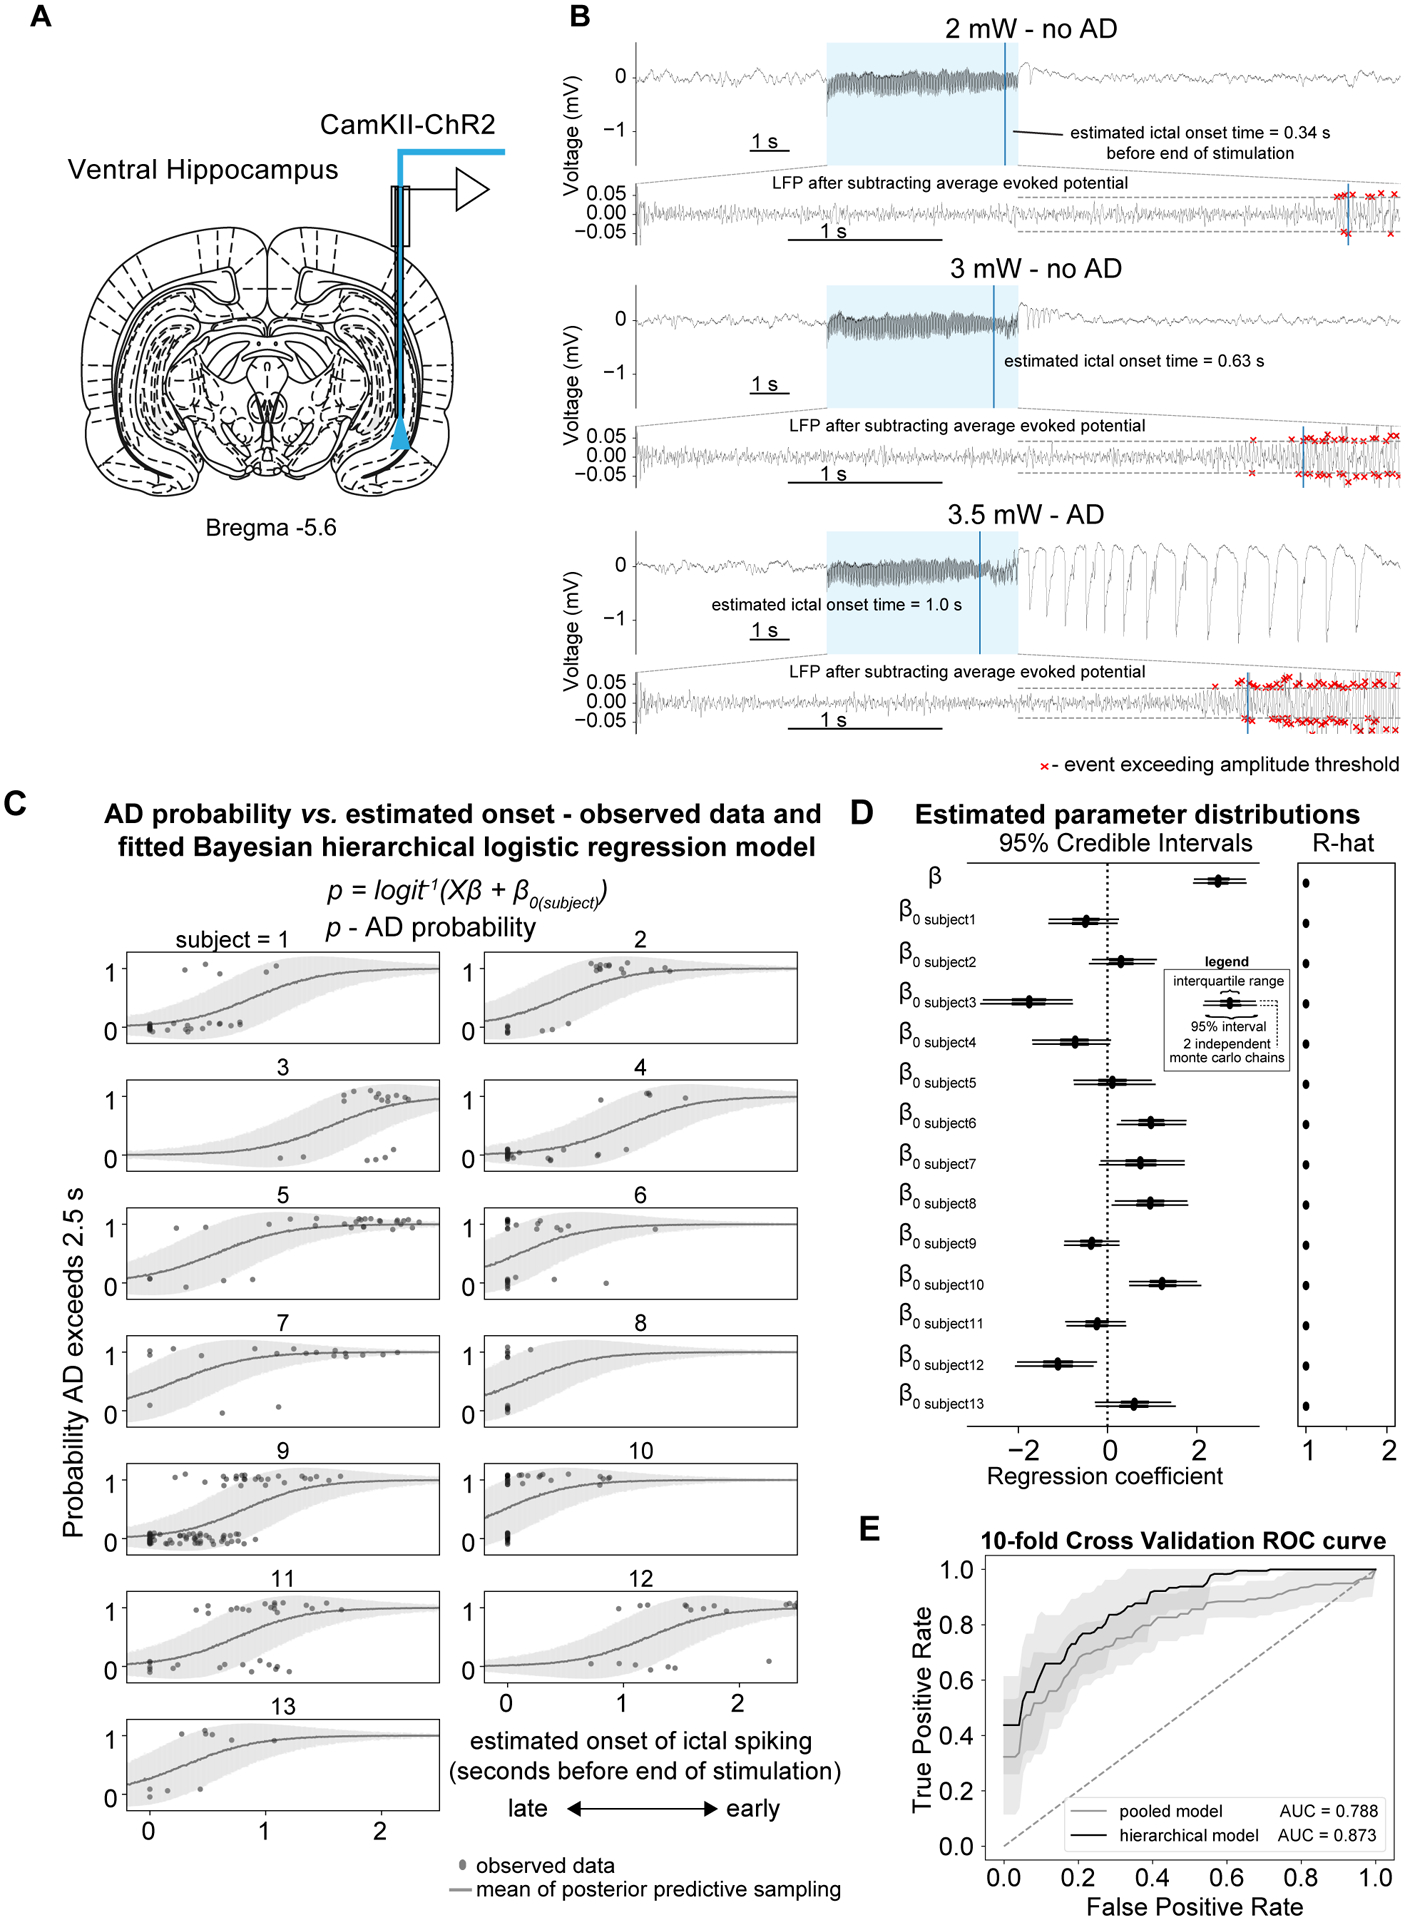
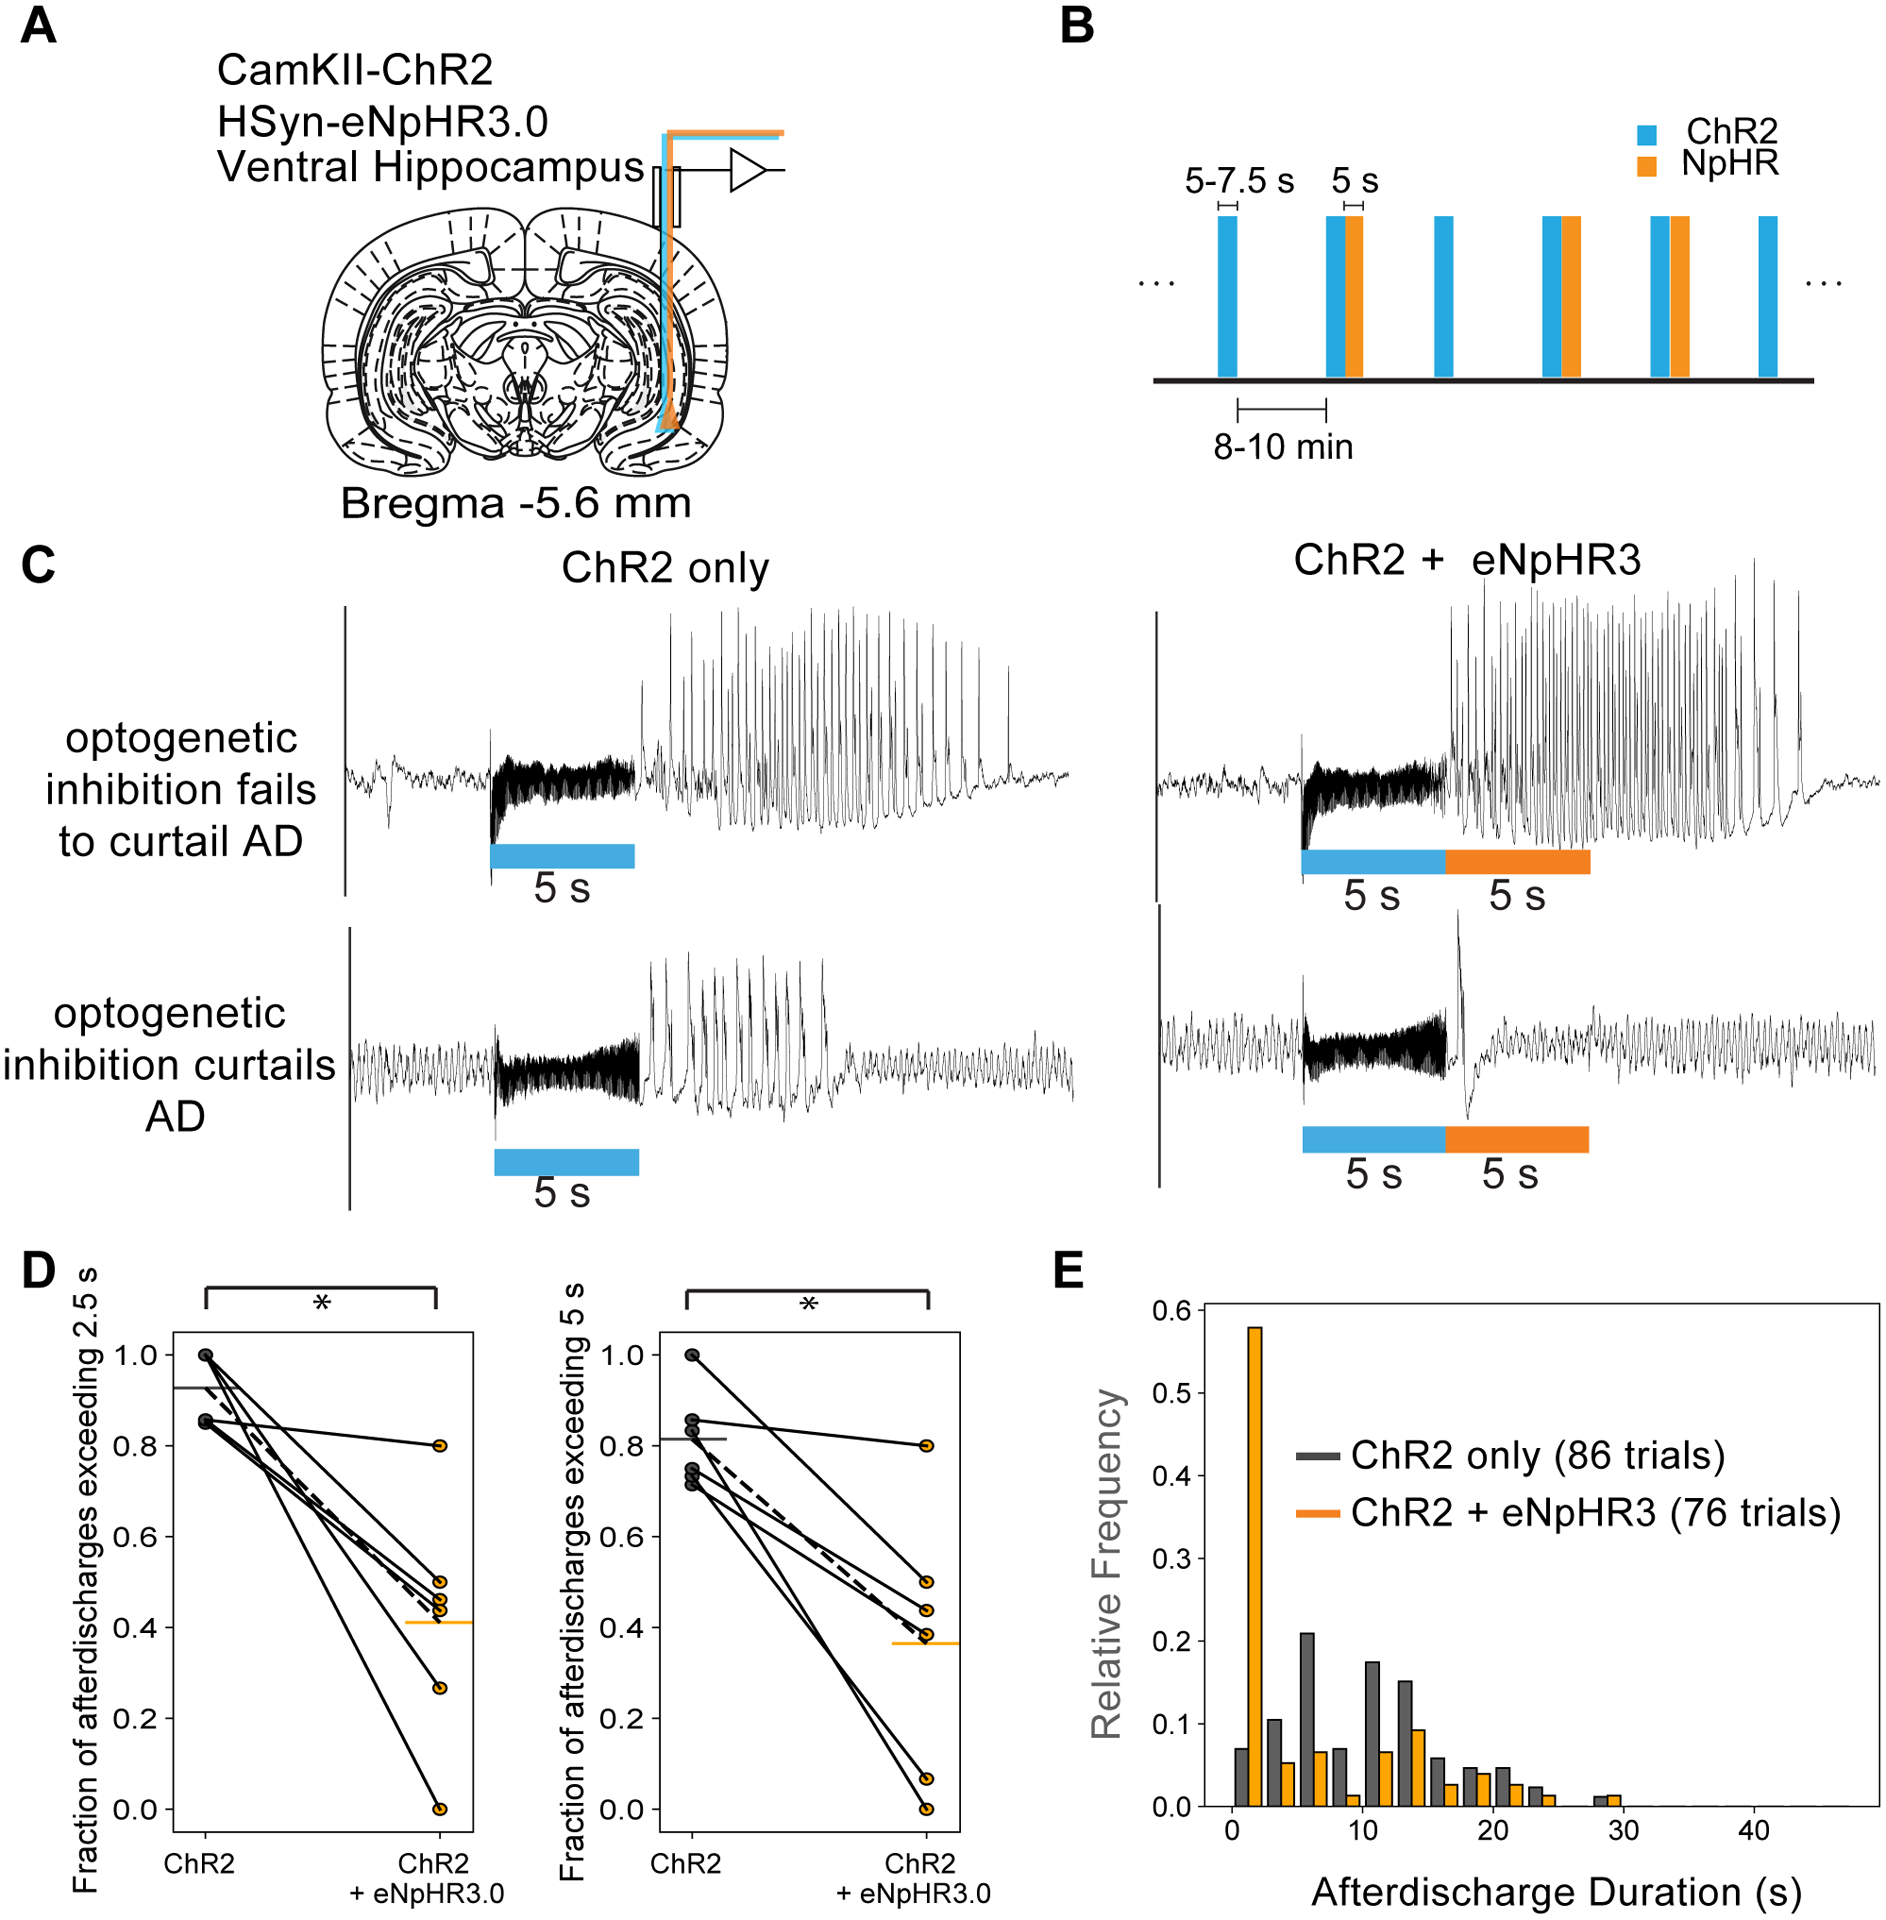
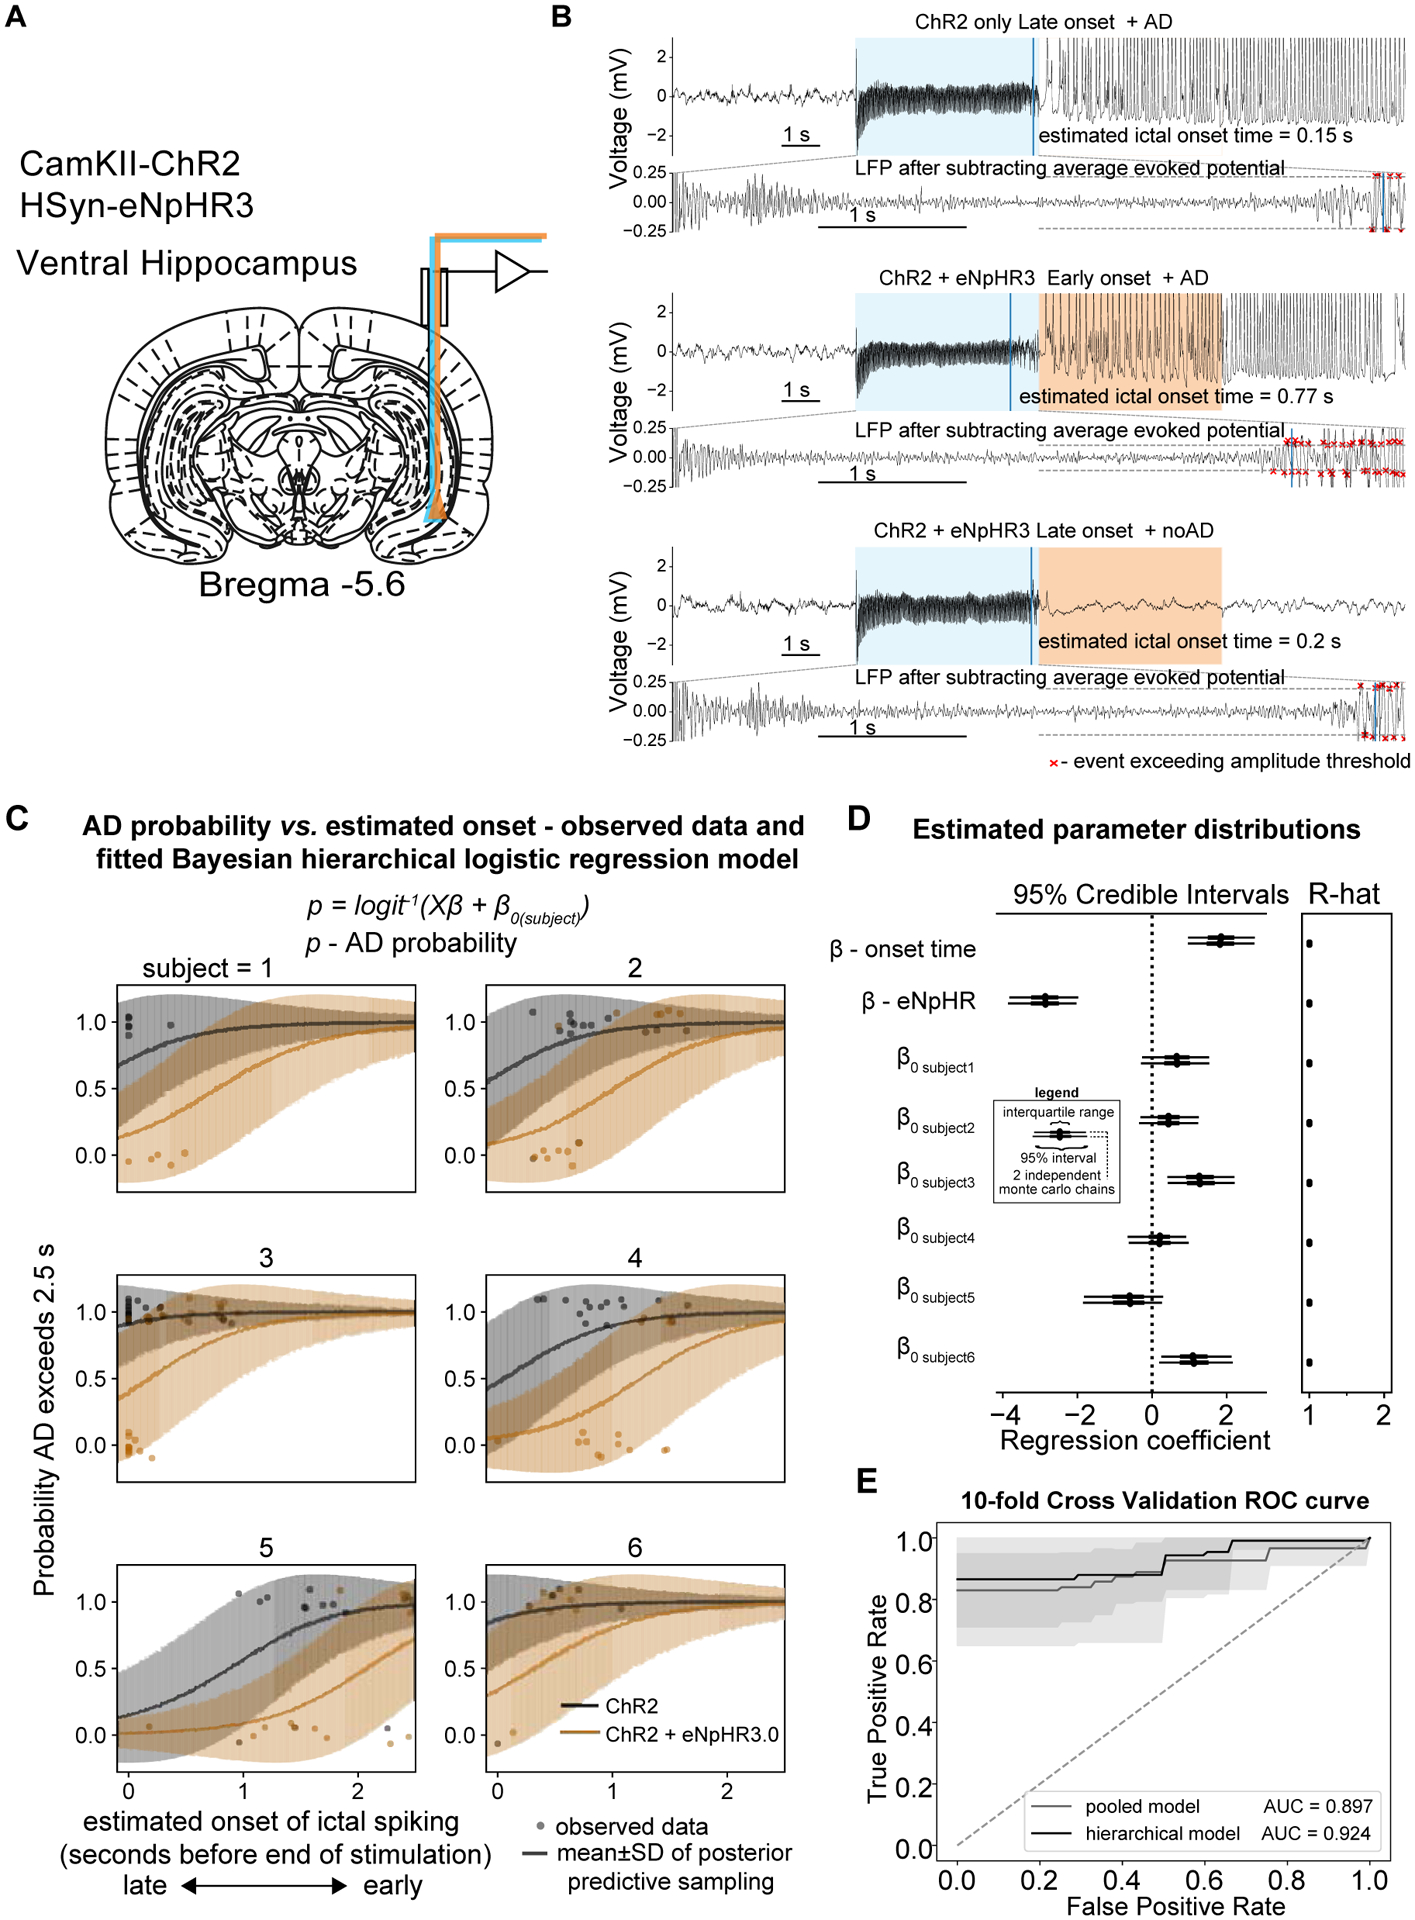
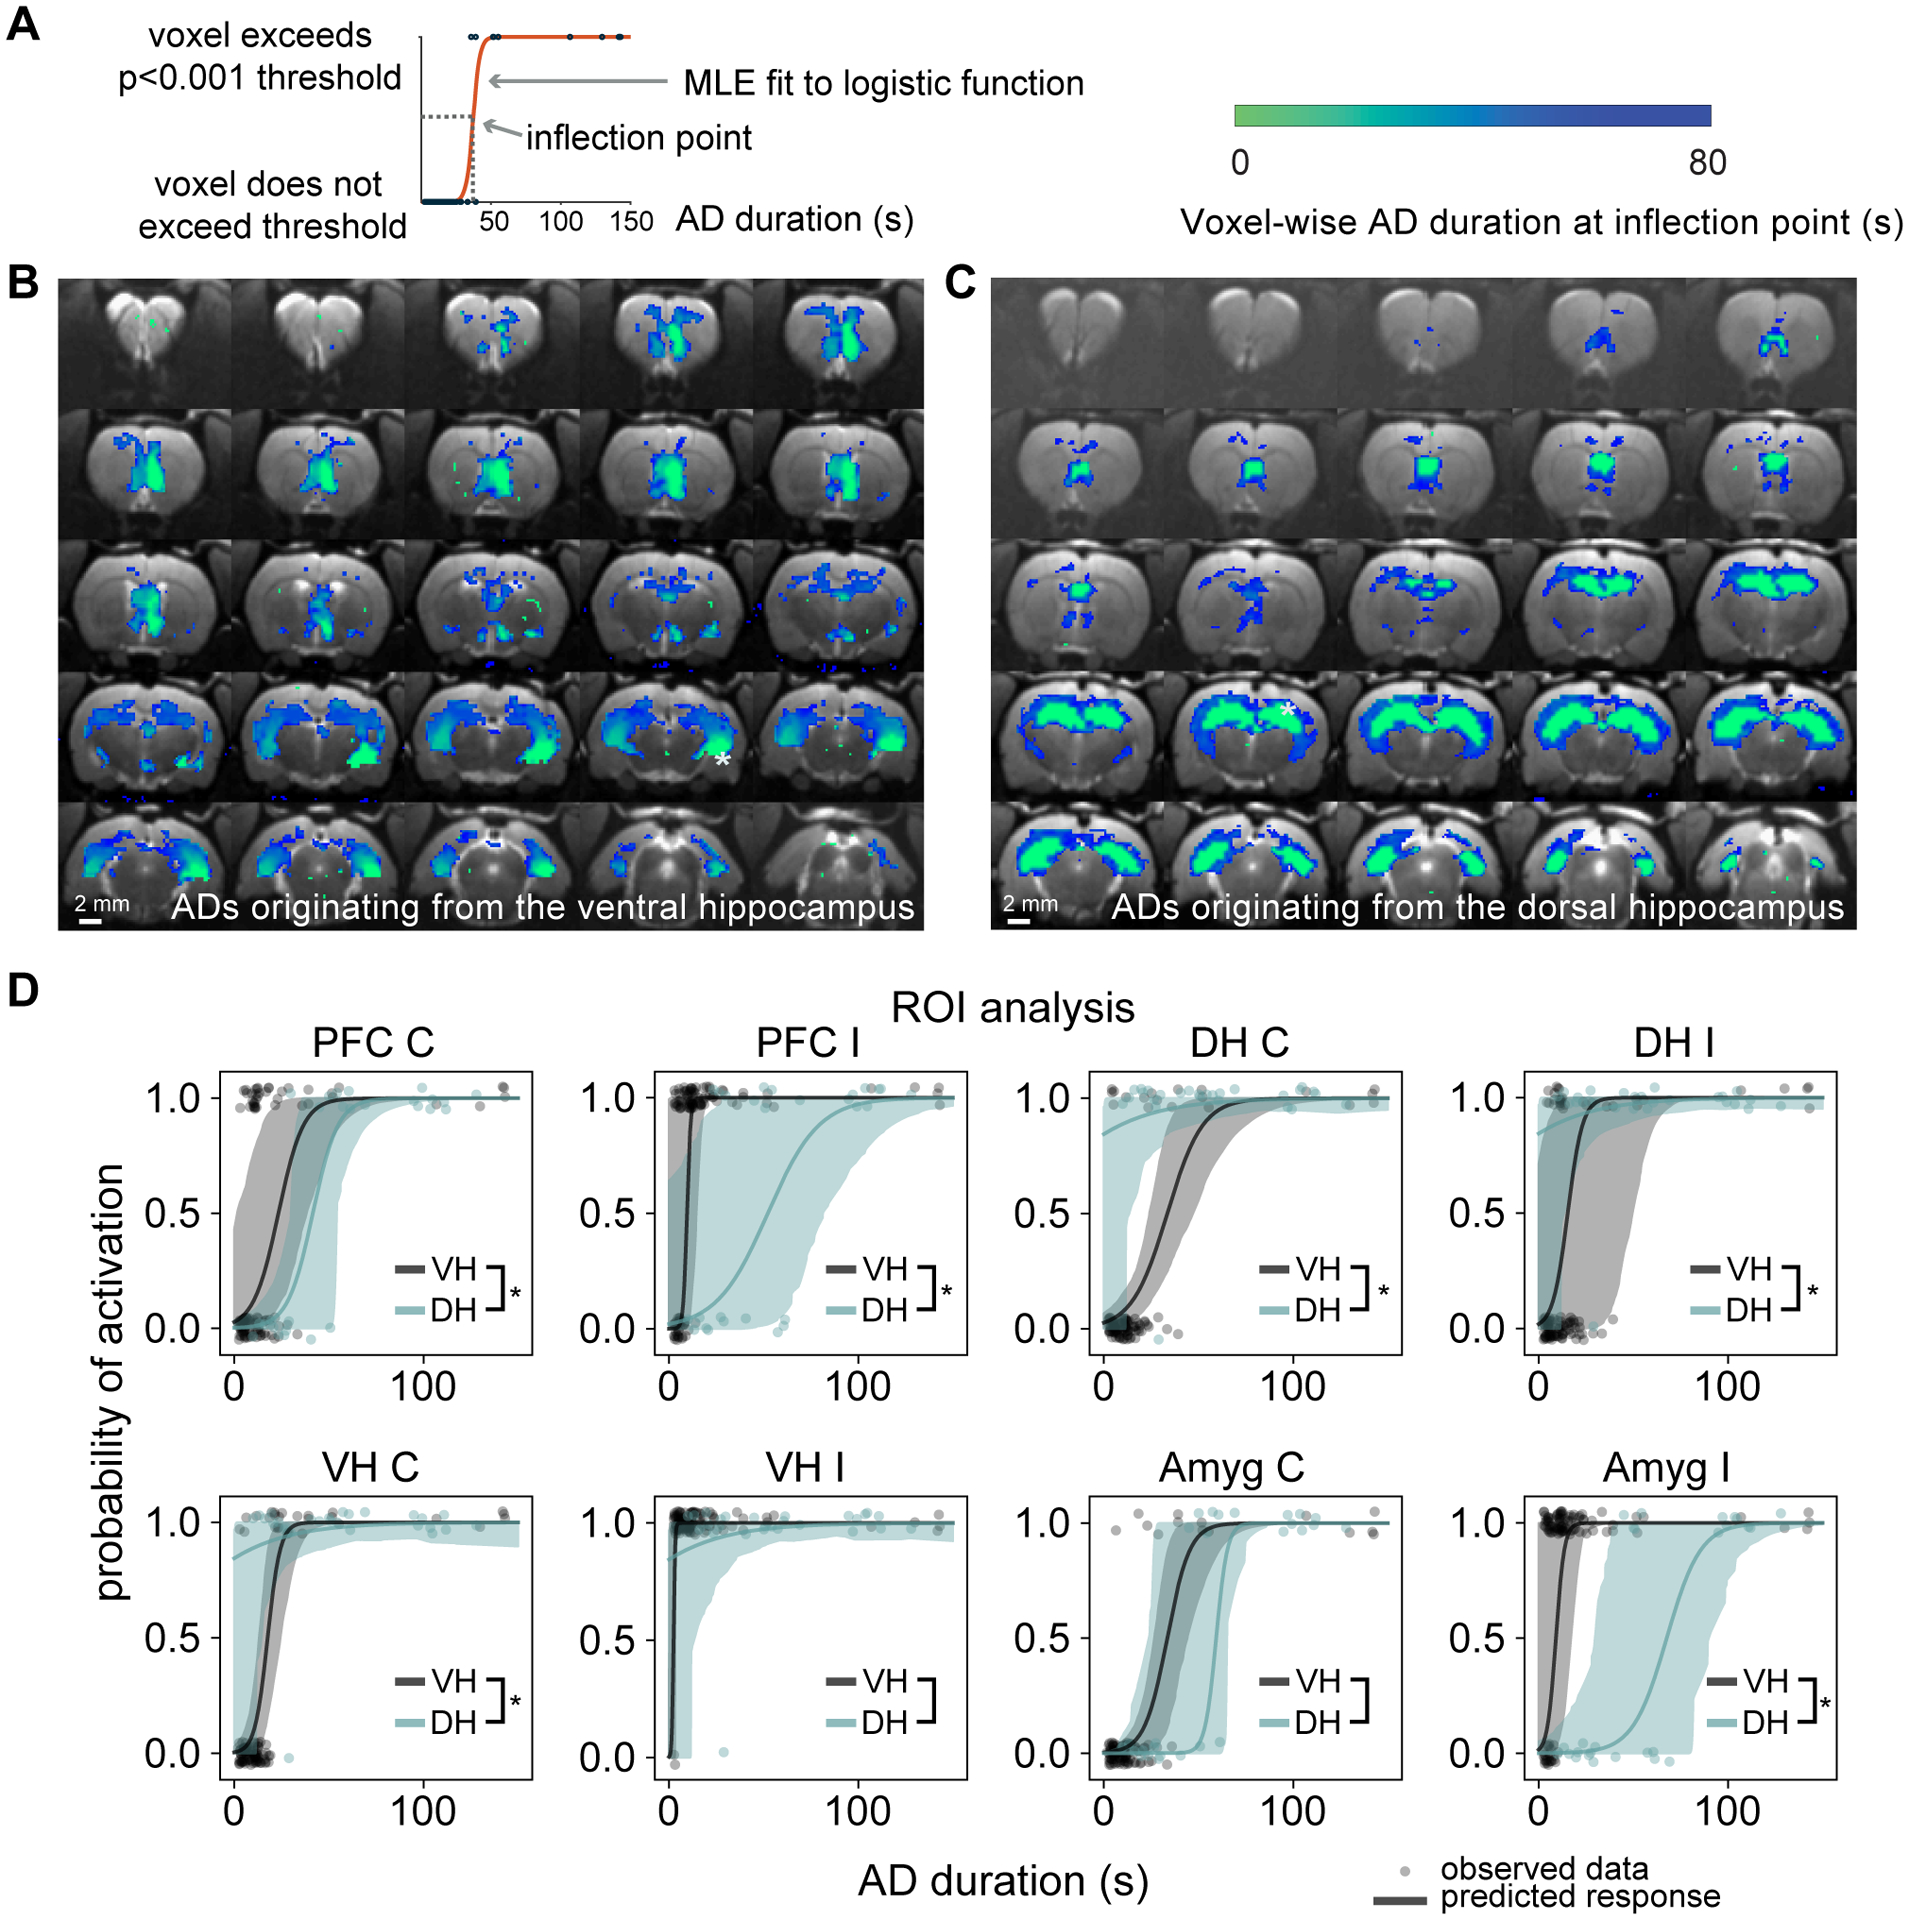
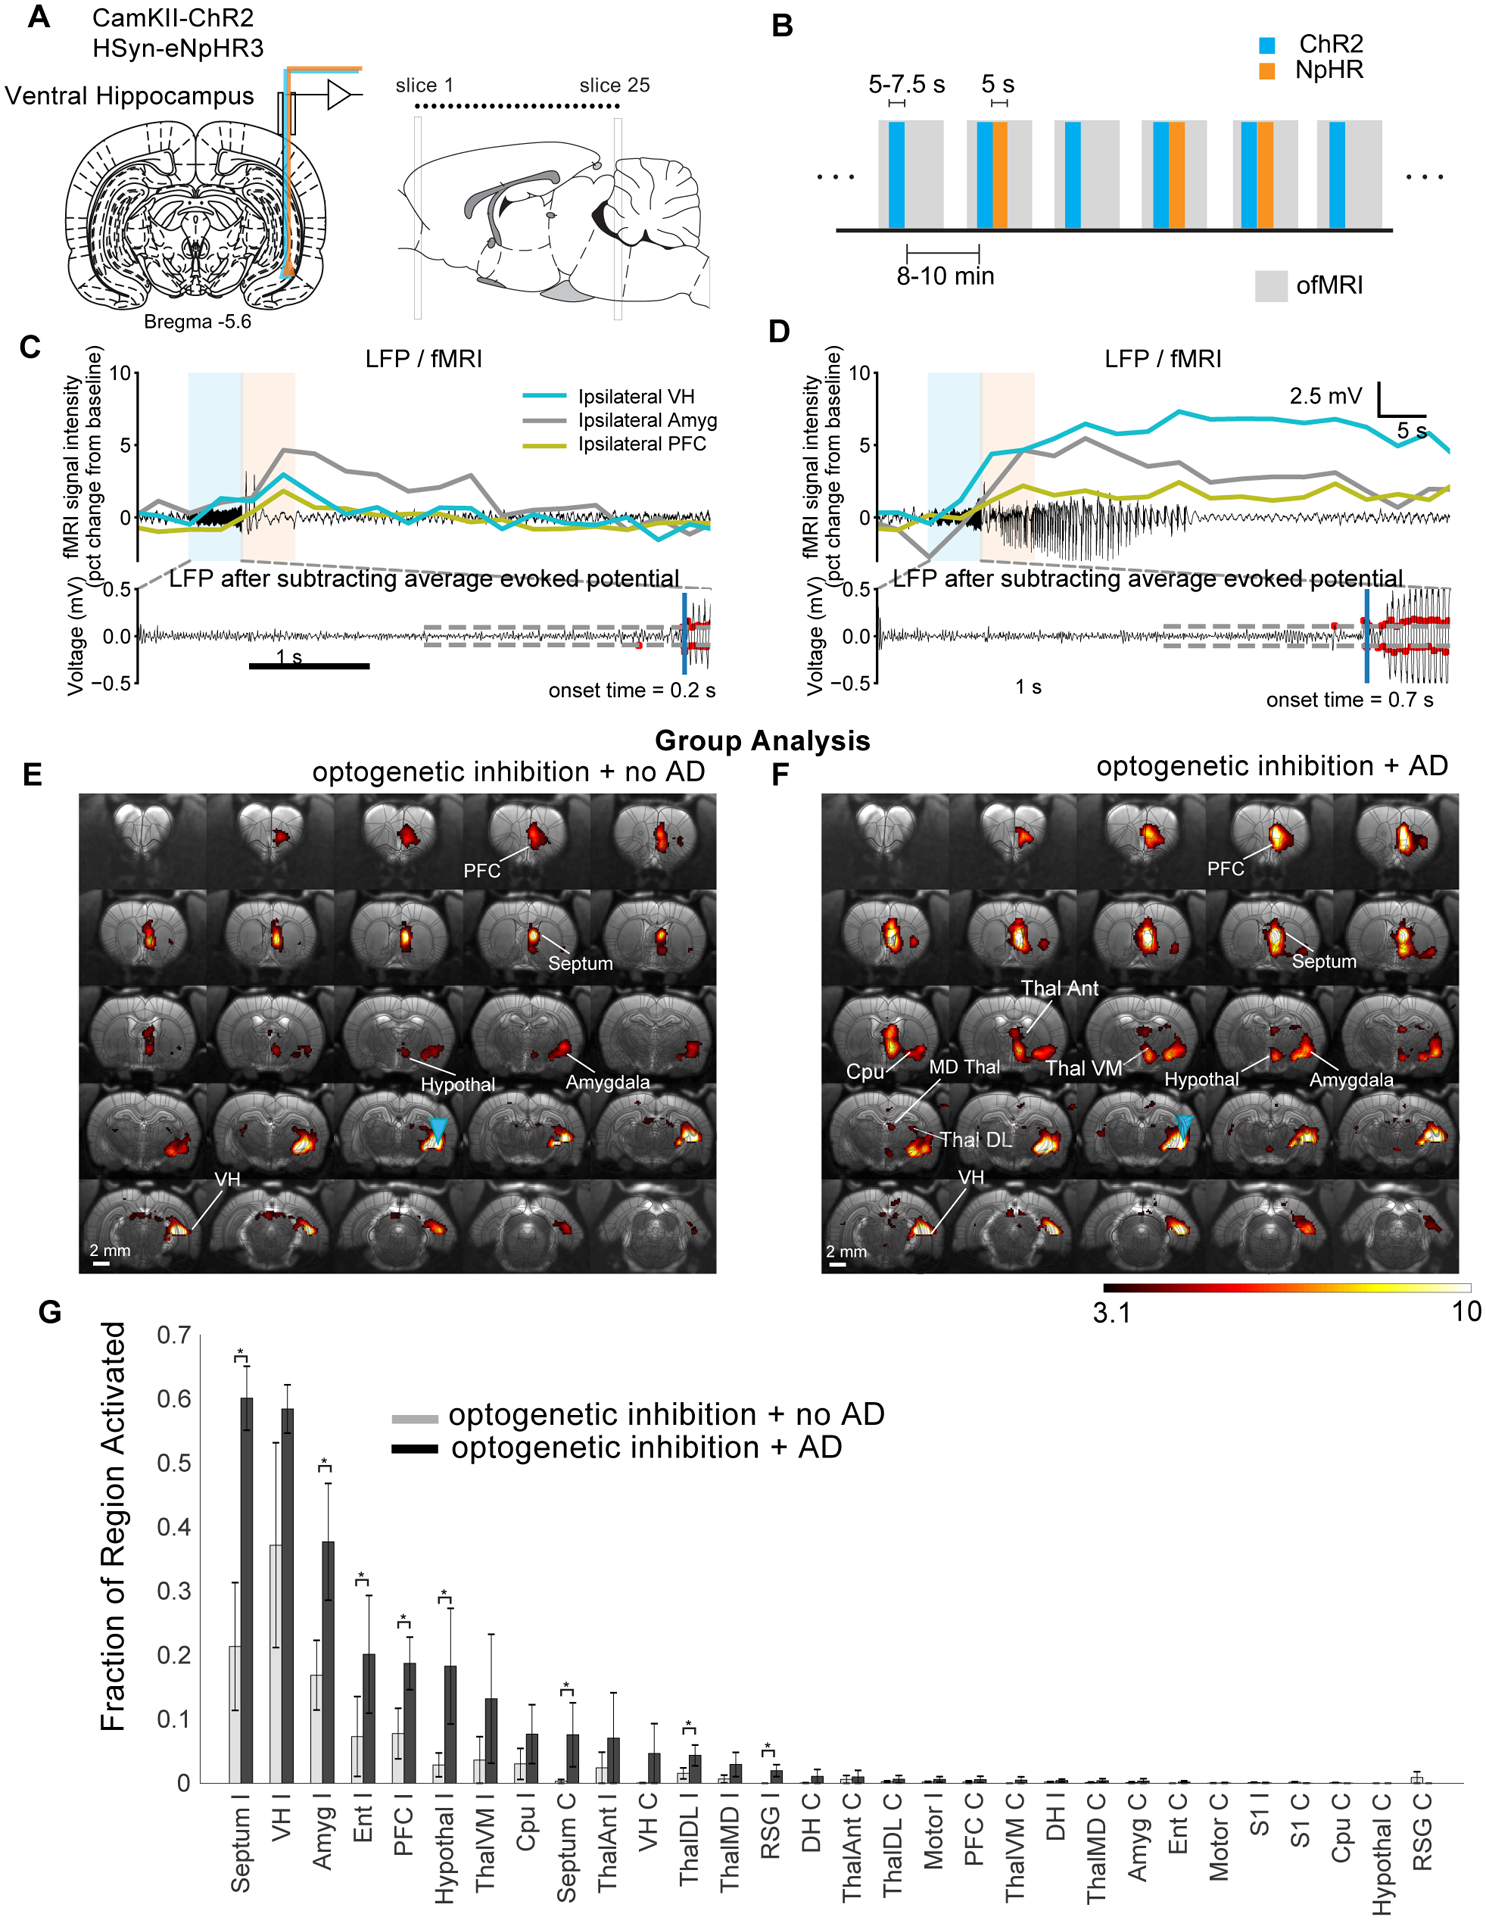
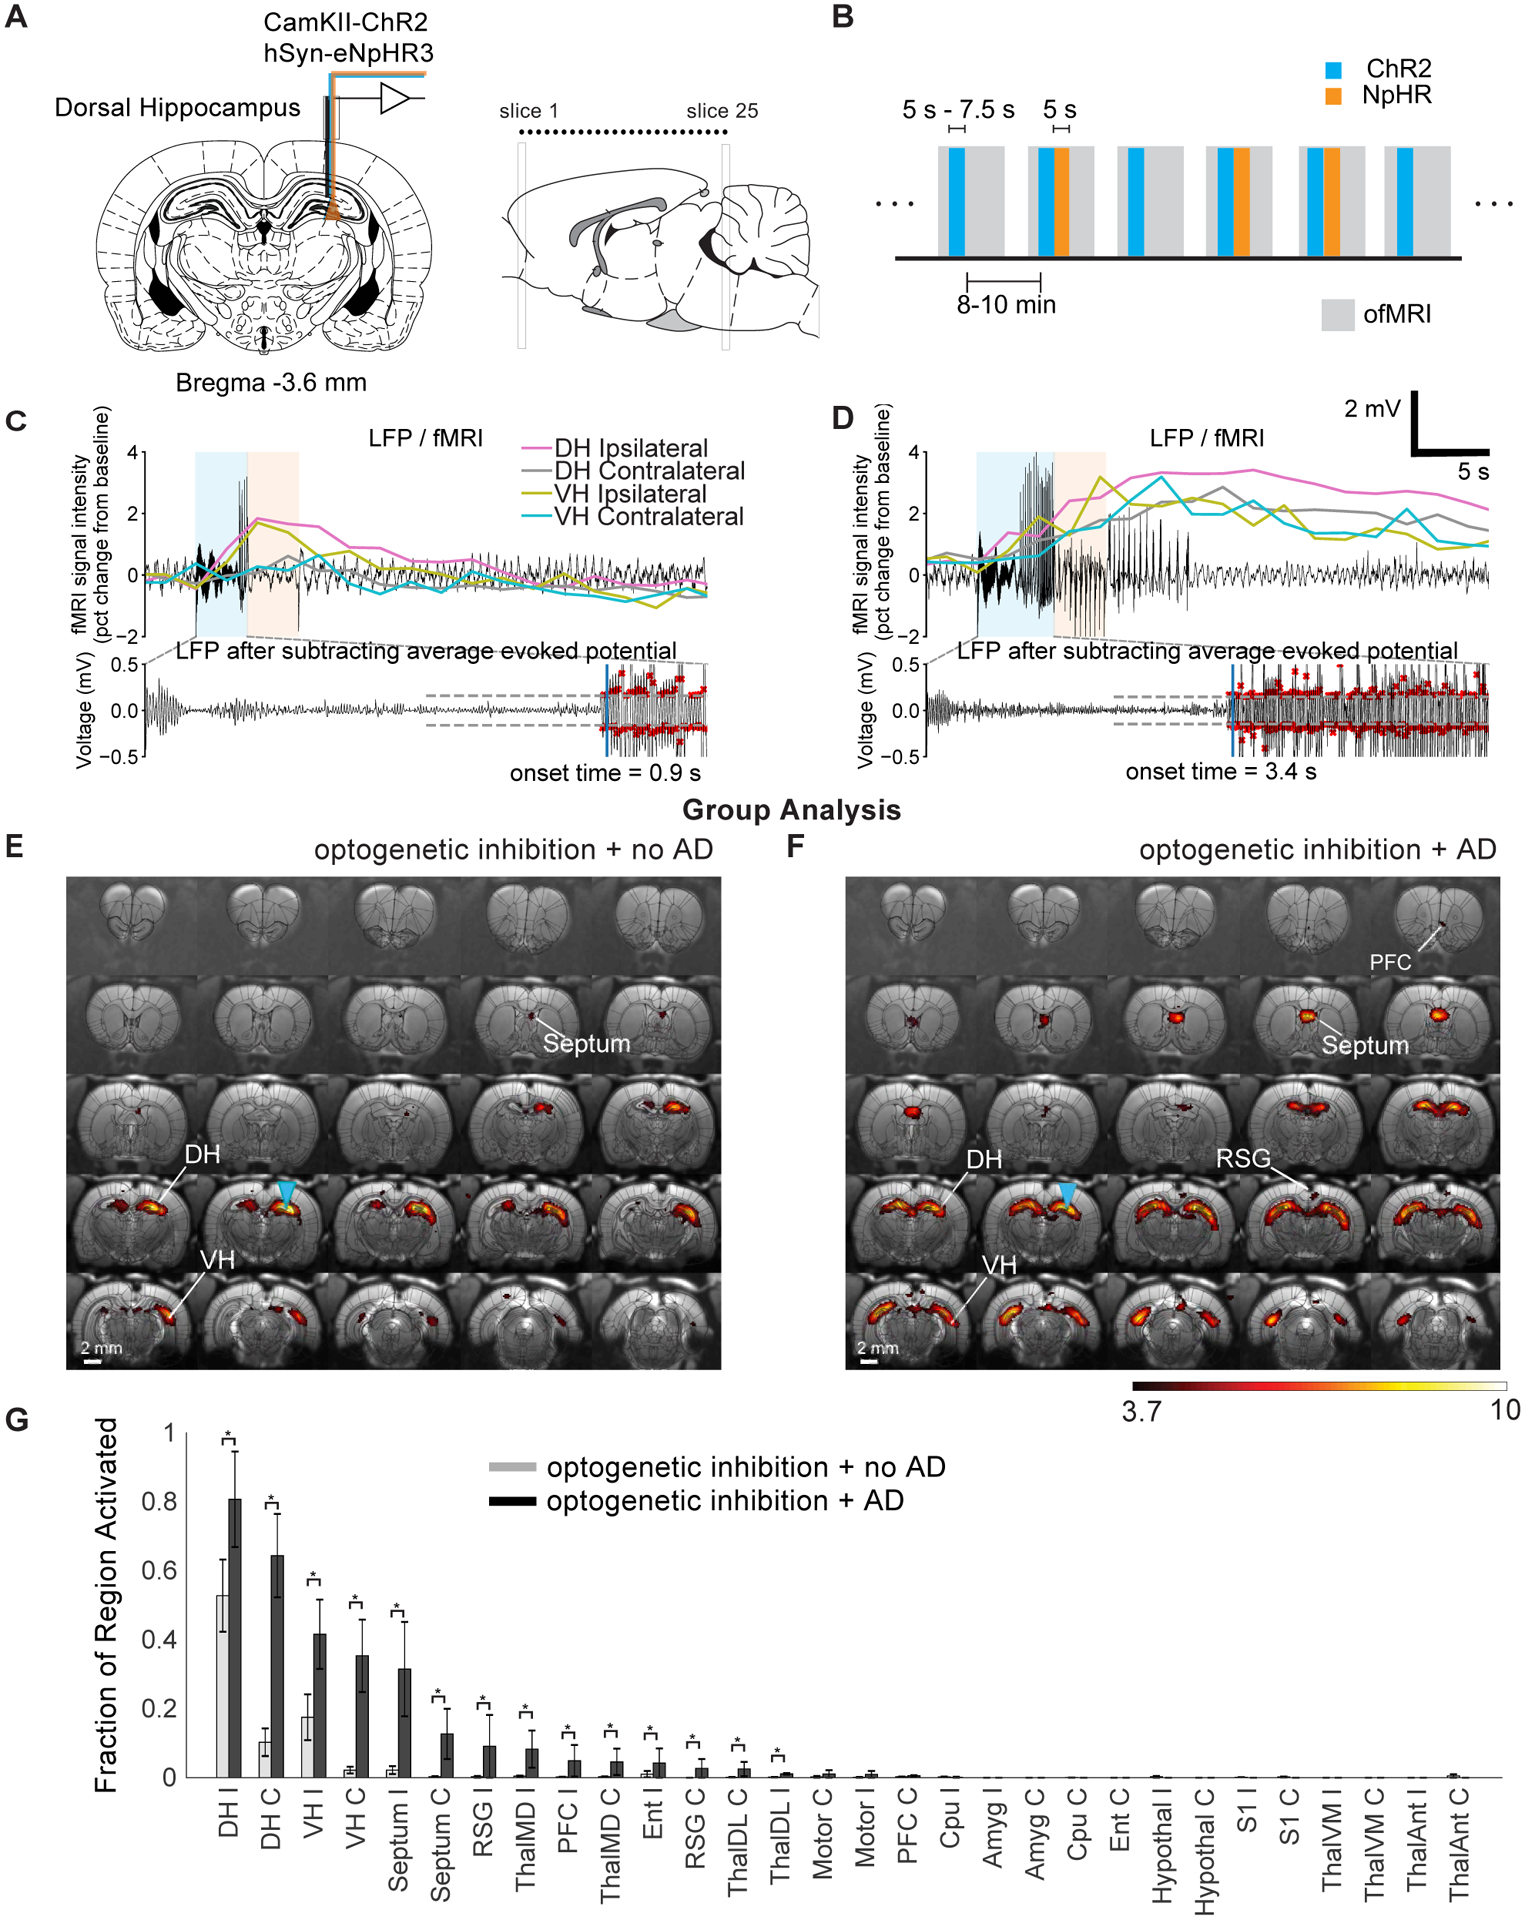
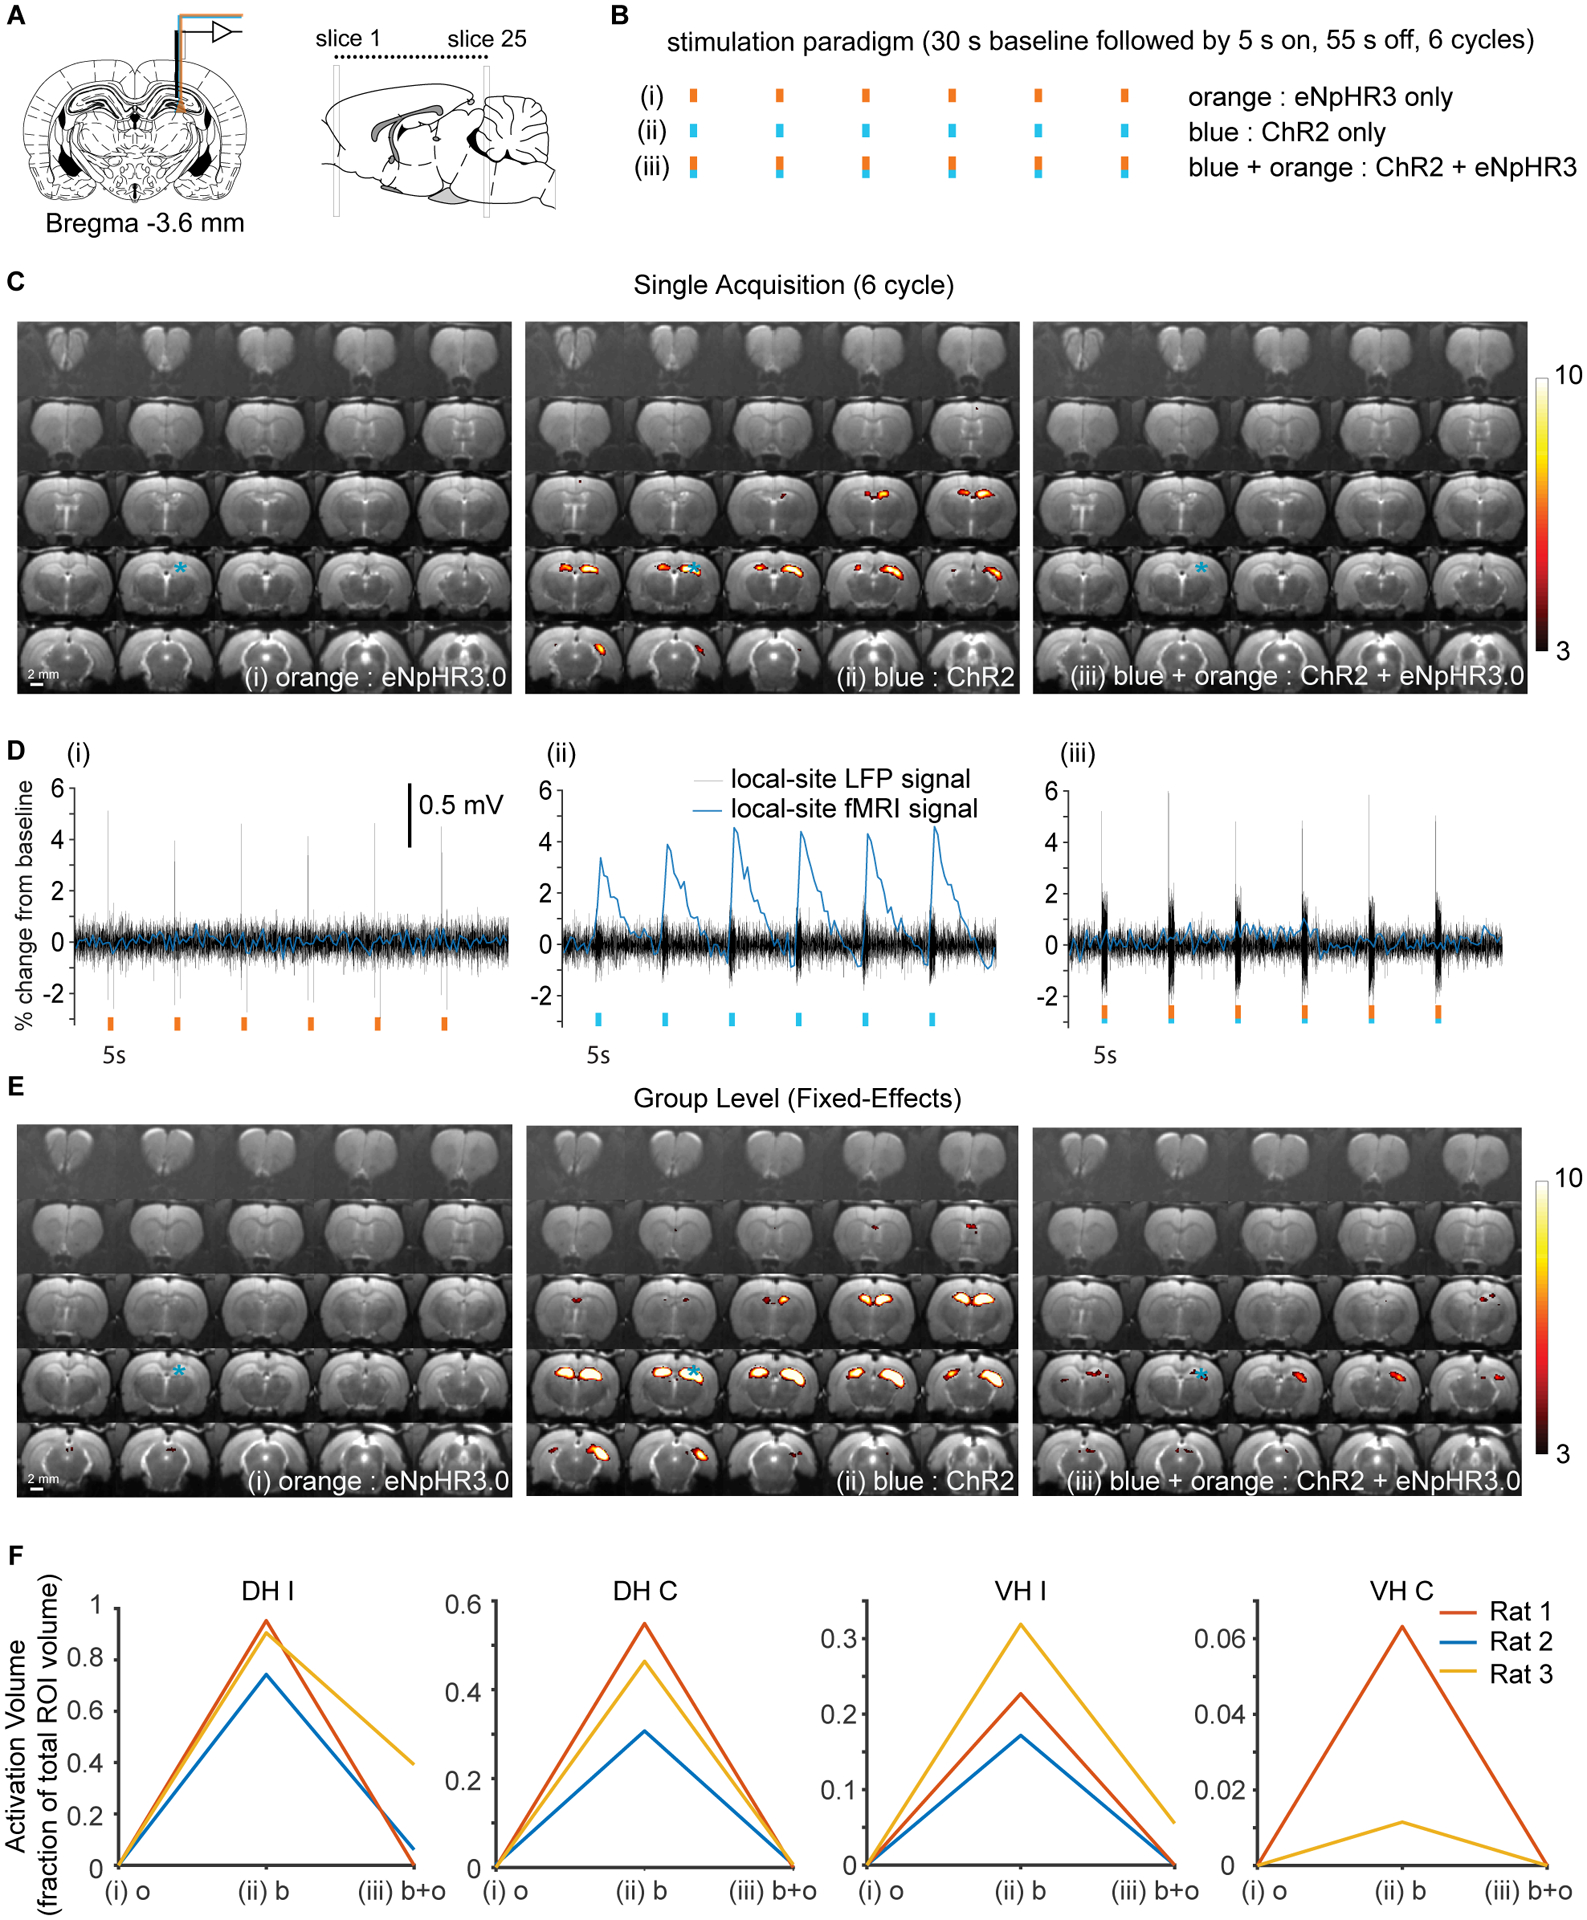
To understand the conditions necessary to initiate and terminate seizures, we investigate optogenetically induced hippocampal seizures with LFP, fMRI, and optogenetic inhibition. During afterdischarge induction using optogenetics, LFP recordings show that stimulations with earlier ictal onset times are more likely to result in afterdischarges and are more difficult to curtail with optogenetic inhibition. These results are generalizable across two initiation sites, the dorsal and ventral hippocampus. fMRI shows that afterdischarges initiated from the dorsal or ventral hippocampus exhibit distinct networks. Short-duration seizures initiated in the dorsal and ventral hippocampus are unilateral and bilateral, respectively, while longer-duration afterdischarges recruit broader, bilateral networks. When optogenetic inhibition is ineffective at stopping seizures, the network activity spreads more extensively but largely overlaps with the network activity associated with seizures that could be curtailed. These results provide insights into how seizures can be inhibited, which has implications for targeted seizure interventions.

Keywords: afterdischarge; epilepsy; fMRI; generation; hippocampus; inhibition; network; optogenetrics; seizure; stopping.


Conflict of interest statement

Declaration of Interests J.H.L. is a founder of LVIS.

Figures

Figure 1:
Figure 1:. More progressed ADs with earlier ictal onset time are more likely to be sustained
(A) Optrodes were implanted into the ventral hippocampus for electrophysiology and optogenetic excitation. (B) Example LFP traces from a single subject and session illustrating that ADs are not induced at lower light intensities e.g. 2 and 3 mW (top and middle panel respectively) but stimulating ChR2 positive neurons with more intense light e.g. 3.5 mW is able to induce ADs (lower panel). The AD that was sustained had an earlier estimated ictal onset time. The lower sub-panels illustrate how onset time is calculated by subtracting the sliding window evoked potential. (C) AD probability vs. ictal onset time as modelled using a hierarchical Bayesian logistic regression model where intercepts were allowed to vary across subjects. (excluding trials from sessions where the seizure threshold was already known i.e. fMRI sessions, n=13, AD-206 trials, noAD-192 trials). The line shows the mean±SD of the samples from the posterior predictive distribution of the binary outcome variable e.g. AD or no AD and the individual points show the observed data. (D) Left panel - Forest plot of estimated parameter distributions showing the interquartile range and 5th and 95th percentiles for 2 independently run Monte Carlo chains. Ictal onset time was determined to be a significant predictor of ADs as the 95% highest posterior density (HPD) parameter distribution did not contain zero. Right panel – Gelman-Rubin convergence statistic (r-hat) indicating convergence of Monte Carlo chains. Values here were less than 1.1 indicating good convergence. (E) 10-fold cross validation demonstrating good predictive performance of the hierarchical model compared to the pooled model.
Figure 2:
Figure 2:. Local optogenetic inhibition was able to curtail seizure-like afterdischarges.
(A) Ventral hippocampus was targeted for electrophysiology and optogenetic excitation and inhibition. (B) Experimental design. ChR2 excitation only and ChR2 followed by NpHR3.0 inhibition blocks were randomized and applied with a 10 min inter-stimulus interval. Example LFP traces from rats expressing hSyn-eNpHR3.0 illustrating examples where optogenetic inhibition was considered to have failed to curtail ADs (top panels) and where optogenetic inhibition was considered to have succeeded in curtailing ADs (lower panels). The traces on the left and right panels are from the same recording sessions. The left panels are from stimulations consisting of the control condition (ChR2 only) and the right panels are from where the optogenetic inhibition was applied immediately following the ChR2 blue light stimulation. These examples illustrate that ADs from sessions where the optogenetic inhibition fails to curtail the AD appeared longer and more severe. (D) Proportion of ADs exceeding 2.5/5 s in duration for the two different conditions – the control condition (ChR2 only) vs. the optogenetic inhibition condition (ChR2 + eNpHR3). (E) Histograms of AD duration for the two different stimulation conditions. This metric was included as AD duration can be highly variable across different sessions and subjects. * p<0.05 represents based on paired t-tests for n=6 subjects.
Figure 3:
Figure 3:. More progressed ADs cannot be interrupted using optogenetic inhibition.
Given the relationship between ictal onset time and AD probability, the onset time was used as a covariate in a subsequent regression analysis. (A) Ventral hippocampus was targeted for electrophysiology and optogenetic excitation and inhibition. (B) Examples LFP traces indicating stimulation condition and ictal onset time from a single session. Upper panel − ChR2 only and late onset ictal activity with a sustained AD. Middle panel − ChR2 + eNpHR3.0 and early onset ictal activity with a sustained AD. Lower panel − ChR2 + eNpHR3.0 and late onset ictal activity without after discharge. (C) Modelling using a Bayesian hierarchical (random intercept) logistic regression. i.e. the log odds of the AD probability logit(p) was explained by a linear combination of the stimulation condition and ictal onset time along with a subject specific intercept term. The line shows the mean±SD of the samples from the posterior predictive distribution of the binary outcome variable e.g. AD or noAD and the individual points show the observed data. (D) Left panel - Forest plot of estimated parameter distributions showing the interquartile range and 5th and 95th percentiles for 2 independently run Monte Carlo chains. Ictal onset time and stimulation condition (ChR2 vs. ChR2 + eNpHR3.0) were both determined to be significant predictors of ADs as their 95% highest posterior density (HPD) parameter distributions did not contain zero. Right panel – Gelman-Rubin convergence statistic (r-hat) indicating convergence of Monte Carlo chains. Values here were less than 1.1 indicating good convergence. (E) 10-fold cross validation demonstrating good predictive performance of the hierarchical model compared to the pooled model. All panels include n=6 rats.
Figure 4:
Figure 4:. Voxel-wise activation time maps comparing the spread of seizure activity between ADs originating in the dorsal and ventral hippocampi.
(A) A logistic function was fitted to each of the individual trials (blue dots) which progressed to AD and the inflection point was used as an estimate of the AD duration at which 50% of trials displayed activation for each voxel. (B) Voxel-wise relationship between AD duration and fMRI activation for focal VH ADs and (C) focal DH ADs. Distinct patterns were observed for seizures originating from the ventral hippocampus compared to the dorsal hippocampus. Activation is present in the ipsilateral PFC for short duration ADs, whereas the inflection point is slightly later for the contralateral VH and PFC. However, both the ipsilateral and contralateral DH are only activated in longer duration ADs. In seizures originating from the DH, both the ipsi- and contralateral DH and VH are activated in short duration ADs, whereas longer duration ADs may start to involve cortical regions. (D) ROI-wise analysis. Regions were considered to be activated if their volume of activation exceeded 10% of the maximum volume within each subject. Observed data are represented as a binary response variable with “1” representing the region as active and “0” representing not active. The response predicted by the random intercept logistic regression is displayed as the mean ± 95% bootstrapped confidence intervals. * denotes that the inflection point is significantly different at a level of p<0.05, based on hypothesis testing using parametric bootstrapping (VH: n=6 rats and DH: n=3 rats)
Figure 5:
Figure 5:. fMRI activation maps for ADs originating from the ventral hippocampus indicates that ADs that did not progress were limited to the hypothalamus, amygdala and PFC.
(A) Optrodes were implanted into the ventral hippocampus for electrophysiology and optogenetic excitation and inhibition. (B) Within session fMRI stimulation paradigm involved randomly alternating between trials which did and did not involve eNpHR3.0. (C and D) Examples of simultaneously acquired LFP and fMRI signal from different ROIs. Fixed-effects group-level analysis (n=3) for trials that did not (E) and did (F) progress to ADs despite optogenetic inhibition. (G) Fraction of region activated with and without successful optogenetic inhibition of AD. Single trial T-statistic maps are thresholded at p<0.001, uncorrected, whereas group-level activation maps are shown at a threshold of p<0.0001, uncorrected. Data are represented as mean ± SEM. Abbreviations are as follows: Amyg (amygdala), Cpu (caudate putamen), DH (dorsal hippocampus), Ent (entorhinal cortex), PFC (prefrontal cortex), RSG (retrosplenial granular cortex), ThalDL (dorsomedial thalamus), ThalMD, (mediodorsal thalamus), ThalVM (ventromedial thalamus). * indicates the fixed-effects difference between AD vs. no AD at a significance level of 0.05.
Figure 6:
Figure 6:. fMRI activation maps with dorsal hippocampus stimulation and inhibition shows that ADs did not progress were limited to the anterior dorsal hippocampus.
(A) Optrodes were implanted into the dorsal hippocampus for electrophysiology and optogenetic excitation and inhibition. (B) Within session fMRI stimulation paradigm involved randomly alternating between trials which did and did not involve eNpHR. (C and D) Simultaneously acquired LFP and fMRI signal from different ROIs. (E and F) Fixed-effects group-level (t-statistic) analysis (n=3) for trials that did not (E) and did (F) progress to ADs despite optogenetic inhibition. (G) Fraction of region activated with and without successful optogenetic inhibition of ADs. T-statistic maps are thresholded at p<0.0001, uncorrected. Data are represented as mean ± SEM. Abbreviations are as follows: Amyg (amygdala), Cpu (caudate putamen), DH (dorsal hippocampus), Ent (entorhinal cortex), PFC (prefrontal cortex), RSG (retrosplenial granular cortex), ThalDL (dorsomedial thalamus), ThalMD, (mediodorsal thalamus), ThalVM (ventromedial thalamus). * indicates the fixed-effects difference between AD vs. no AD at a significance level of 0.05.
Figure 7:
Figure 7:. Optogenetic inhibition applied during optogenetic stimulation dramatically attenuates the fMRI response, while applied by itself optogenetic inhibition does not alter the CBV weighted fMRI signal.
(A) Optrodes were implanted into the dorsal hippocampus for electrophysiology and optogenetic excitation and inhibition. (B) Three separate stimulation paradigms were compared in each animal using simultaneous LFP-ofMRI. (i) Optogenetic inhibition applied on its own (eNpHR3 only). (ii) Optogenetic stimulation of ChR2 using blue light only (ChR2 only). (iii) Optogenetic stimulation and inhibition applied at the same time (ChR2 + eNpHR3 together). (C) Typical activation maps from a single trial and single subject for the three different conditions listed above. (D) Time courses for fMRI and LFP for the example data shown in (C). Note that local optogenetic inhibition applied during activation of ChR2 almost completely eliminated the fMRI response, whereas the LFP response to ChR2 stimulation remained intact. (E) Fixed-effects fMRI analysis activation maps generated from across all trials and all 3 subjects. (F) Activation volumes for the three different subjects plotted for the 4 different regions that are activated. Note that only very limited activation occurred in one rat when halorhodopsin and ChR2 were activated simultaneously using blue and orange light. Abbreviations: DH I – dorsal hippocampus ipsilateral, DH C - dorsal hippocampus contralateral, VH I – ventral hippocampus ipsilateral, VH C – ventral hippocampus contralateral. All activation maps are shown at p< 0.001, uncorrected. E to change to orange, blue then blue + orange

Similar articles

Cited by

References

    1. Allen PJ, Josephs O, and Turner R (2000). A method for removing imaging artifact from continuous EEG recorded during functional MRI. NeuroImage 12, 230–239. - PubMed
    1. Bates D, Mächler M, Bolker B, and Walker S (2014). Fitting linear mixed-effects models using lme4. arXiv preprint arXiv:14065823.
    1. Bohannon AS, and Hablitz JJ (2018). Optogenetic dissection of roles of specific cortical interneuron subtypes in GABAergic network synchronization. The Journal of physiology 596, 901–919. - PMC - PubMed
    1. Choy M, Duffy BA, and Lee JH (2017). Optogenetic study of networks in epilepsy. Journal of neuroscience research 95, 2325–2335. - PMC - PubMed
    1. Christie IN, Wells JA, Southern P, Marina N, Kasparov S, Gourine AV, and Lythgoe MF (2013). fMRI response to blue light delivery in the naive brain: implications for combined optogenetic fMRI studies. Neuroimage 66, 634–641. - PubMed

Publication types

Substances