. 2020 Feb 25;30(8):2758-2775.e6.
doi: 10.1016/j.celrep.2020.01.108.

Dissecting the Regulatory Strategies of NF-κB RelA Target Genes in the Inflammatory Response Reveals Differential Transactivation Logics

Affiliations

Dissecting the Regulatory Strategies of NF-κB RelA Target Genes in the Inflammatory Response Reveals Differential Transactivation Logics

Kim A Ngo et al. Cell Rep. .

Abstract

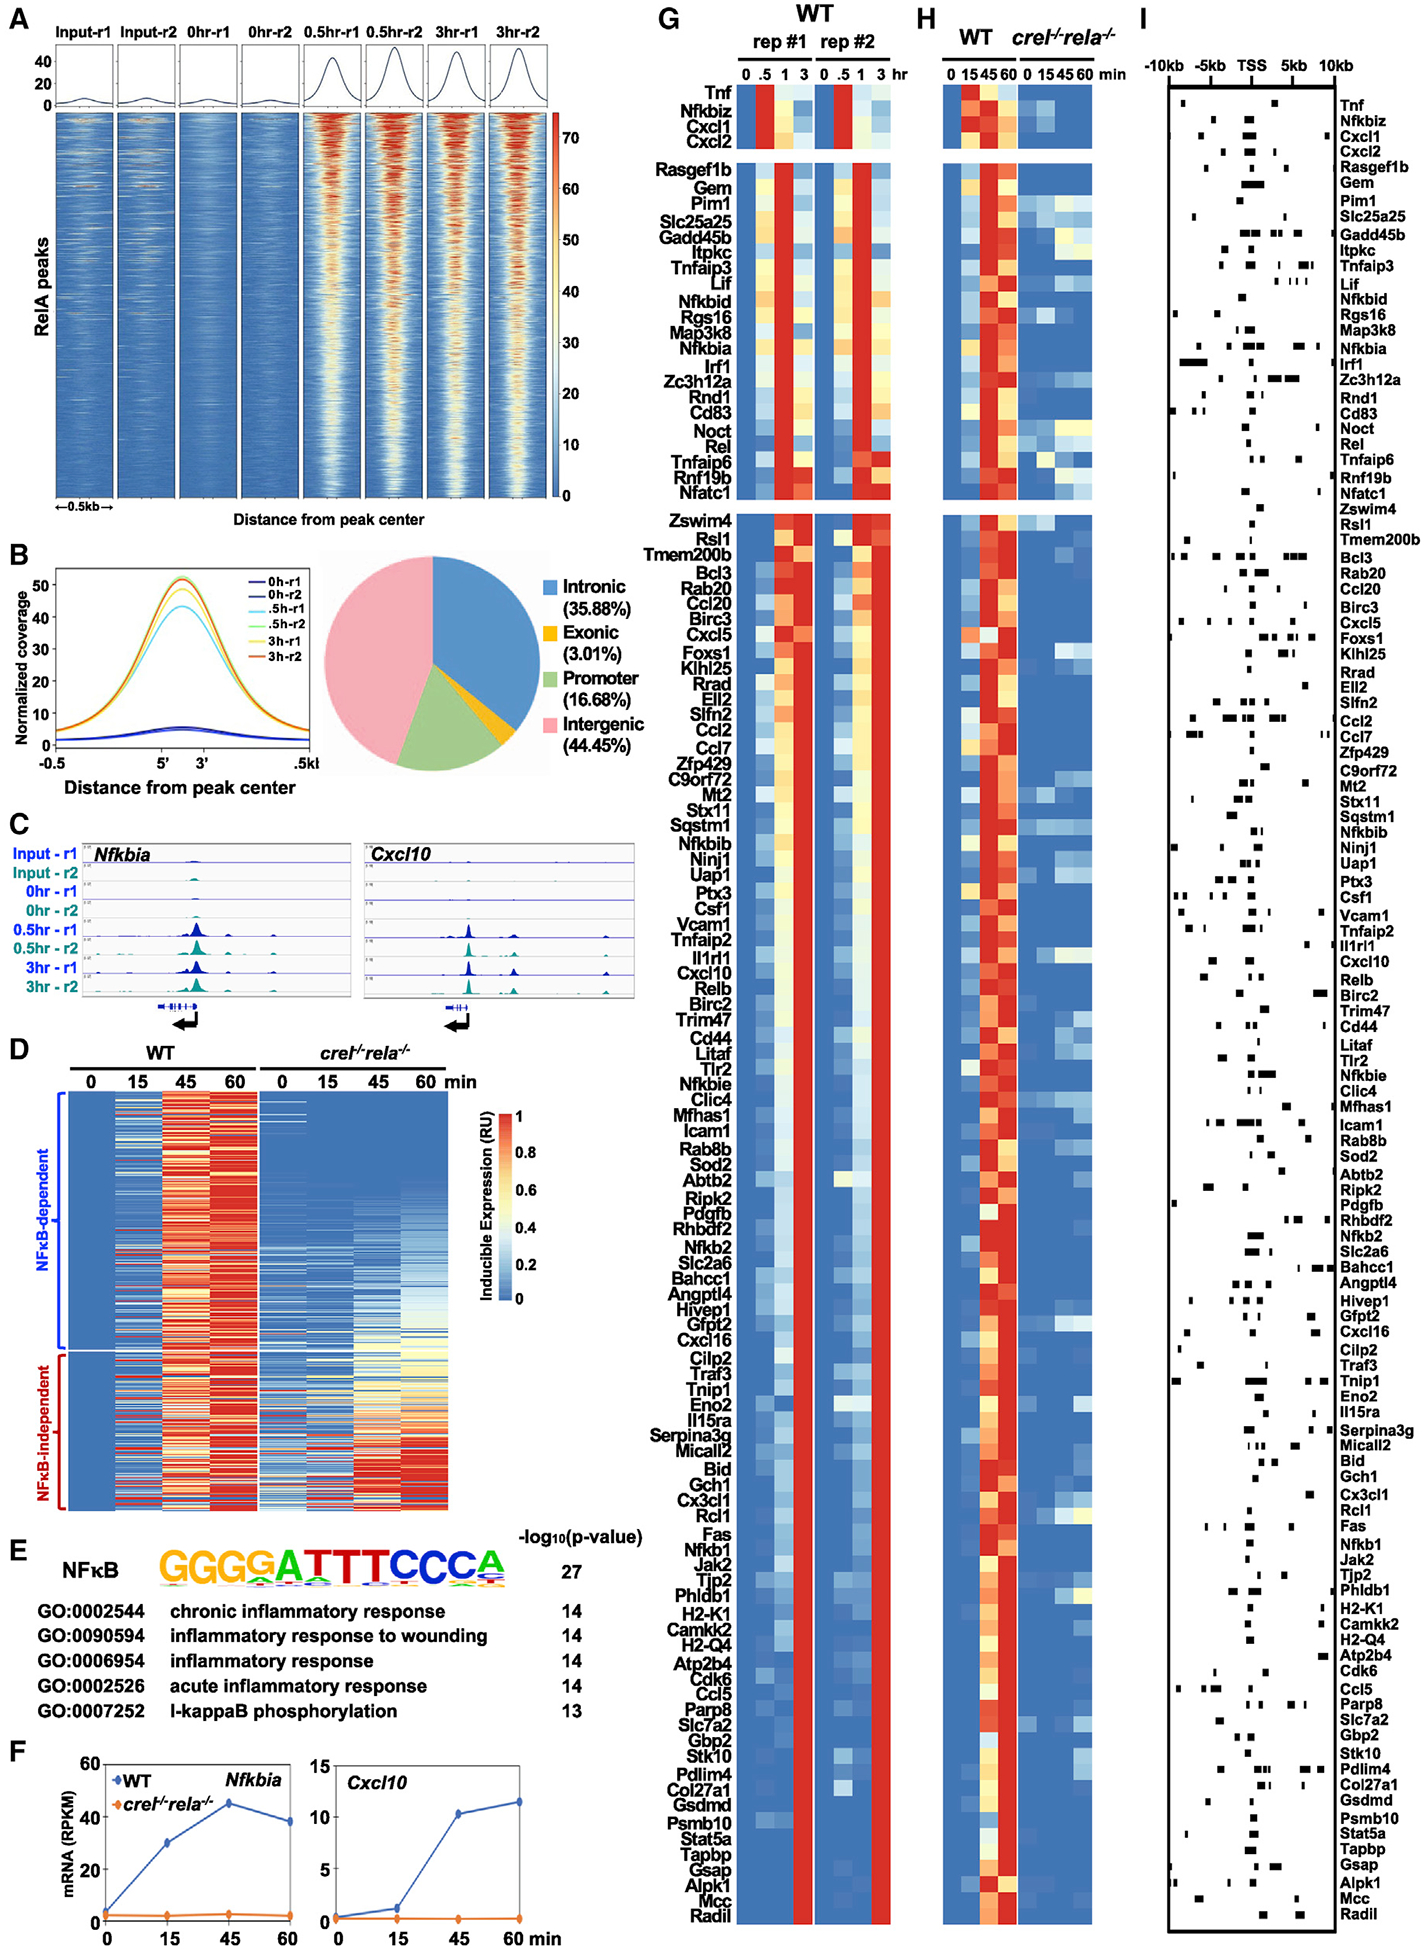
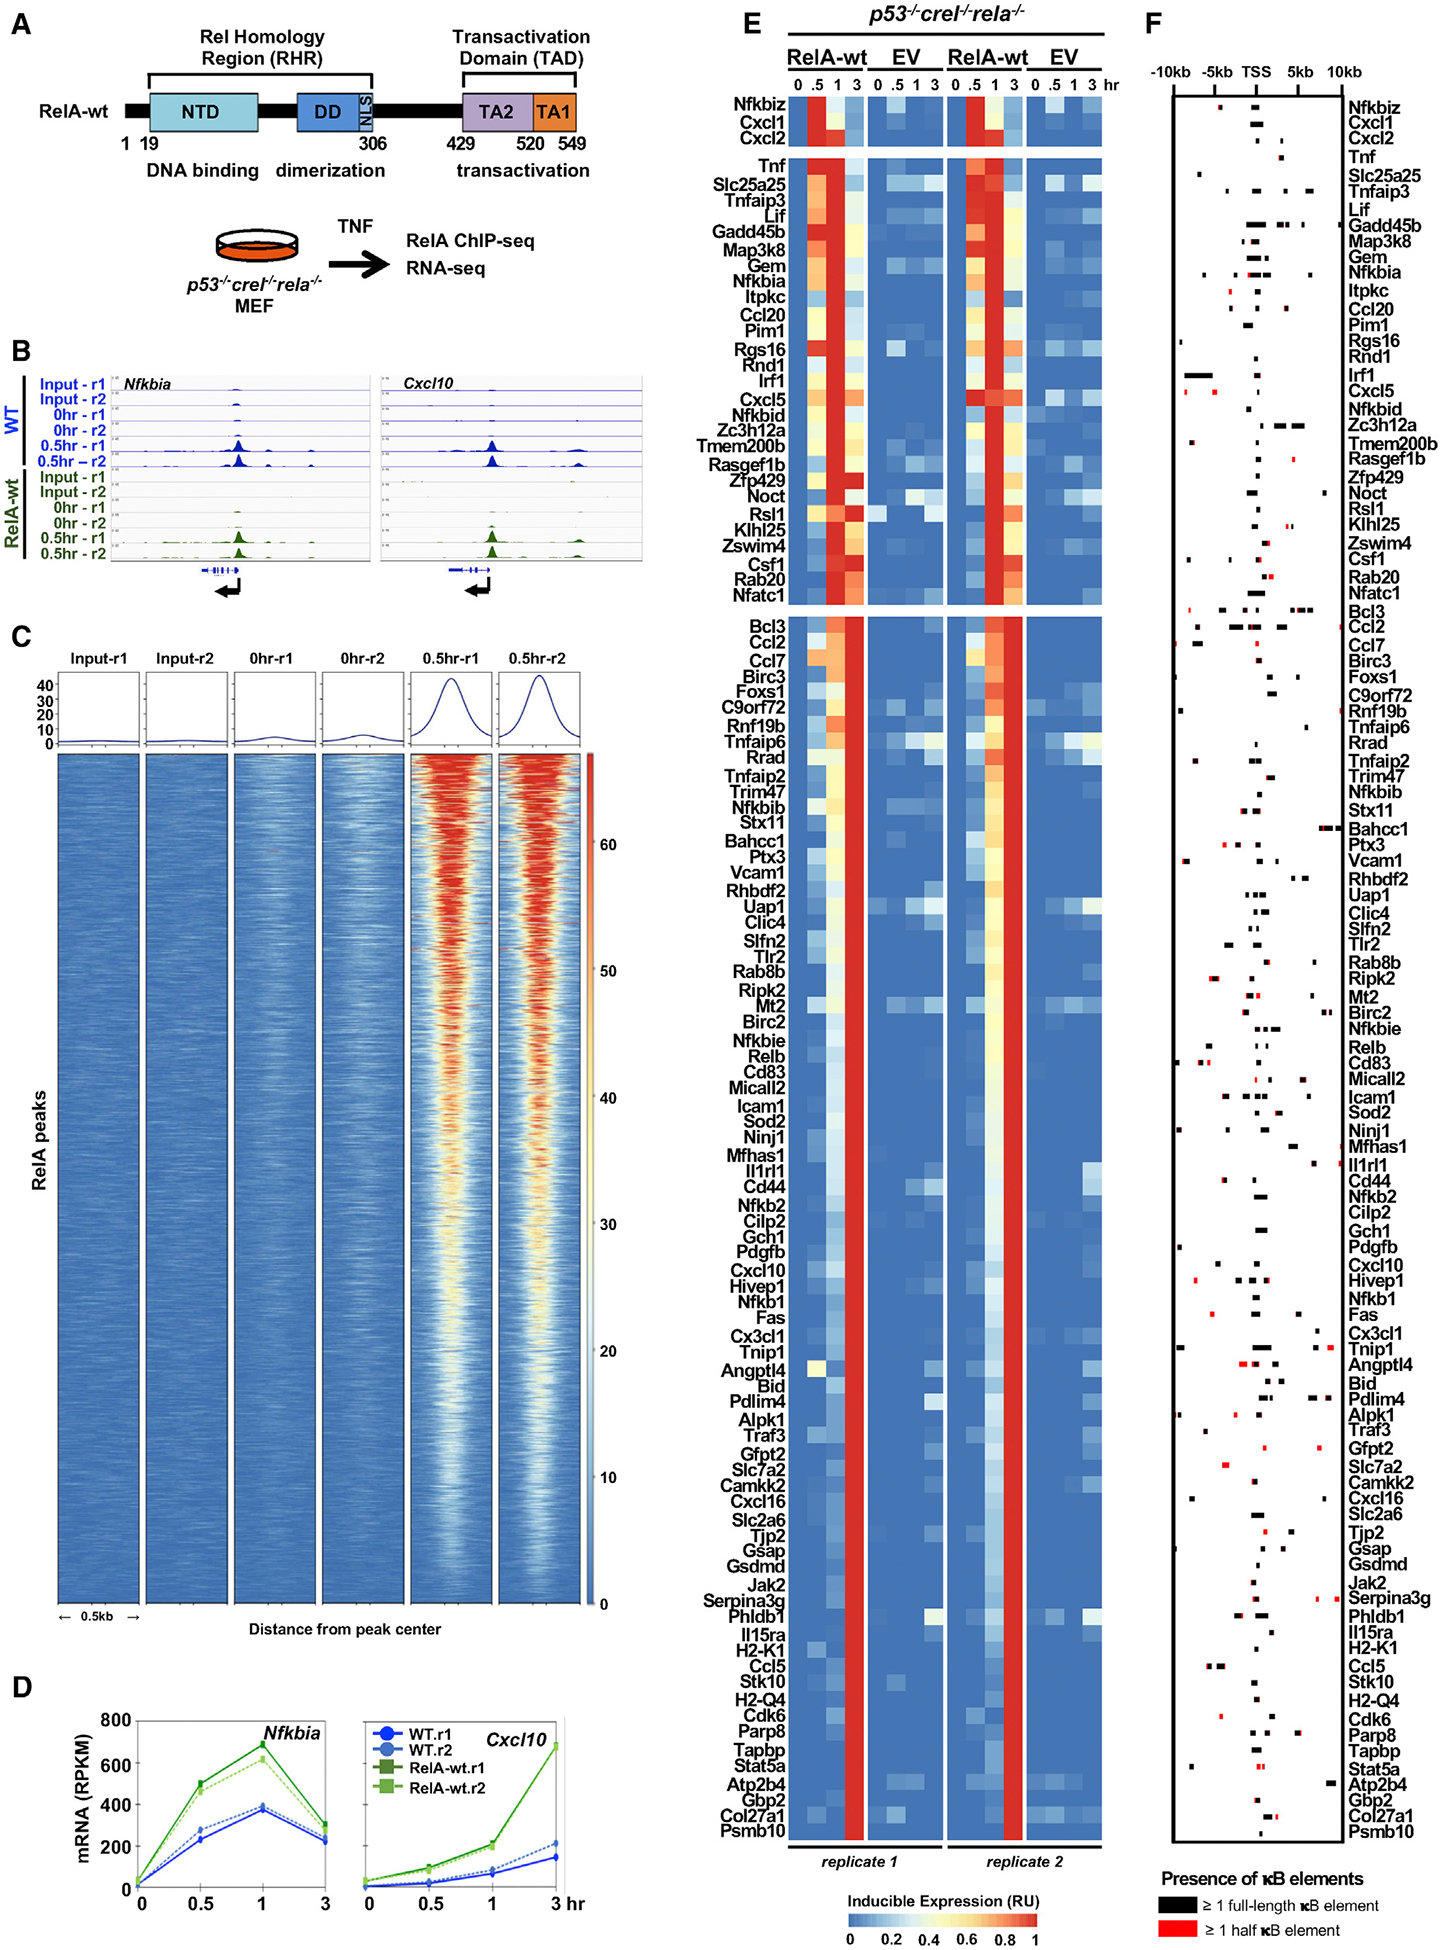
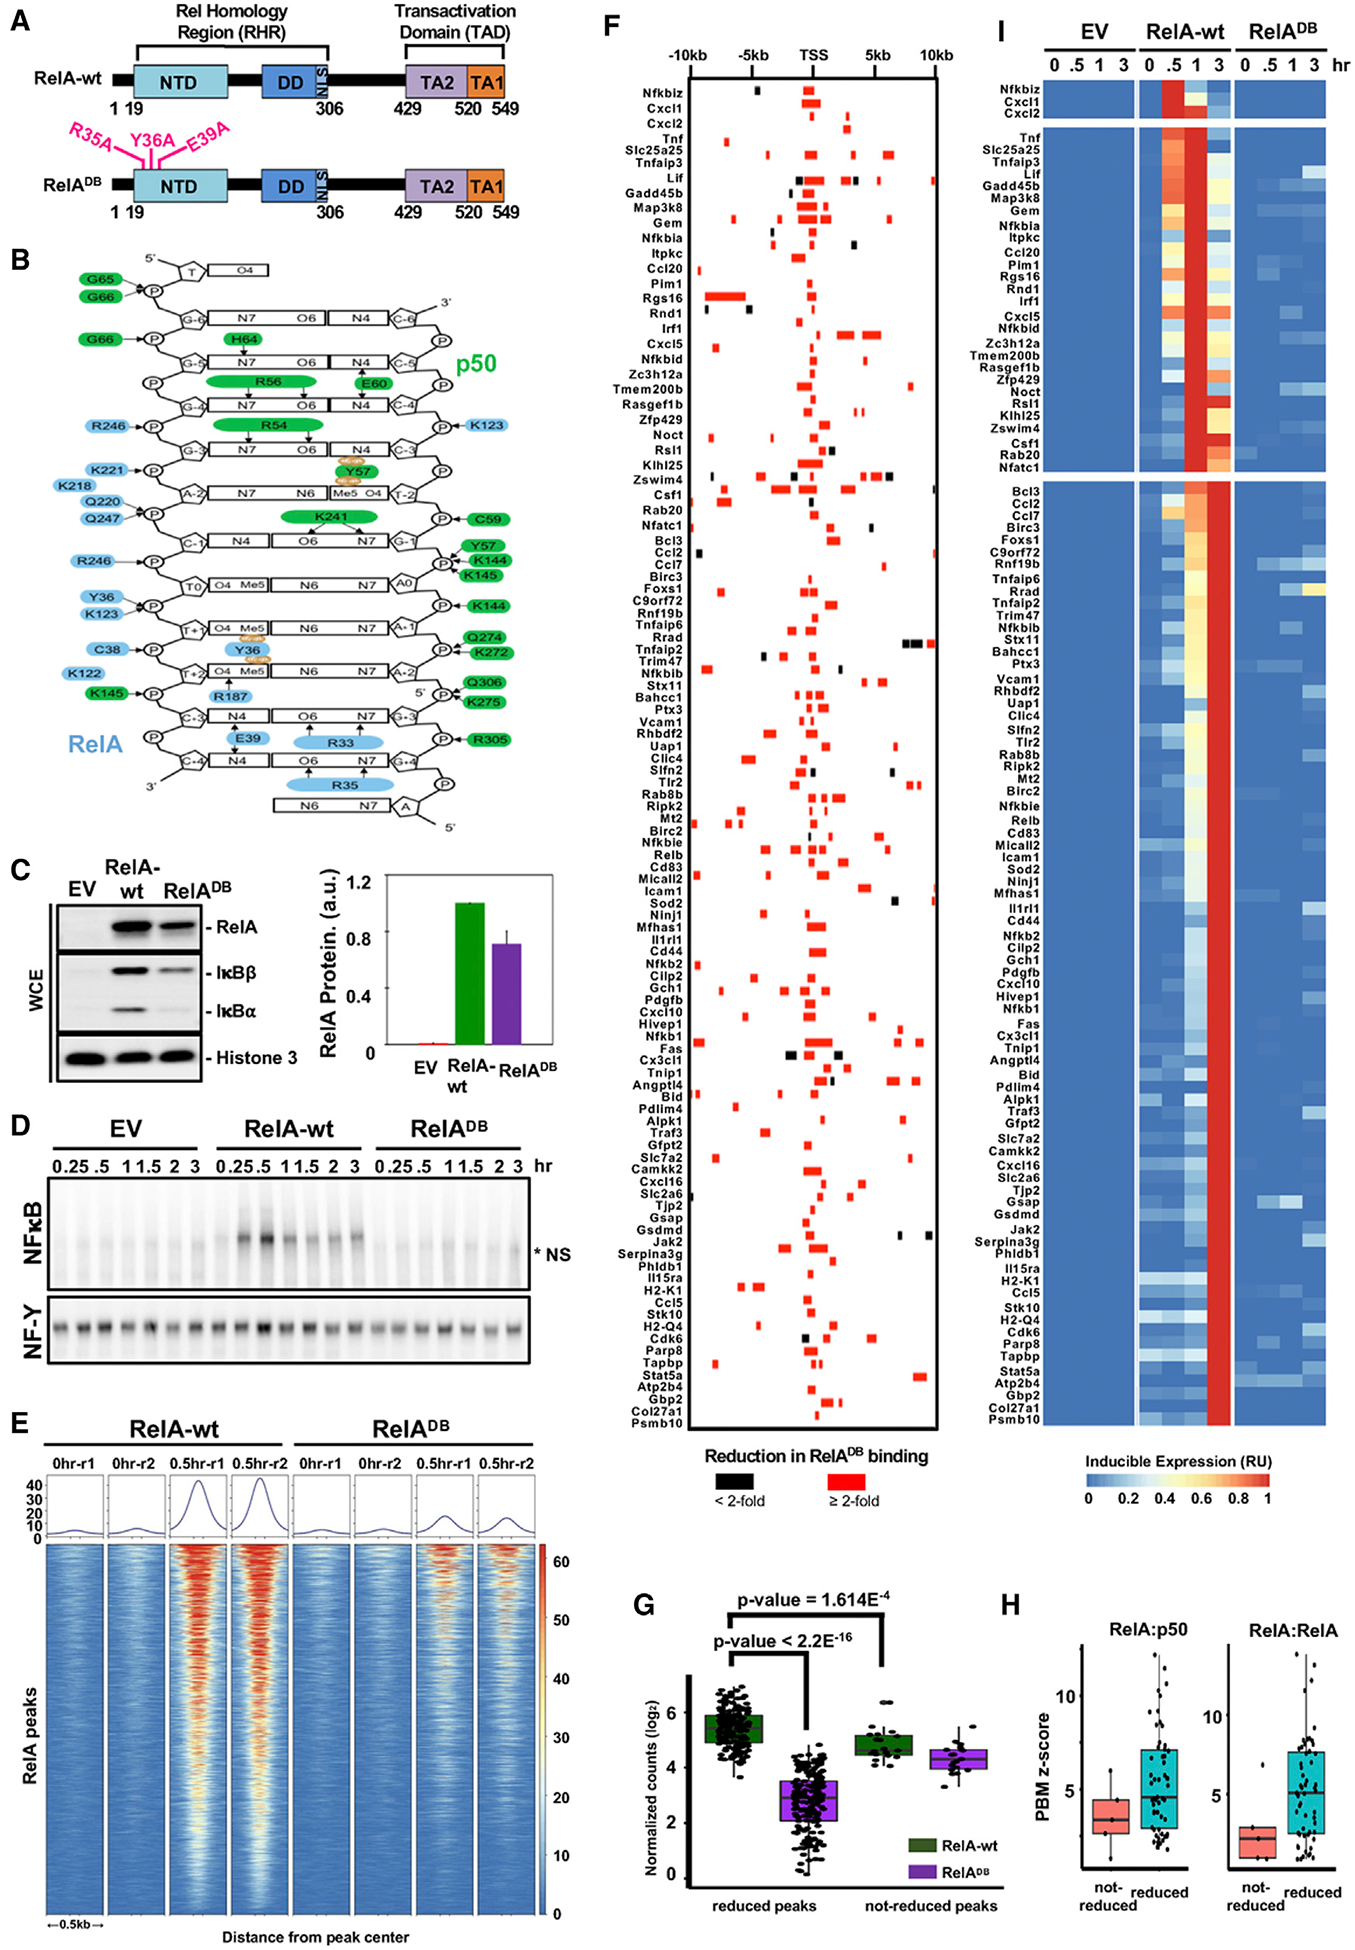
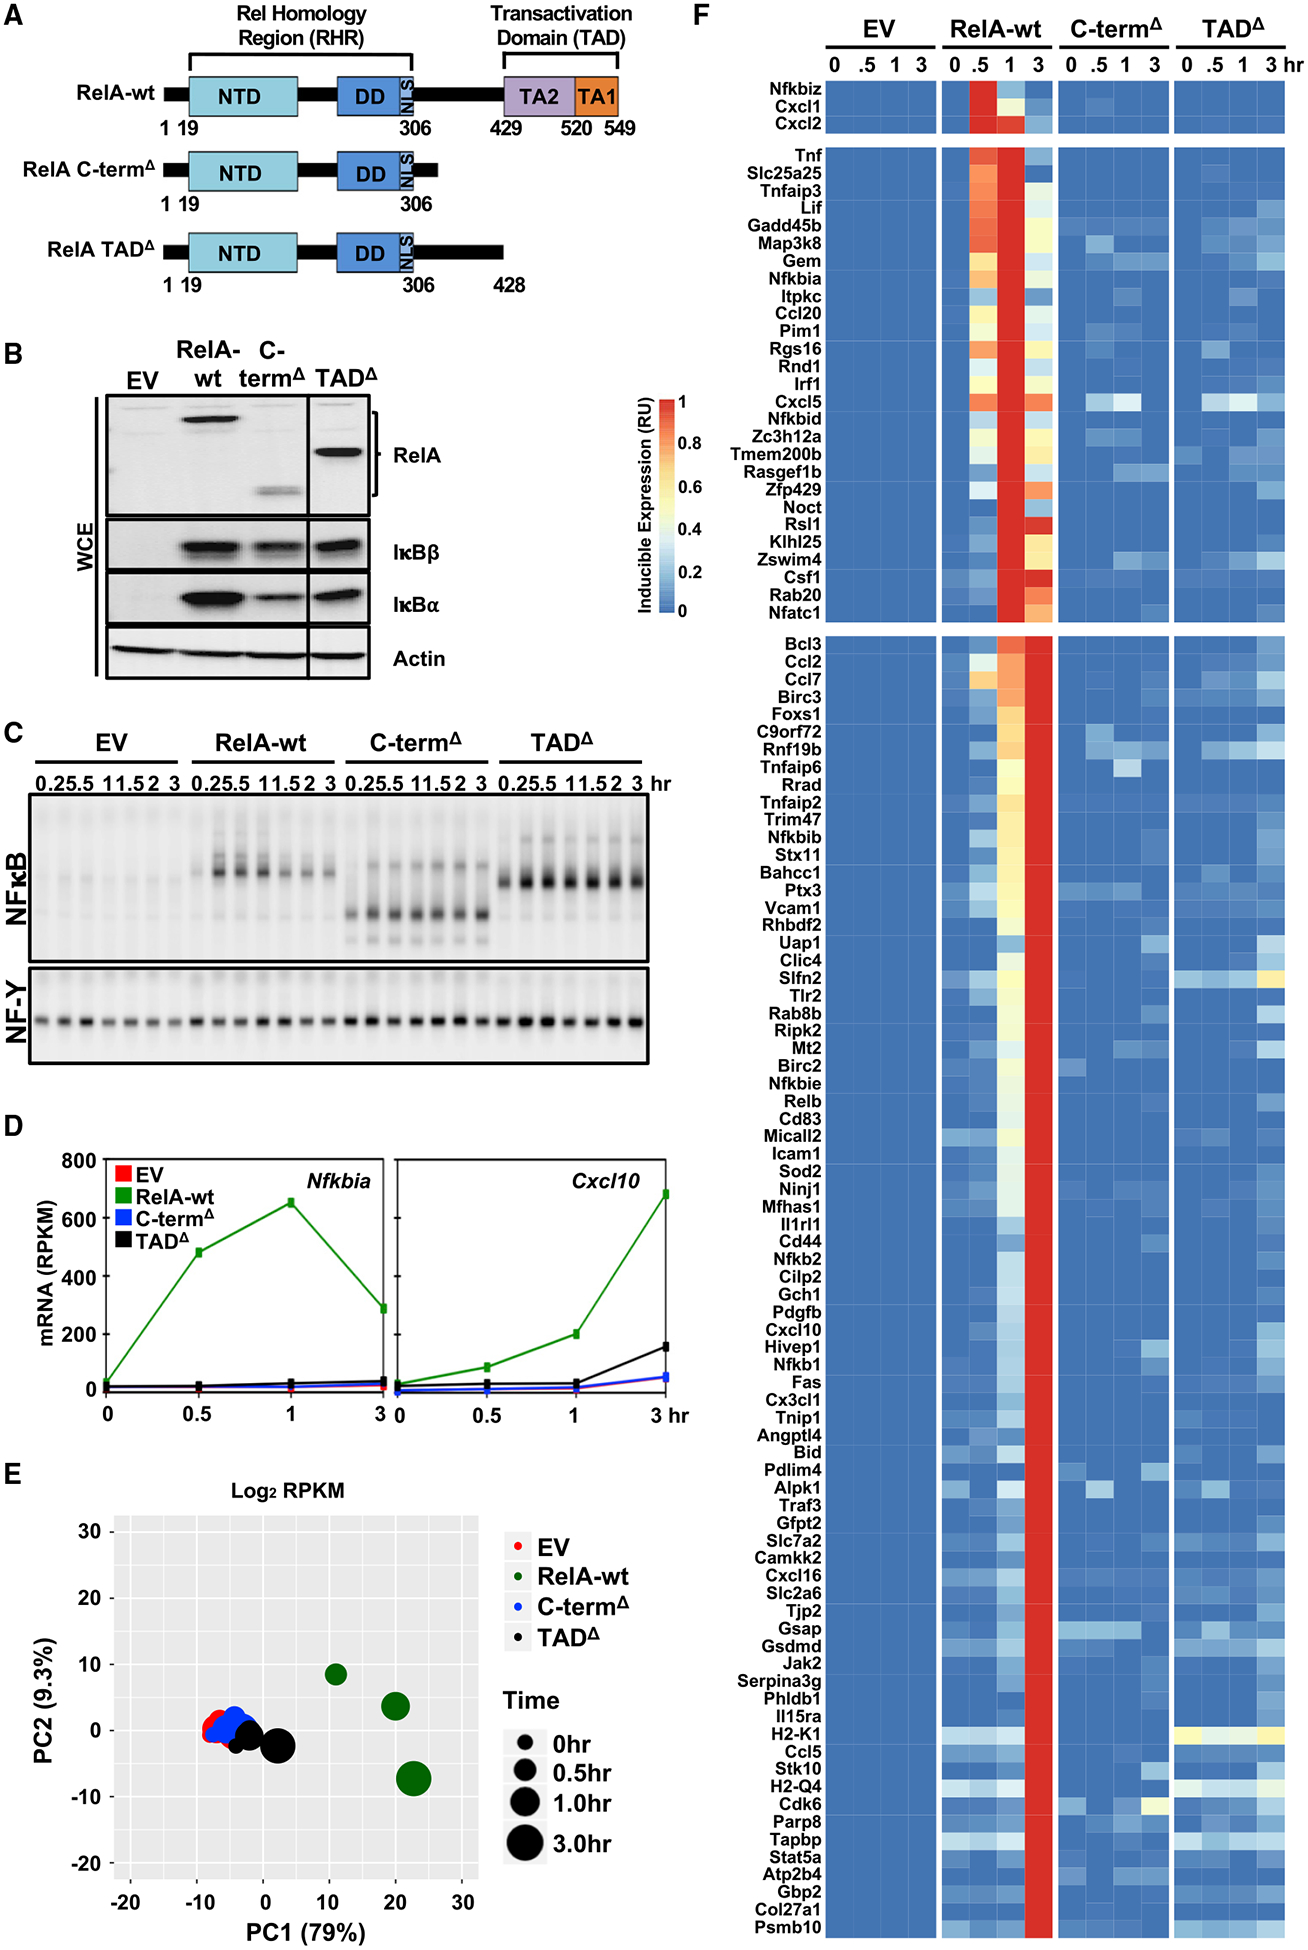
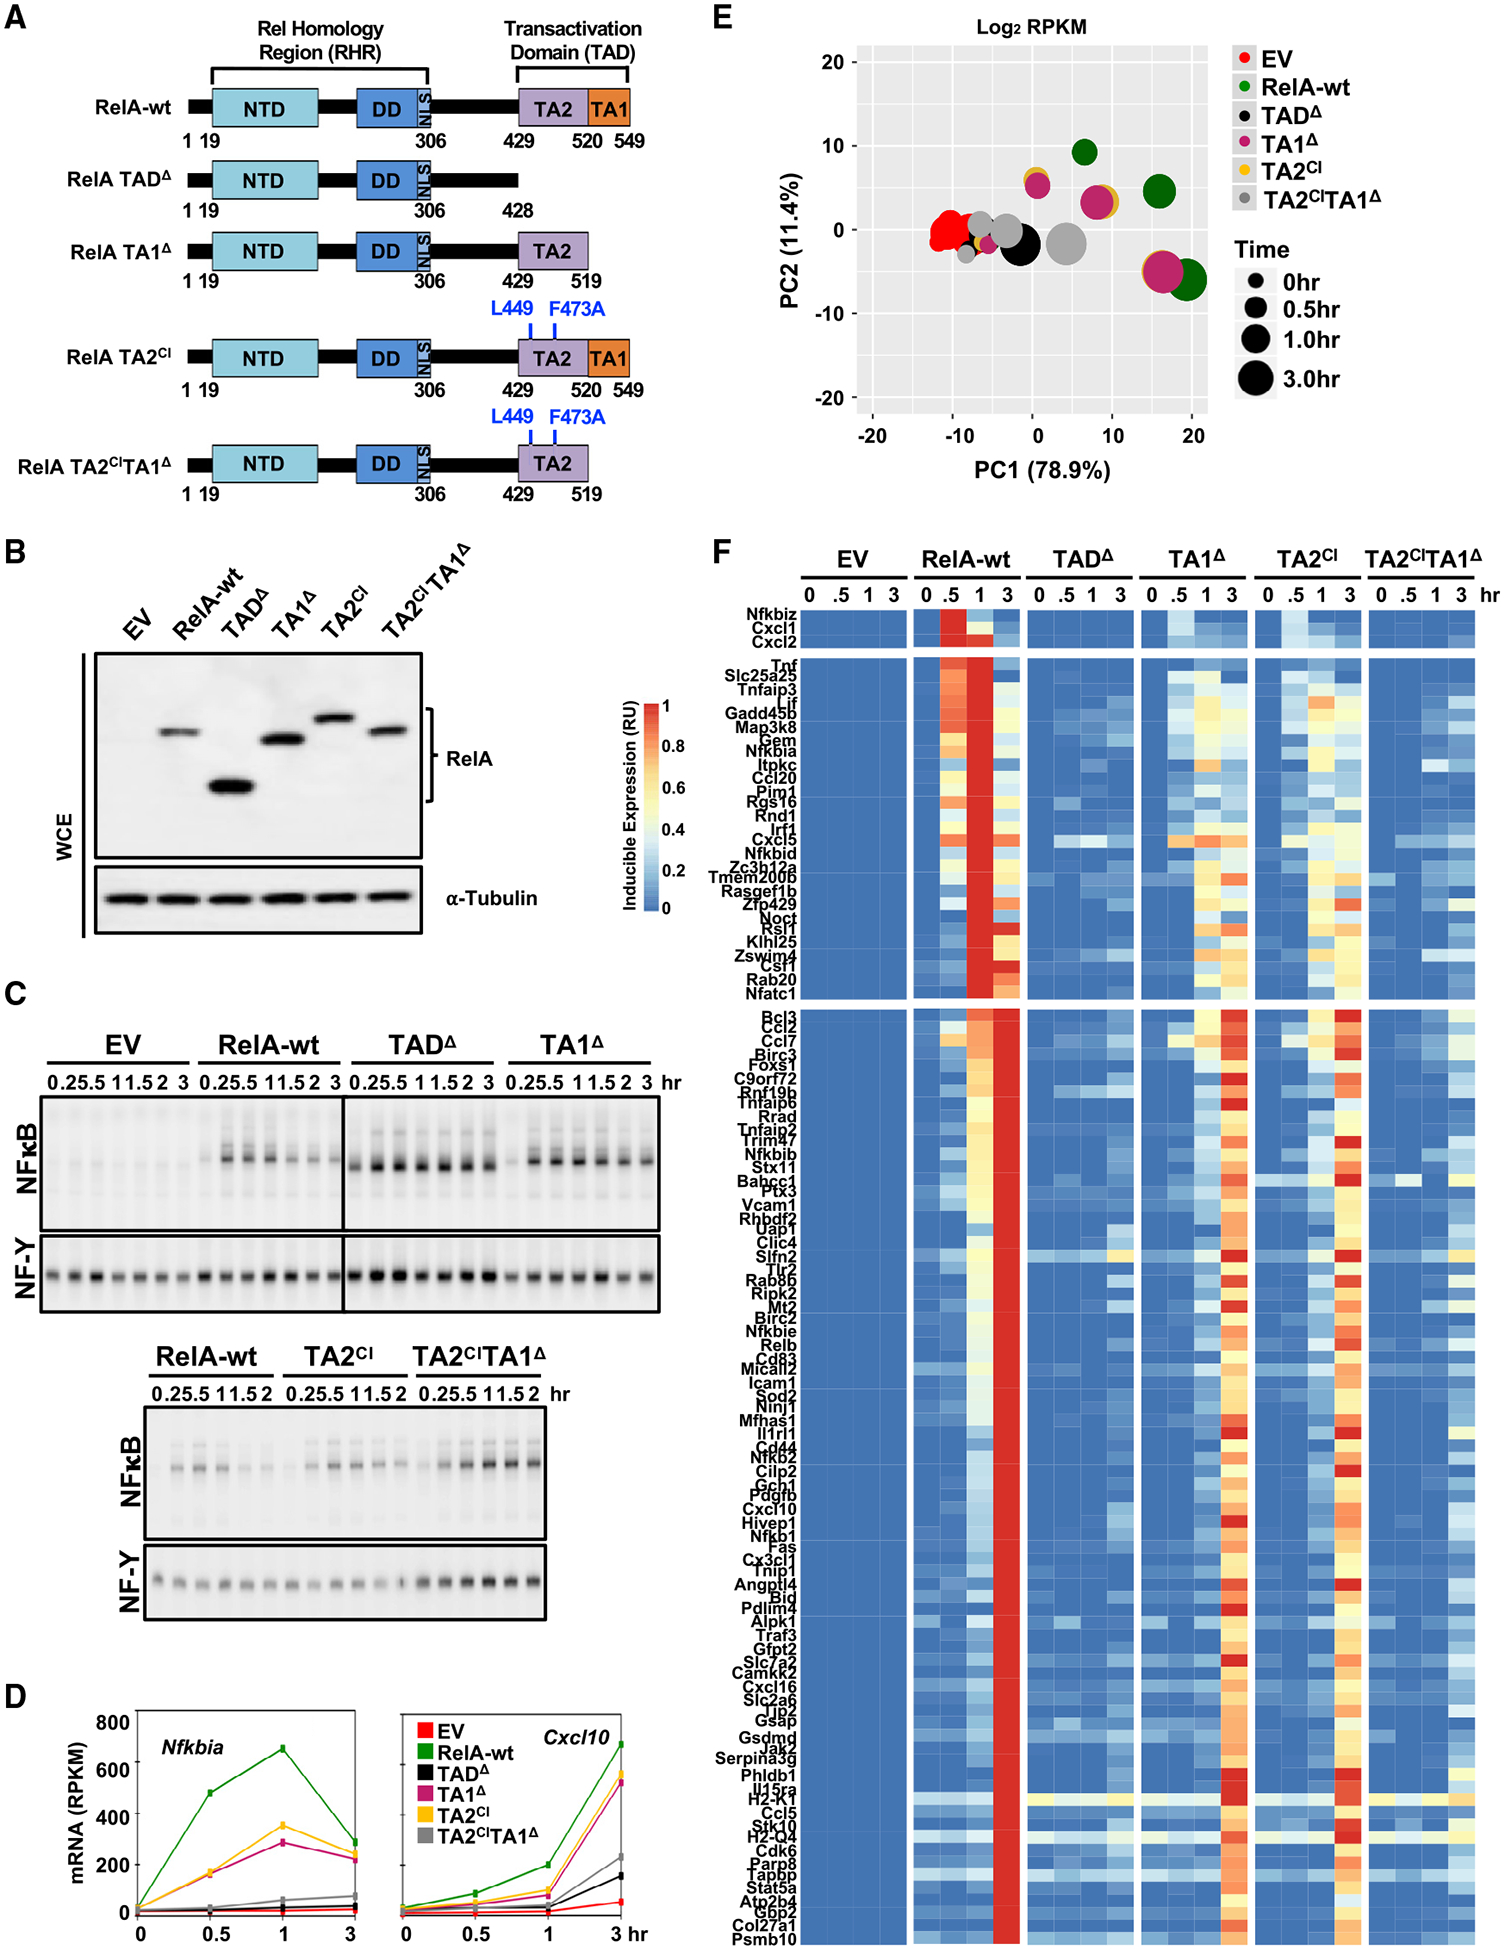
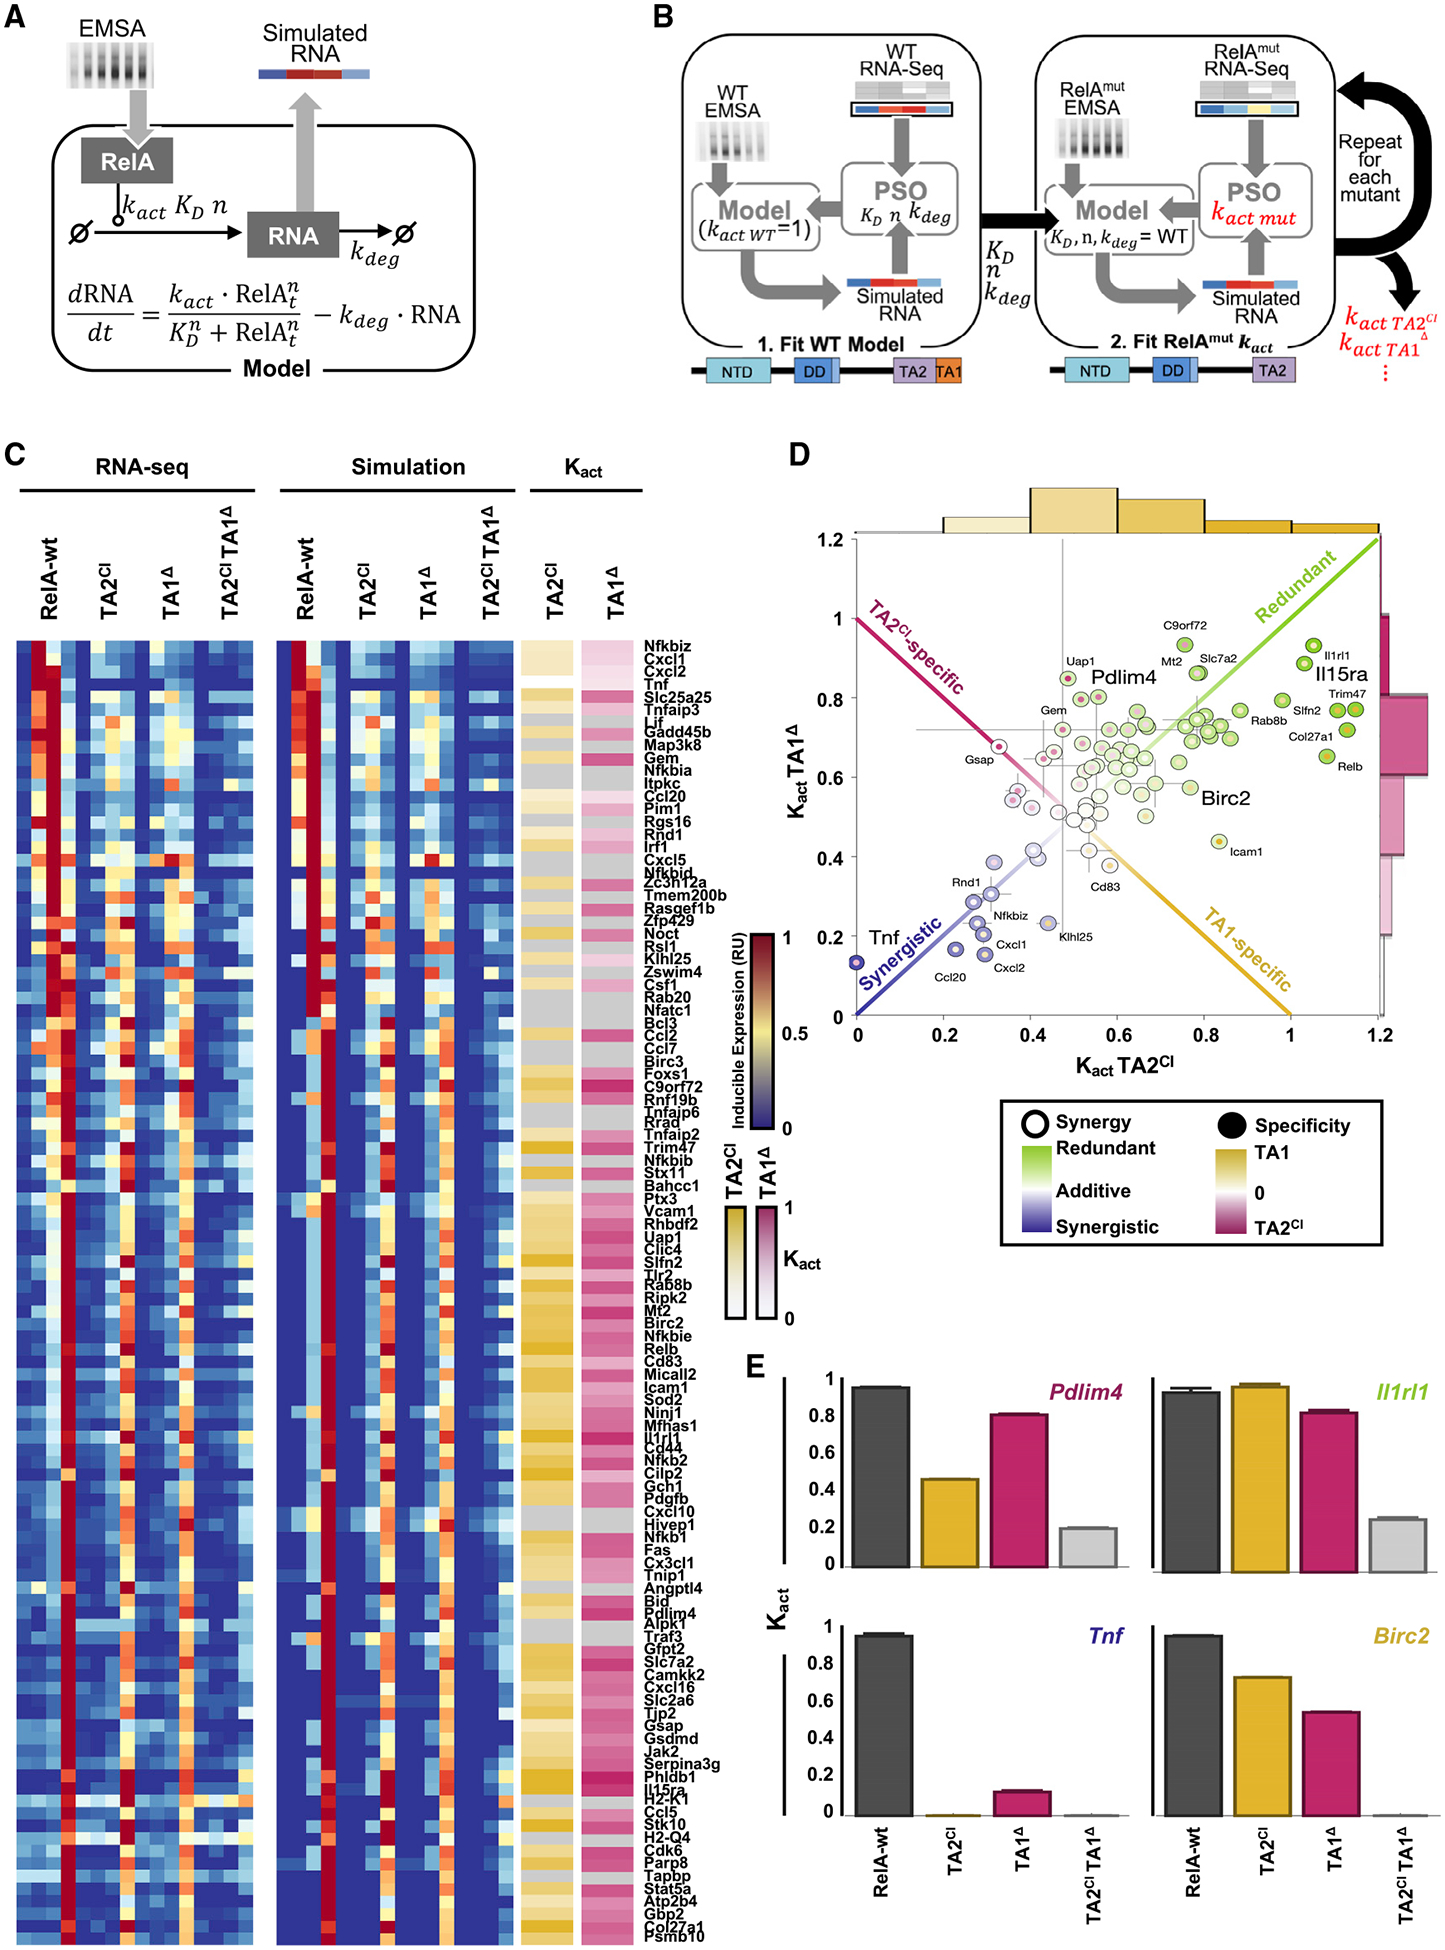
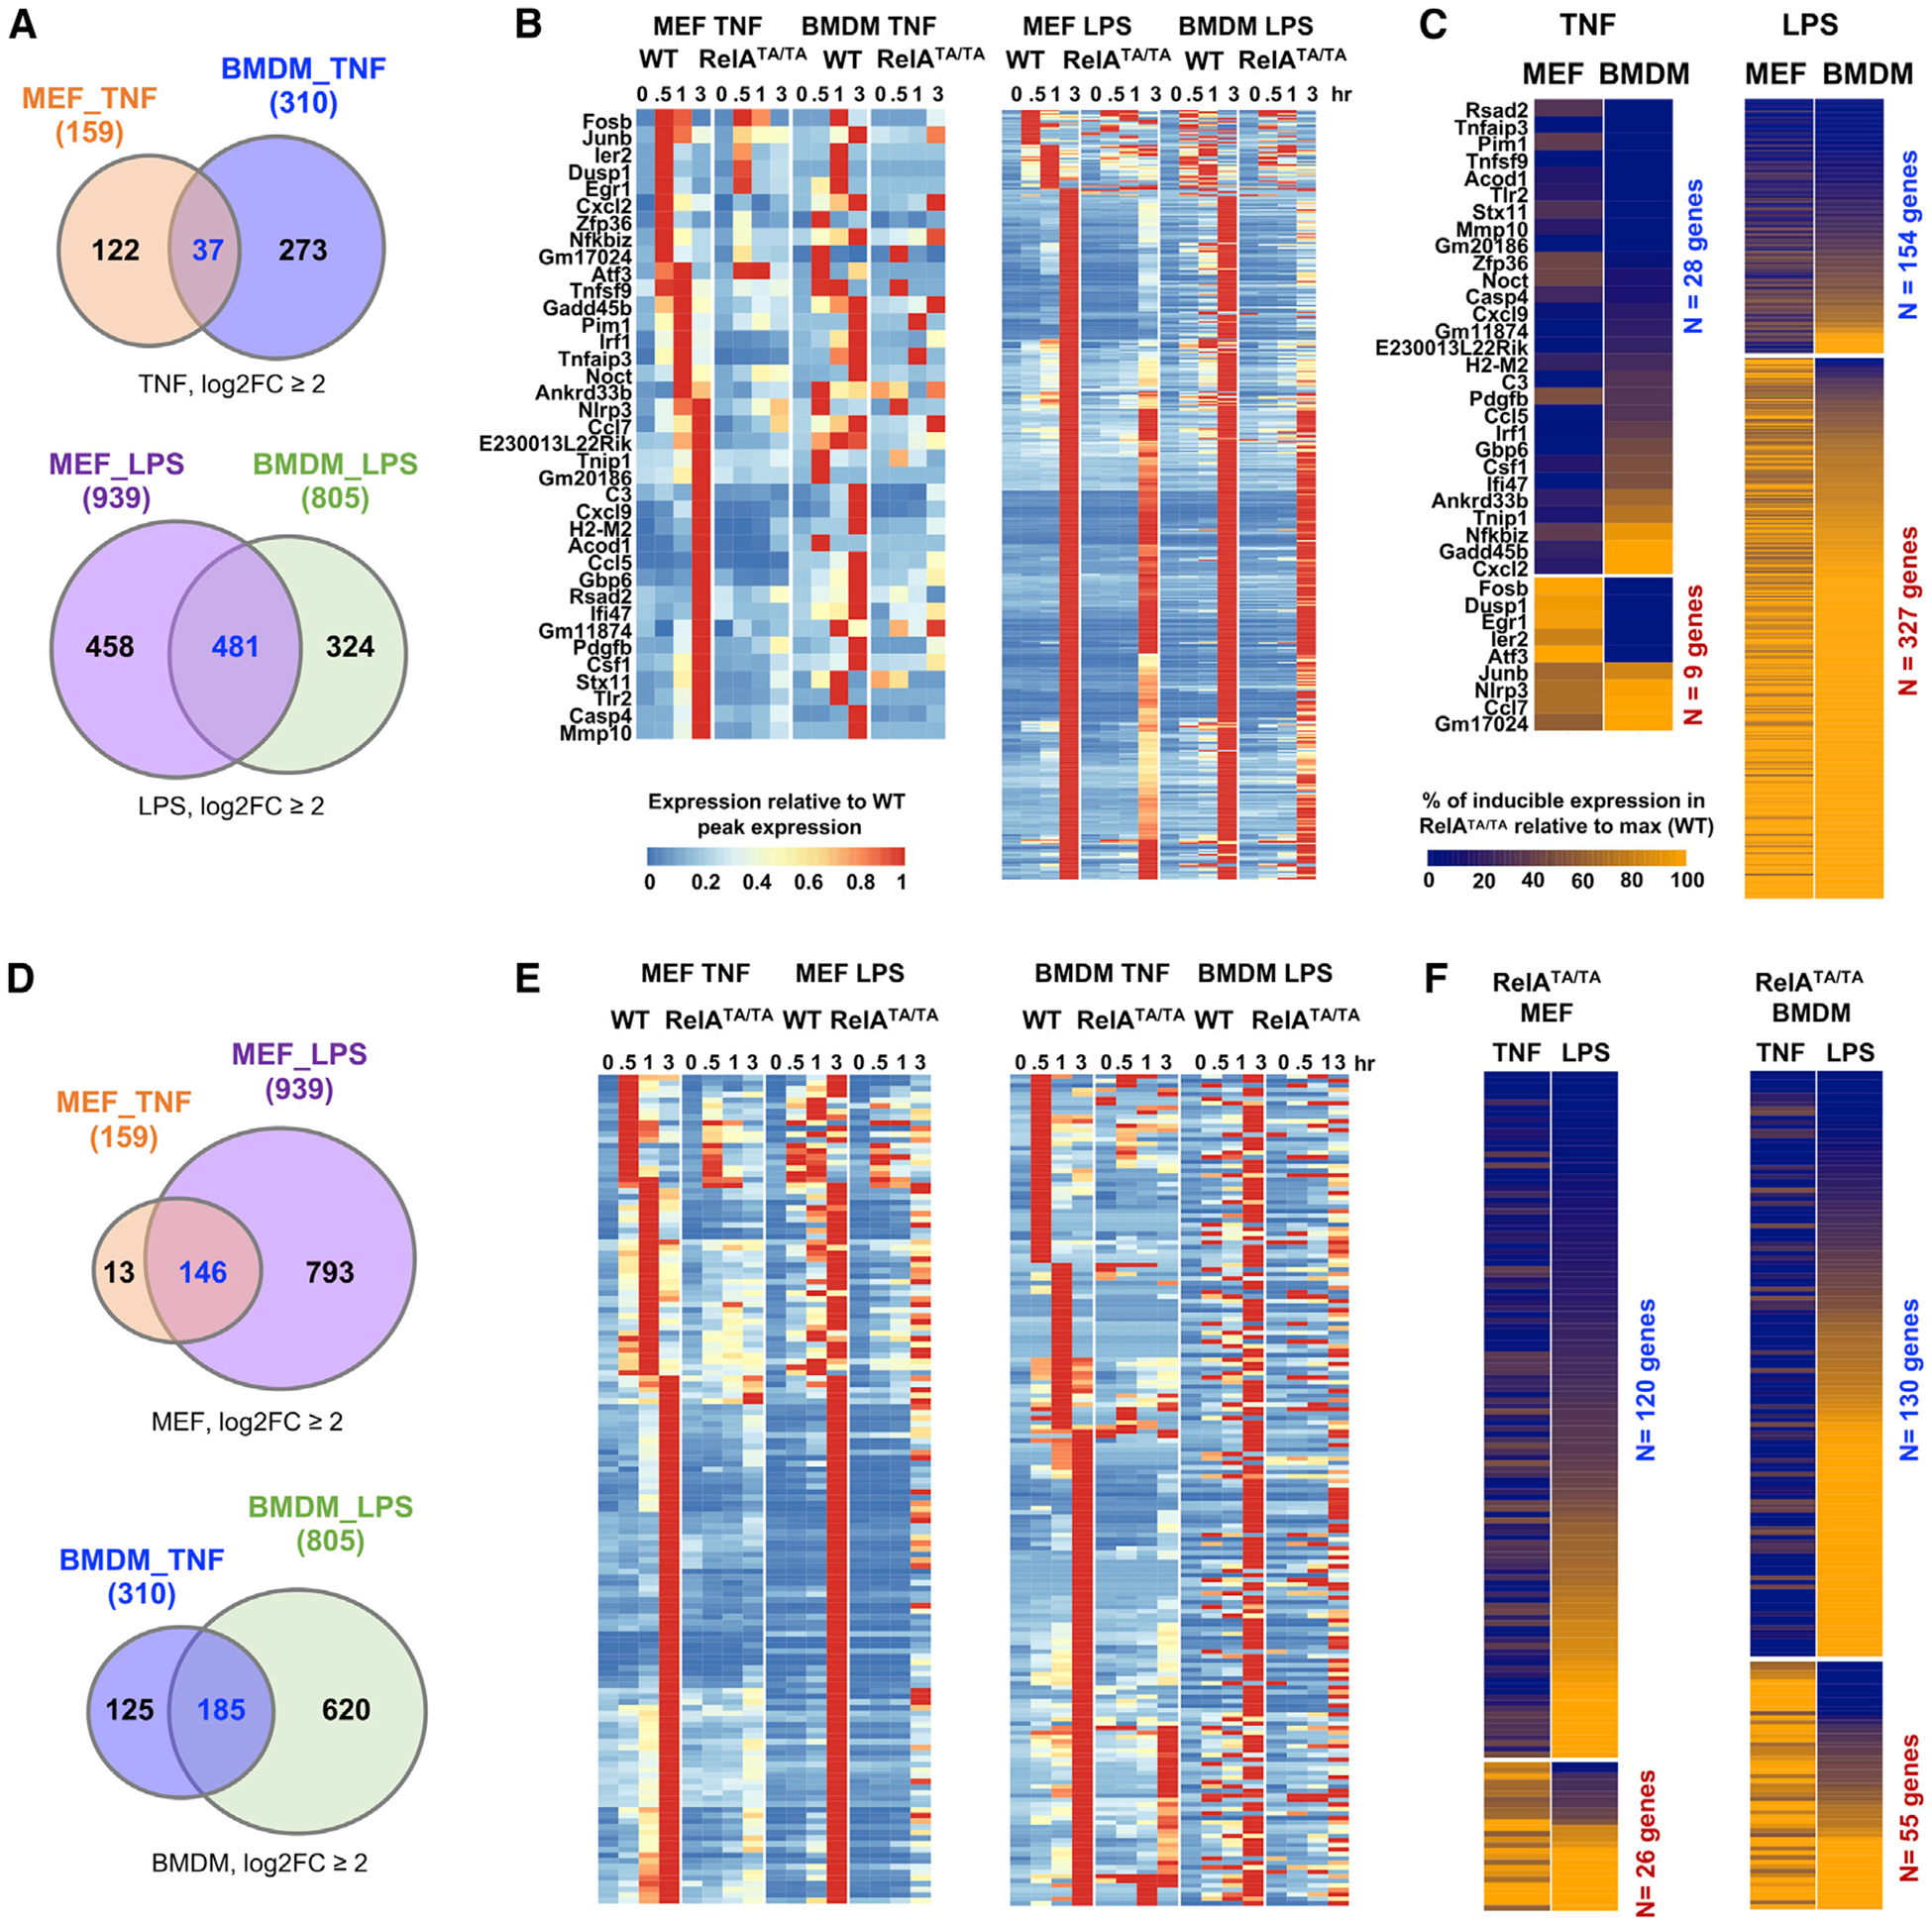
Nuclear factor κB (NF-κB) RelA is the potent transcriptional activator of inflammatory response genes. We stringently defined a list of direct RelA target genes by integrating physical (chromatin immunoprecipitation sequencing [ChIP-seq]) and functional (RNA sequencing [RNA-seq] in knockouts) datasets. We then dissected each gene's regulatory strategy by testing RelA variants in a primary-cell genetic-complementation assay. All endogenous target genes require RelA to make DNA-base-specific contacts, and none are activatable by the DNA binding domain alone. However, endogenous target genes differ widely in how they employ the two transactivation domains. Through model-aided analysis of the dynamic time-course data, we reveal the gene-specific synergy and redundancy of TA1 and TA2. Given that post-translational modifications control TA1 activity and intrinsic affinity for coactivators determines TA2 activity, the differential TA logics suggests context-dependent versus context-independent control of endogenous RelA-target genes. Although some inflammatory initiators appear to require co-stimulatory TA1 activation, inflammatory resolvers are a part of the NF-κB RelA core response.

Keywords: NF-kappaB; NF-κB; gene regulatory strategies; immune response; inflammatory response; mathematical modeling; structure-function analysis; systems biology; transcriptional activation; transcriptional synergy.


Conflict of interest statement

Declaration of Interests The authors declare no competing interests.

Figures

Figure 1.
Figure 1.. Identifying NF-κB RelA Target Genes in the TNF Response of Murine Embryonic Fibroblasts (MEFs)
(A) Genome-wide binding of NF-κB RelA ChIP-seq in WT MEFs stimulated with 10 ng/mL of TNF at 0.5 and 3 h; 9,829 RelA-binding events were identified in two independent replicate experiments. The heatmap shows read density along ±0.5 kB of DNA centered around the peak read density for each binding event and ordered by high to low read density. (B) Left panel: normalized RelA ChIP-seq density over identified peaks within the genome. Right panel: pie chart shows where RelA peaks are found to be located. (C) Genome browser tracks of two replicates (r1 and r2) of RelA ChIP-seq peaks in WT MEFs for two known NF-κB target genes, Nfkbia and Cxcl10. (D) Heatmap of the relative induced expression of 419 nascent transcripts measured by caRNA-seq analysis, whose maximal induced expression was ≥1 RPKM and ≥2-fold over basal. Blue to red indicate low to high expression levels, respectively. Of these 419 genes, 229 genes were protein coding and NF-κB dependent, as their maximal expression was <50% in crel−/− rela−/− compared with WT MEFs. The heatmap of gene expression is ordered by high to low NF-κB dependence. (E) De novo motif and gene ontology analyses for NF-κB-dependent genes identified the most highly enriched motif (within −1.0 to 0.3 kB of the TSS) and GO terms (using Enrichr Ontologies tool [Kuleshov et al., 2016]). For NF-κB-independent genes, top motifs and GO terms showed substantially less significance. (F) Line plots of chromatin-associated RNA (caRNA) abundance in RPKM for known NF-κB target genes, Nfkbia and Cxcl10. (G) Heatmap of mature mRNA (polyA+ RNA-seq) relative induced expression, as in (D), for 113 NF-κB target genes, which were defined by the presence of a RelA ChIP-seq peak and TNF-inducible NF-κB-dependent caRNA expression. Two biological replicates of WT MEFs are shown, ordered by their peak time of expression. (H) Heatmap of the relative induced expression of nascent transcripts determined by caRNA-seq for these 113 NF-κB-dependent genes shown in the same order as in (G). (I) A map of 297 RelA-binding peaks identified by ChIP-seq for each of the 113 NF-κB target genes within ±10 kB of the TSS, shown in the same order as in (G) and (H).
Figure 2.
Figure 2.. A RelA Genetic Complementation System for Studying the Control of Endogenous NF-κB RelA Target Genes
(A) Schematic of the domain structure of the mouse RelA protein (with relevant amino acid numbers) and the primary cells to be complemented and the experimental assays to be performed. (B) Genome browser tracks of RelA binding events on the Nfkbia and Cxcl10 genes in WT MEFs and p53−/− crel−/− rela−/− MEFs reconstituted with RelA-wt, data from two independent experiments (r1 and r2) are shown. (C) Heatmap of the read density along ±0.5 kB of RelA ChIP-seq peaks after 0.5 h of TNF treatment for 104 genes identified as NF-κB-dependent genes in WT MEFs and p53−/− crel−/− rela−/− MEFs reconstituted with RelA-wt. (D) Line plots of mRNA expression in RPKM of Nfkbia and Cxcl10 genes analyzed by polyA+ RNA-seq. (E) Heatmap of relative induced expression in reconstituted RelA-wt and empty vector (EV) in p53−/− crel−/− rela−/− MEFs, as determined by polyA+ RNA-seq. Two independent experiments are shown. (F) A map of the NF-κB binding sites (kB DNA sequences) within each of the 223 RelA ChIP-seq peaks identified with an FDR < 0.01 and associated with the 104 NF-κB target genes. Full κB elements refer to 9-, 10-, and 11-bp sequences conforming to the consensus: 5′-GGR(N3–5)YCC-3′, where R = A or G; Y = C or T; N = any nucleotide (A, C, G, or T). Half-κB elements refer to 5′-GGR-3′ and 5′-YCC-3′.
Figure 3.
Figure 3.. High-Affinity Binding by RelA Is Required for the TNF-Induced Expression of All NF-κB Target Genes
(A) Schematic representation of the targeted mutations in the DNA binding mutant of murine RelA (R35A, Y36A, and E39A). (B) Schematic of the κB DNA contacts made by RelA:p50 NF-κB heterodimer, adapted from Chen et al. (1998a). The heterodimer structure reveals base-specific contacts made by specific amino acids in the RelA protein, indicating the critical roles of R35, Y36, and E39. Arrows denote hydrogen bonds; brown ovals indicate Van der Waals contacts. (C) Protein expression of RelA, IκBβ, IκBα, and histone 3 as loading control, by immunoblot in unstimulated cells genetically complemented with indicated EV, RelA-wt, and RelADB. Quantified protein expression is shown on the right. Error bars represent the standard deviation from two independent experiments. (D) Analysis of nuclear NF-κB activity by EMSA with κB and NF-Y (loading control) probes of nuclear extracts prepared at indicated times after TNF stimulation of genetically complemented cells shown in (C). The data are representative of two independent experiments. *NS, non-specific band. (E) Heatmap density shows RelA ChIP-seq peaks at 9,829 locations defined in Figure 1A, in genetically complemented (RelA-wt and RelADB) p53−/− crel−/− rela−/− MEFs in response to 0.5 h of TNF stimulation. (F) A map of RelA binding events associated with 104 NF-κB target genes indicating whether RelA binding is reduced ≥2-fold in the RelADB mutant (red bar). (G) Quantification and comparison of RelA peaks shown in (F). Averaged normalized counts from two replicates of RelA ChIP-seq experiments in RelA-wt or RelADB expressing MEFs are plotted to compare RelA peaks that are highly dependent on high-affinity binding by RelA versus those that are less dependent. For each category, Mann-Whitney U-test results indicate that peaks less dependent on high-affinity binding by RelA show a lower read count in RelA-wt control cells. (H) Correlation between RelA ChIP-seq peaks and protein-binding microarray (PBM)-determined z-scores of the strongest-κB binding-site sequences for RelA:p50 and RelA:RelA dimers retrieved from Siggers et al (2011). Of the seven 10-bp κB site sequences within not-reduced RelA peaks; the five with the strongest z-scores were plotted. (I) Heatmap for the transcriptional TNF response of the 104 target genes in genetically complemented RelA-wt and RelADB cells, analyzed by polyA+ RNA-seq.
Figure 4.
Figure 4.. The RelA C-Terminal Portion Is Required for TNF Induction of All NF-κB Target Genes
(A) Schematic illustrates the RelA variants to be tested: RelA C-termΔ (aa 1–325) and RelA TADΔ (aa 1–428). (B) Protein expression of RelA, IκBβ, IκBα, and actin as loading controls in the indicated, unstimulated cells assayed by immunoblotting. (C) Analysis of nuclear NF-κB activity by EMSA with κB and NF-Y (loading control) probes of nuclear extracts prepared at the indicated times after TNF stimulation of genetically complemented cells shown in (B). The data are representative of two independent experiments. (D) Line plots of mRNA expression for NF-κB target genes, Nfkbia and Cxcl10, in response to TNF in the same cells. (E) PCA plot of all 104 NF-κB target genes in response to TNF in the same cells. (F) Heatmap of the transcriptional response to TNF of the 104 target genes in the same cells. Relative induced expression is shown. The data shown in (D), (E), and (F) are averaged RPKM from two independent polyA+ RNA-seq experiments.
Figure 5.
Figure 5.. RelA Transactivation Domains TA1 and TA2 Both Contribute to the TNF Response of NF-κB Target Genes
(A) The schematic illustrates the RelA variants to be tested: a deletion mutant of TA1, a CBP-interaction mutant of TA2 (TA2CI) and a combination mutant. (B) Protein expression of RelA and α-tubulin as loading control, in indicated unstimulated cells assayed by immunoblotting with antibodies specific to RelA and α-Tubulin. (C) Analysis of nuclear NF-κB activity by EMSA with κB and NF-Y (loading control) probes of nuclear extracts prepared at the indicated times after TNF stimulation of genetically complemented cells shown in (B). The data are representative of two independent experiments. (D) Line plots of mRNA expression for Nfkbia and Cxcl10 genes in response to TNF stimulation in the same cells. (E) PCA plot of all 104 NF-κB target genes in response to TNF in the same cells. (F) Heatmap of the transcriptional response of the 104 target genes in the same cells. Relative induced expression is shown. The data shown in (D), (E), and (F) are the averaged RPKM from two independent experiments of EV, RelA-wt, TADΔ, and TA1Δ and 1 polyA+ RNA-seq replicate of TA2CI and TA2CITA1Δ.
Figure 6.
Figure 6.. A Math Model-Aided Analysis Reveals Gene-Specific Requirements for TA1 and TA2
(A) Schematic of the ordinary differential equation (ODE) used to obtain simulated mRNA dynamics from quantified NF-κB activity time courses. (B) Schematic of the particle swarm optimization (PSO) pipeline used to quantify the activation strengths (kact) for TAD mutants. First KD, nhill, kdeg are fit to RelA-wt data with kact = 1. The identified parameters are then maintained with the new kact fit for each TAD mutant to obtain the remaining activation strength (see Method Details). (C) Experimental (left, RNA-seq) and simulated best-fit mRNA time-course (middle) heatmaps, along with identified kact for TA2CI (yellow) and TA1Δ (pink). kact is shown relative to RelA-wt with brighter colors indicating closer activity to RelA-wt (no effect of mutation) and white indicating complete loss of activity in the mutant (kact = 0). Gray indicating a fit with ln (dist) < − 2:5 (see Method Details) was not found. (D) Scatterplot of kact for TA2CI and TA1Δ for 76 genes with a good fit in (C). Center color represents the effect of either a single mutation (from green kact = 1 with no change from RelA-wt and redundancy with respect to a single mutation, to blue kact = 0 where either mutation abrogates gene induction and both domains work synergistically to achieve full gene activation). Border colors represent an off-diagonal effect in which a gene shows a specific loss of induction in TA2CI (pink) or TA1Δ (yellow). Gray lines indicate the standard deviation of kact from three repeated runs of optimization pipeline. (E) Bar graphs of kact (relative to the mean RelA-wt kact) for RelA-wt, TA2CI, TA1Δ, and TA2CITA1Δ mutants, shown for four example genes arranged to indicate their relative positions in (D). Error bars indicate standard deviations of kact from three repeated runs of optimization pipeline.
Figure 7.
Figure 7.. A Knockin Mouse Reveals that the Dual TAD Requirement Pertains to Other Cell Types and Stimuli
(A) Venn diagrams display overlap in induced transcriptional response in MEFs and BMDMs. Induced genes satisfy two criteria: log2 fold-change ≥2 and maximum RPKM >1, by polyA+ RNA-seq during a 3-h time-course analysis. In response to TNF, 159 genes are induced in WT MEFs and 310 are induced in WT BMDMs (left panel). In response to LPS, 939 genes are induced in WT MEFs and 805 induced genes in WT BMDMs (right panel). (B) Heatmaps of relative expression of the induced genes in WT and RelATA/TA mutant MEFs or BMDMs in response to TNF (left panel) or LPS (right panel). Gene names and data plotted in heatmaps are listed in Tables S2A and S2B for TNF and LPS, respectively. (C) RelA-TAD dependence of induced genes: percentage of peak expression in RelATA/TA mutant versus WT. Genes are rearranged by their TAD dependence in TNF stimulation and further re-arranged in each category by LPS response. Genes induced by TNF in MEFs and BMDMs (left panel). Gene names and data plotted in heatmap are listed in Table S2C. Genes induced by LPS in MEFs and BMDMs. Gene names and data plotted in heatmap are listed in Table S2D (right panel). (D) Venn diagrams displays overlap in induced transcriptional response to TNF and LPS. In WT MEFs, 159 genes were induced by TNF and 939 by LPS (left panel). In WT BMDMs, 310 genes were induced by TNF and 805 were induced by LPS (right panel). (E) Heatmaps of relative expression of TNF- versus LPS-induced genes in WT and RelATA/TA mutant MEFs (left panel) or BMDMs (right panel). Gene names and data plotted in the heatmap are listed in Tables S3A and S3B for MEFs and BMDMs, respectively. (F) NF-κB dependence of induced genes: percentage of peak expression in RelATA/TA mutant versus WT. Genes induced by MEFs by TNF and LPS (left panel). Gene names and data plotted in heatmap are listed in Table S3C. Genes induced by BMDMs by TNF and LPS (right panel). Gene names and data plotted in heatmap are listed in Table S3D.

References

    1. Bae JS, Jang MK, Hong S, An WG, Choi YH, Kim HD, and Cheong J (2003). Phosphorylation of NF-κ B by calmodulin-dependent kinase IV activates anti-apoptotic gene expression. Biochem. Biophys. Res. Commun 305, 1094–1098. - PubMed
    1. Baeuerle PA, and Baltimore D (1989). A 65-kD subunit of active NF-κB is required for inhibition of NF-κB by I κB. Genes Dev 3, 1689–1698. - PubMed
    1. Ballard DW, Dixon EP, Peffer NJ, Bogerd H, Doerre S, Stein B, and Greene WC (1992). The 65-kDa subunit of human NF-κ B functions as a potent transcriptional activator and a target for v-Rel-mediated repression. Proc. Natl. Acad. Sci. USA 89, 1875–1879. - PMC - PubMed
    1. Bao X, Indukuri H, Liu T, Liao SL, Tian B, Brasier AR, Garofalo RP, and Casola A (2010). IKKε modulates RSV-induced NF-κB-dependent gene transcription. Virology 408, 224–231. - PMC - PubMed
    1. Basak S, Behar M, and Hoffmann A (2012). Lessons from mathematically modeling the NF-κB pathway. Immunol. Rev 246, 221–238. - PMC - PubMed

Publication types

Substances