. 2020 Feb 24;9(2):511.
doi: 10.3390/cells9020511.

(R)-Salbutamol Improves Imiquimod-Induced Psoriasis-Like Skin Dermatitis by Regulating the Th17/Tregs Balance and Glycerophospholipid Metabolism

Affiliations

(R)-Salbutamol Improves Imiquimod-Induced Psoriasis-Like Skin Dermatitis by Regulating the Th17/Tregs Balance and Glycerophospholipid Metabolism

Fei Liu et al. Cells. .

Abstract

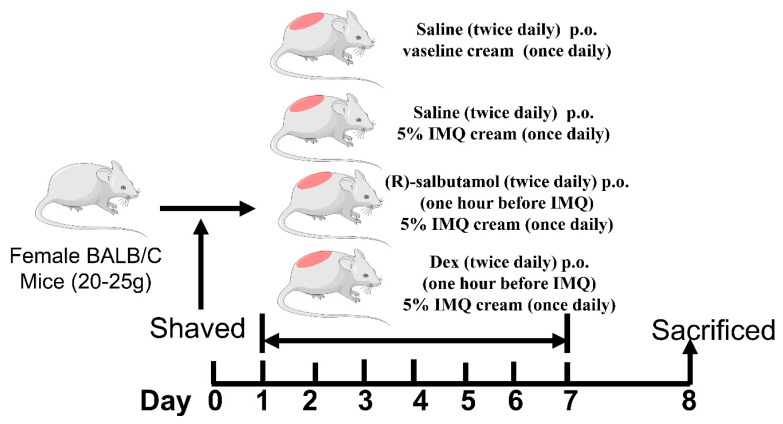
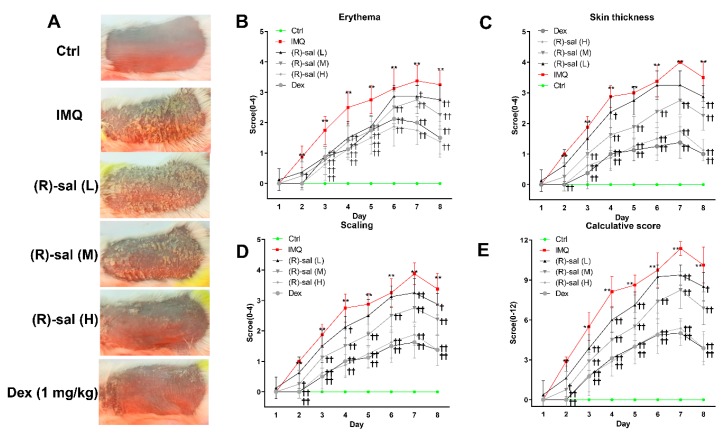
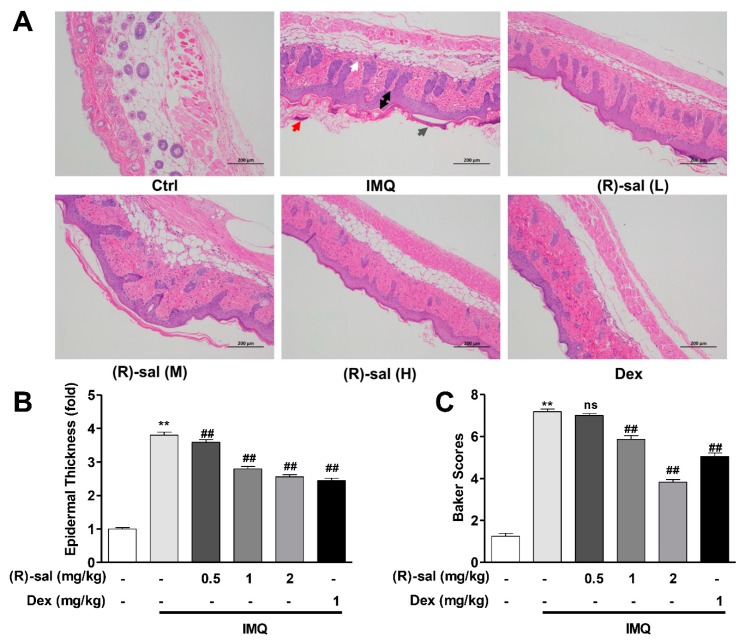
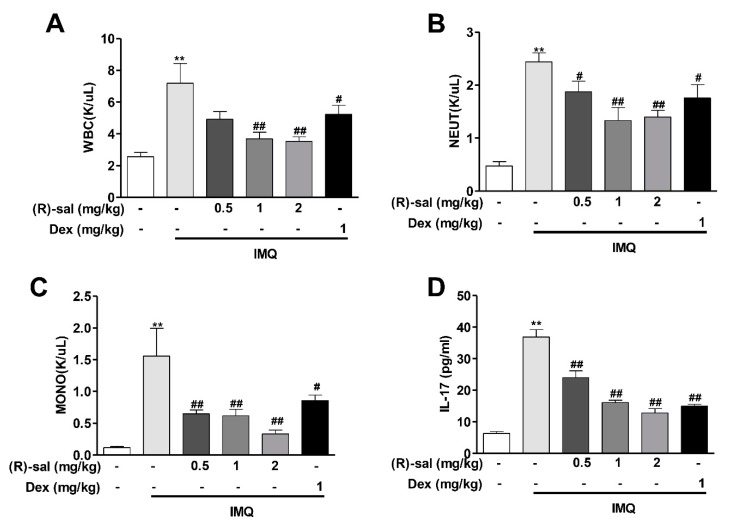
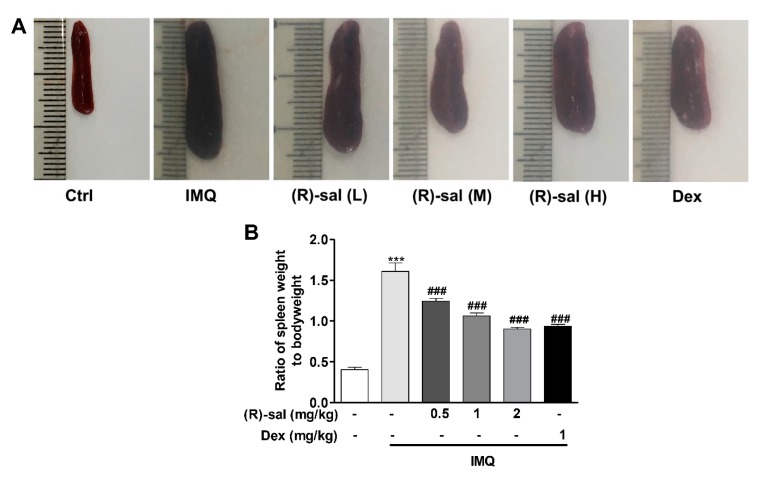
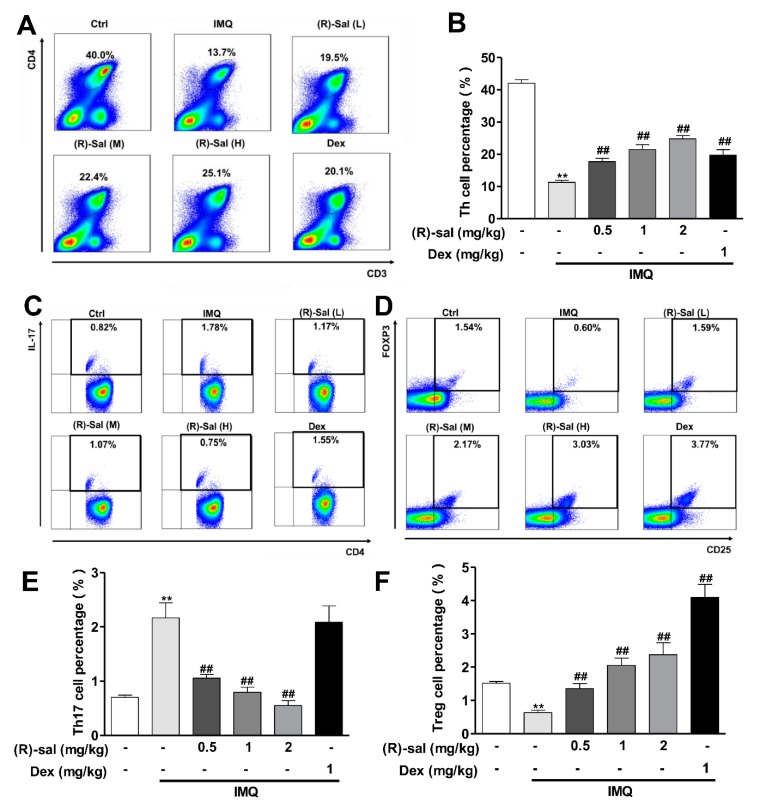
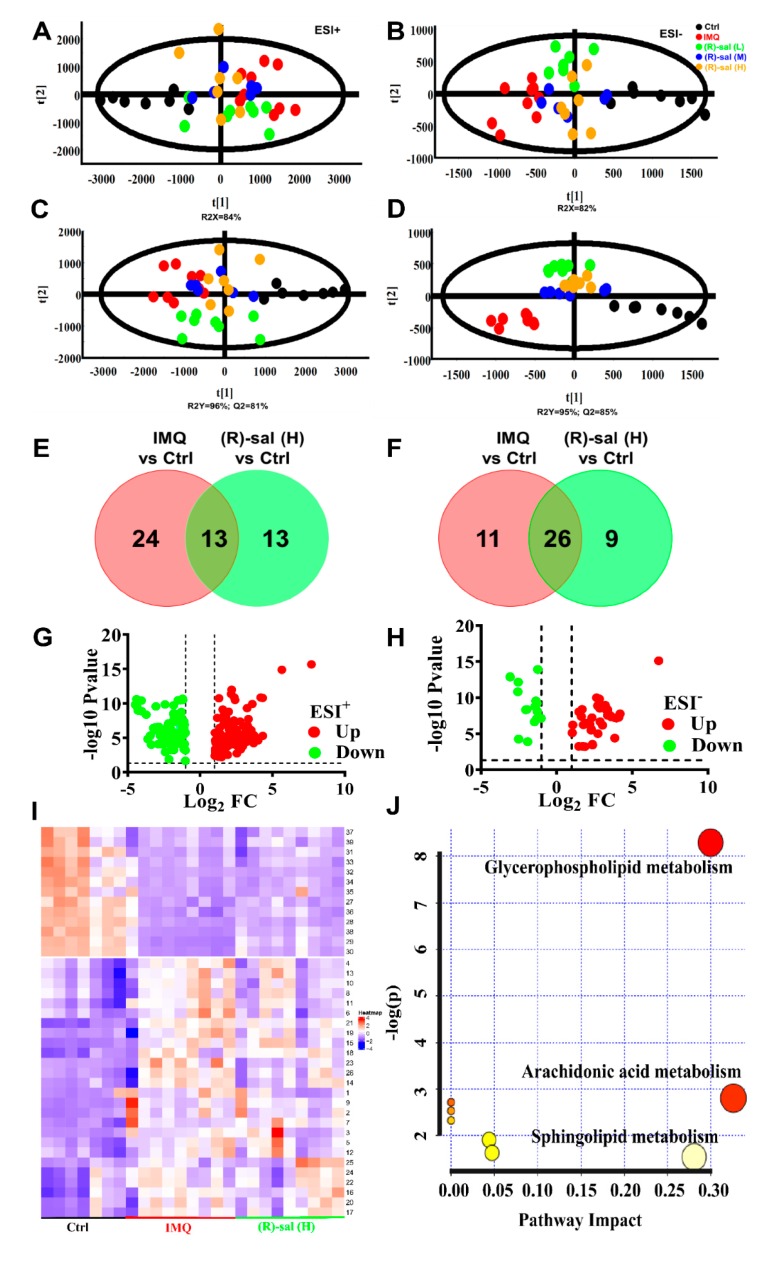
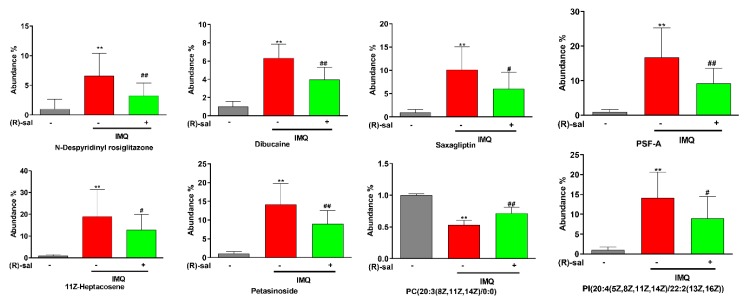
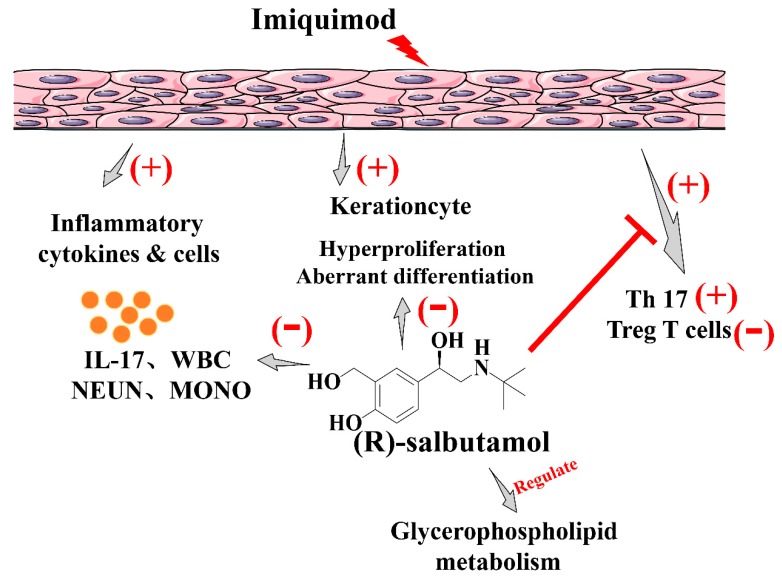
Psoriasis is a skin disease that is characterized by a high degree of inflammation caused by immune dysfunction. (R)-salbutamol is a bronchodilator for asthma and was reported to alleviate immune system reactions in several diseases. In this study, using imiquimod (IMQ)-induced mouse psoriasis-like dermatitis model, we evaluated the therapeutic effects of (R)-salbutamol in psoriasis in vivo, and explored the metabolic pathway involved. The results showed that, compared with IMQ group, (R)-salbutamol treatment significantly ameliorated psoriasis, reversed the suppressive effects of IMQ on differentiation, extreme keratinocyte proliferation, and infiltration of inflammatory cells. Enzyme-linked immunosorbent assays (ELISA) showed that (R)-salbutamol markedly reduced the plasma levels of IL-17. Cell analysis using flow cytometry showed that (R)-salbutamol decreased the proportion of CD4+ Th17+ T cells (Th17), whereas it increased the percentage of CD25+ Foxp3+ regulatory T cells (Tregs) in the spleens. (R)-salbutamol also decreased the weight ratio of spleen to body. Furthermore, untargeted metabolomics showed that (R)-salbutamol affected three metabolic pathways, including (i) arachidonic acid metabolism, (ii) sphingolipid metabolism, and (iii) glycerophospholipid metabolism. These results demonstrated that (R)-salbutamol can alleviate IMQ-induced psoriasis through regulating Th17/Tregs cell response and glycerophospholipid metabolism. It may provide a new use of (R)-salbutamol in the management of psoriasis.

Keywords: (R)-salbutamol; Th17/Tregs; immune-regulation; metabolomics; psoriasis.


Conflict of interest statement

The authors declare no conflict of interest.

Figures

Figure 1
Figure 1
Experimental procedure of the antipsoriatic activity evaluation of (R)-salbutamol or Dex. one hour after the administration of different doses of (R)-salbutamol or Dex twice per day, mice in all groups except for the control group received a daily topical dose of 62.50 mg of the imiquimod (IMQ) cream on the shaved area of their backs for seven consecutive days. On day 8, the mice were killed to harvest specimens for experiments.
Figure 2
Figure 2
(R)-salbutamol alleviates psoriatic dermatitis. Phenotypical presentation of mouse back skin from control, IMQ, (R)-salbutamol and Dex groups after seven days of treatment, respectively (A). Distinct levels of erythema (B), skin thickeness (C), scaling (D) of back skin was scored daily on a scale from 0 to 4. Additionally, the cumulative score (E) (erythema plus scaling plus thickness) is depicted. n = 8, Mean ± SD, p < 0.05, †† p < 0.01 vs. IMQ group, ** p < 0.01 vs. control group.
Figure 3
Figure 3
Treatment with (R)-salbutamol ameliorated the morphological changes induced by IMQ. (A) (R)-salbutamol improves pathological injury. (Scale bar: 200 µm) White arrows show inflammatory cell infiltration, gray arrows show parakeratosis, red arrows represent Munro’s microabscesses, and black arrows was thickened prickle cell layer of the epidermis. (B) (R)-salbutamol alleviates epidermal thickness of the dorsal skin on day 8. (C) (R)-salbutamol decreased Baker score. # p < 0.05, ## p < 0.01, compared with IMQ group. ** p < 0.01, compared with control group. Each bar represents the mean ± SD (n = 8).
Figure 4
Figure 4
(R)-salbutamol reduced the levels of leukocytes in the blood and reduced IL-17 in the plasma. (A) white blood cells (WBC), (B) Neutrophil, (C) Monocyte were analyzed using IDEXX ProCyte DX hematology analyzer. (D) Levels of IL-17 in mouse plasma were measured by ELISA. # p < 0.05, ## p < 0.01, compared with IMQ group. ** p < 0.01, compared with control group. Each bar represents the mean ± SD (n = 8).
Figure 5
Figure 5
Effect of (R)-salbutamol treatment on the ratio of spleen weight to bodyweight. (A) Representative photographs of spleen in different groups. (B) 24 h after the final administration, mice were sacrificed and the ratio of spleen weight to bodyweight was determined. ### p < 0.01, compared with IMQ group. *** p < 0.001, compared with control group. Each bar represents the mean ± SD (n = 8).
Figure 6
Figure 6
The influence of (R)-salbutamol on Th17 cells and Treg cells levels. Spleen cells were obtained from mice on day 8 and then stimulated with cocktail (with Brefeldin) for 6 h. Thereafter, they were stained with fluorescent conjugated anti-mouse CD3, CD25, and CD4. In addition, intracellular staining of IL-17 and Foxp3 was performed using the respective antibodies. Representative contour plots showed the frequency of live CD4+ T cells, IL-17+ Th17 gated and CD25+ Foxp3+ Treg in the splenocytes isolated from mice treated with IMQ and then with (R)-salbutamol. Relative scatter plots showed the frequencies determined from live cells. (A) Representative dot plots showing the percentage of CD3+CD4+ T cells. (B) Statistical analysis of the percentage of CD3+CD4+ T cells. (C) Expression of intracellular cytokines IL-17 was detected by flow cytometry in cells gated for CD4+. (D) FoxP3 stained with a Foxp3 staining buffer set without stimulation, with CD25+ surface as the gate. (E,F) Statistical analysis of the above results. ## p < 0.01, relative to IMQ group. ** p < 0.01, relative to the control group. Error bars represent the mean ± SD (n = 8).
Figure 7
Figure 7
Results of the metabolic effects of (R)-salbutamol in mice treated with IMQ to induce psoriasis. (A,B) PCA plot scores for the control, IMQ and (R)-salbutamol (L, M, H) groups in (B) ESI (−) mode and (A) ESI (+). (C,D) PLS-DA score plot for the (R)-salbutamol (L, M, H), IMQ and control on the basis of mice plasma metabolic profiles for the (D) ESI (−) mode and (C) ESI (+). (E,F) Venn diagrams showing the upregulated (E) or downregulated metabolites (F) based on the binary comparison of (R)-salbutamol vs. control, IMQ vs. control corresponding to the numbers shown in Supplemental Table S4. (G,H) Volcano plots of p values in the (G) ESI (+) and (H) ESI (−) mode. (I) Visualization of candidate biomarkers among the (R)-salbutamol, IMQ, and control in the ESI (+) and ESI (−) mode using Heat map of unsupervised hierarchical clustering. Columns: samples; Rows: biomarkers. The content level of metabolites is denoted by the color key. Red stands for high metabolite level whereas blue color denotes low metabolite level. (J) Pathway analysis for the differential metabolism in the (R)-salbutamol (L, M, H), IMQ, and control groups based on the topology analysis (x-axis) and enrichment analysis scores (y-axis). The size and color of each circle represent the pathway impact factor and p-value, respectively. The pathways marked in red are the most significant. These analyses were performed using the MetaboAnalyst 4.0 tool.
Figure 8
Figure 8
Abundant of some metabolites in plasma of mice from control, IMQ and (R)-salbutamol groups. # p < 0.05, ## p < 0.01, relative to IMQ group. ** p < 0.01, relative to the control group.
Figure 9
Figure 9
Schematic diagram showing possible mechanisms responsible for the pharmacological efficacy of (R)-salbutamol. Oral administration of (R)-salbutamol markedly reduced the plasma levels of IL-17, decreased the proportion of CD4+ Th17+ T cells (Th17) whereas increased the percentage of CD25+ Foxp3+ regulatory T cells (Tregs) in the spleens, and affected glycerophospholipid metabolism.

References

    1. Chiang C.C., Cheng W.J., Korinek M., Lin C.Y., Hwang T.L. Neutrophils in Psoriasis. Front. Immunol. 2019;10:2376. doi: 10.3389/fimmu.2019.02376. - DOI - PMC - PubMed
    1. Cruz M.S., Diamond A., Russell A., Jameson J.M. Human αβ and γδ T Cells in Skin Immunity and Disease. Front. Immunol. 2018;9:1304. doi: 10.3389/fimmu.2018.01304. - DOI - PMC - PubMed
    1. Traidl C., Jugert F., Krieg T., Merk H., Hunzelmann N. Inhibition of allergic contact dermatitis to DNCB but not to oxazolone in interleukin-4-deficient mice. J. Investig. Dermatol. 1999;112:476–482. doi: 10.1046/j.1523-1747.1999.00550.x. - DOI - PubMed
    1. Paschoal R.S., Silva D.A., Cardili R.N., Souza C.D.S. Metabolic syndrome, C-reactive protein and cardiovascular risk in psoriasis patients: A cross-sectional study. An. Bras. Dermatol. 2018;93:222–228. doi: 10.1590/abd1806-4841.20186397. - DOI - PMC - PubMed
    1. Semenov Y.R., Herbosa C.M., Rogers A.T., Huang A., Kwatra S.G., Cohen B., Anadkat M.J., Silverberg J.I. Psoriasis and Mortality in the US: Data from the National Health and Nutrition Examination Survey. J. Am. Acad. Dermatol. 2019 doi: 10.1016/j.jaad.2019.08.011. - DOI - PubMed

Publication types