

Safe Administration of Carbon Nanotubes by Intravenous Pathway in BALB/c Mice
- PMID: 32102423
- PMCID: PMC7075304
- DOI: 10.3390/nano10020400
Safe Administration of Carbon Nanotubes by Intravenous Pathway in BALB/c Mice
Abstract
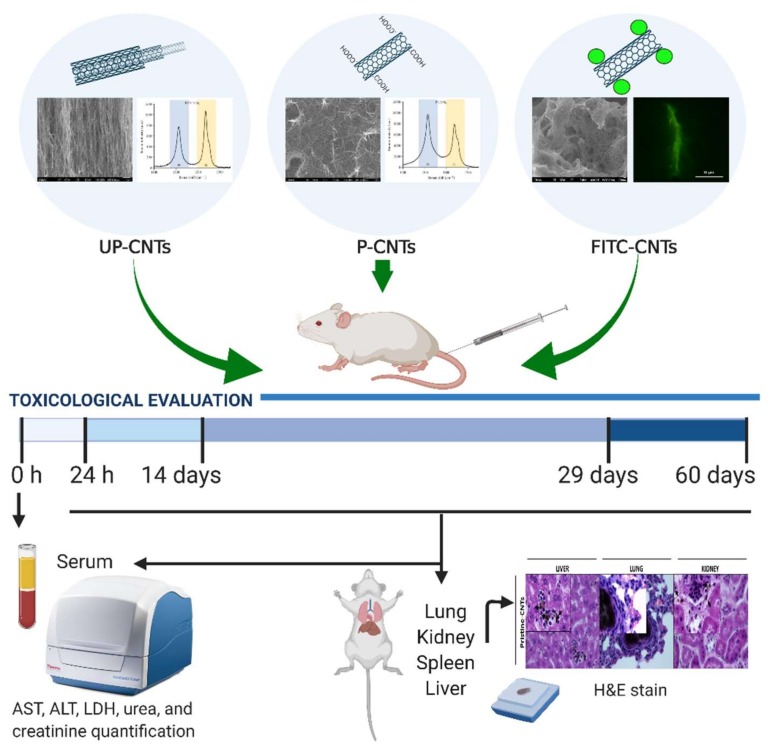
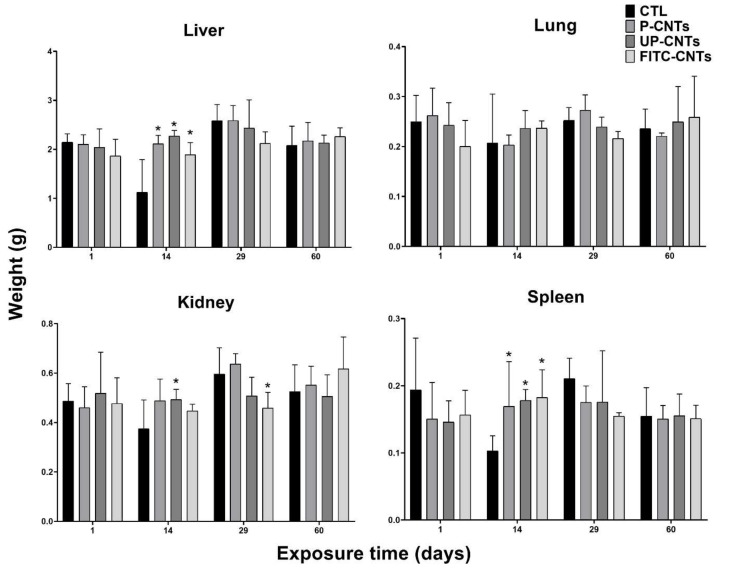
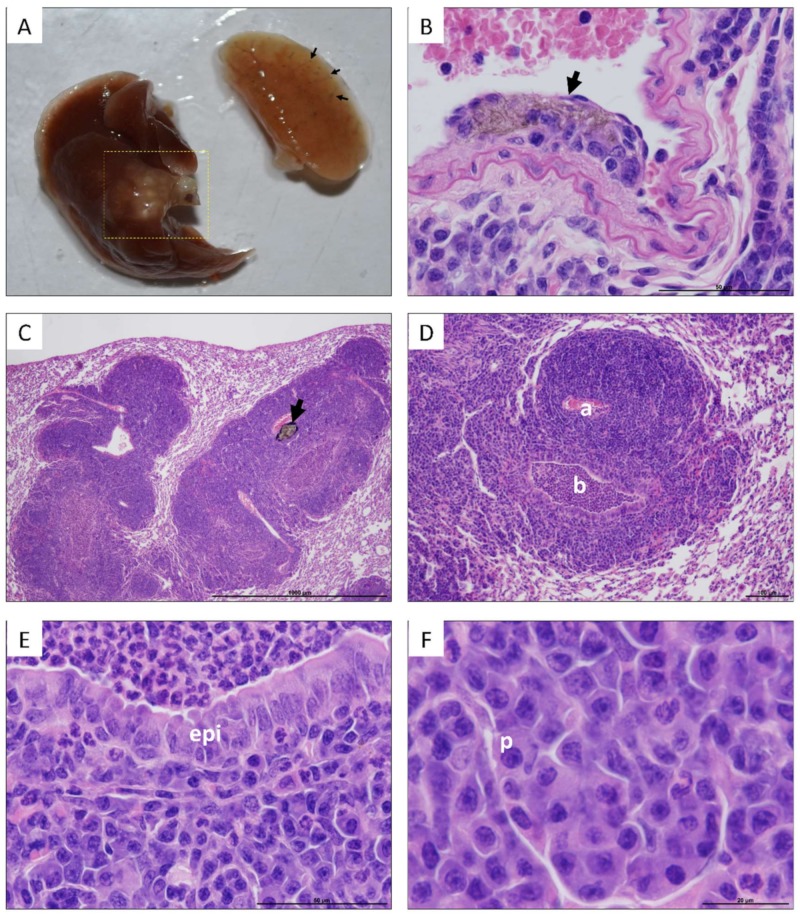
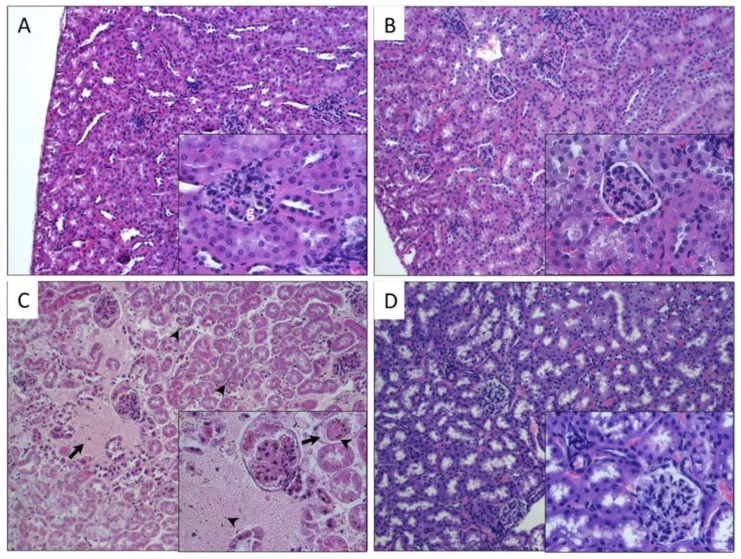
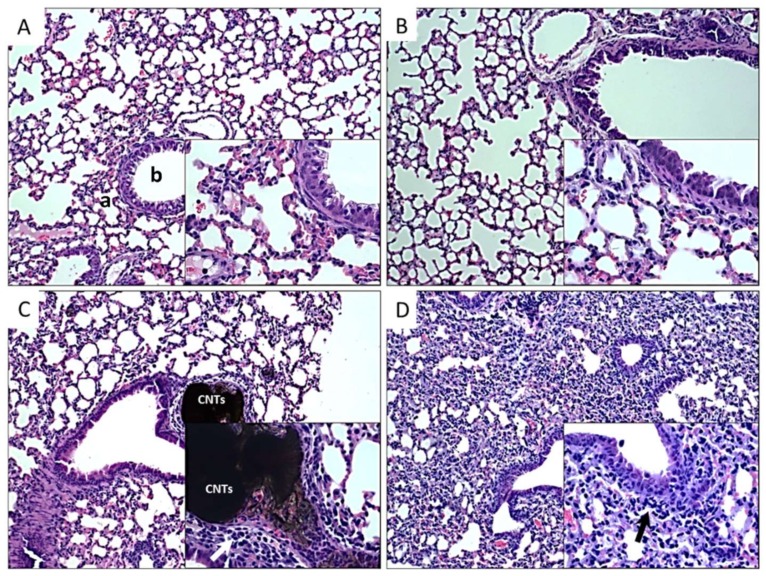
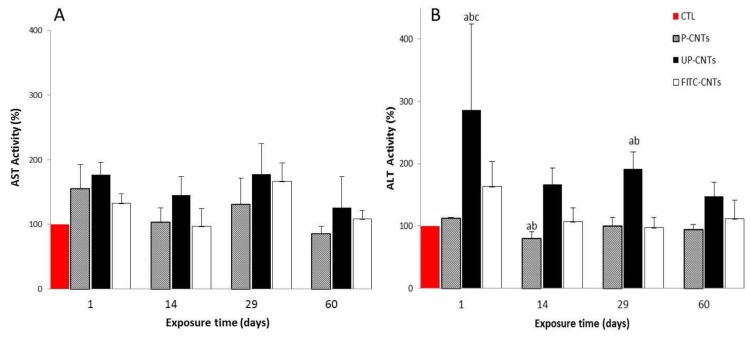
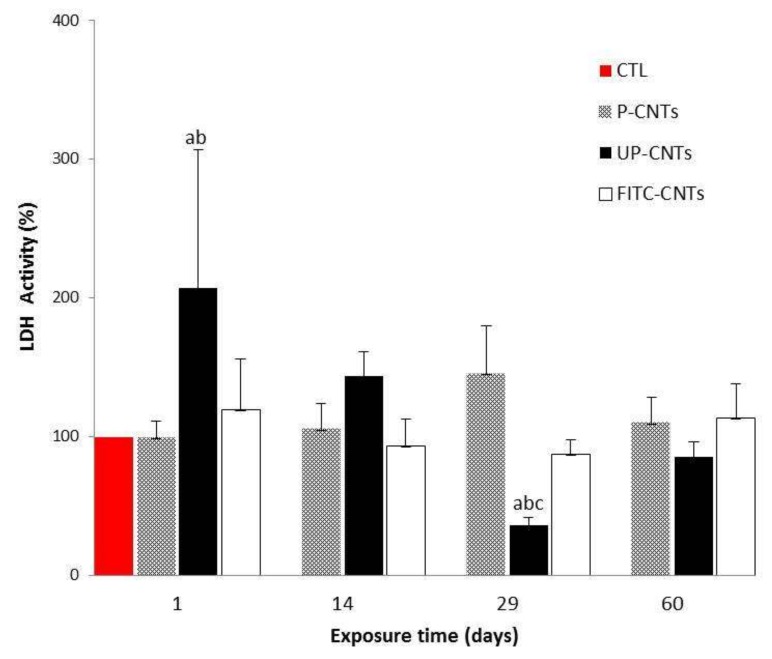
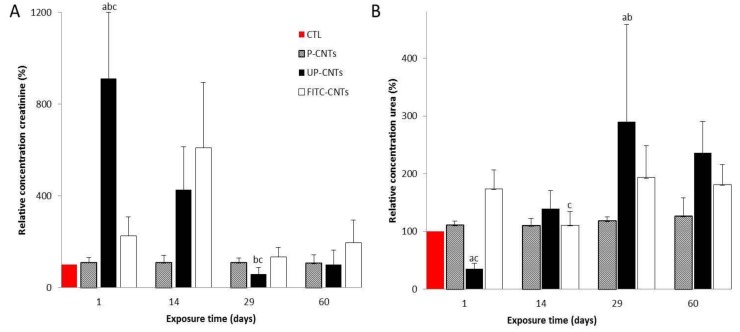
Carbon nanotubes (CNTs) are nanomaterials with multiple possible uses as drug carriers or in nanovaccine development. However, the toxicity of CNTs administered intravenously in in vivo models has not been fully described to date. This work aimed to evaluate the toxic effect of pristine multi-walled CNTs (UP-CNTs), purified (P-CNTs), or CNTs functionalized with fluorescein isothiocyanate (FITC-CNTs) administered by intravenous injection in BALB/c mice. Biochemical and histopathological parameters were analyzed at 1, 14, 29, and 60 days post-exposure. Pristine CNTs were the most toxic nanoparticles in comparison with P-CNTs or FITC-CNTs, increasing serum AST (≈ 180%), ALT (≈ 300%), and LDH (≈ 200%) levels at one day post-exposure. The urea/creatinine ratio suggested pre-renal injury at the 14th day accompanied of extensive lesions in kidneys, lungs, and liver. Biochemical and histological findings in mice exposed to P-CNTs had not significant differences compared to the controls. A lower toxic effect was detected in animals exposed to FITC-CNTs which was attributable to FITC toxicity. These results demonstrate that the purification process of CNTs reduces in vivo toxicity, and that toxicity in functionalized CNTs is dependent on the functionalized compound. Therefore, P-CNTs are postulated as potential candidates for safe biomedical applications using an intravenous pathway.
Keywords: Keywords. carbon nanotubes; lung damage; mice; nanotoxicology; renal damage; toxicity.
Conflict of interest statement
The authors declare no conflict of interest.
Figures
Similar articles
-
Systemic and immunotoxicity of pristine and PEGylated multi-walled carbon nanotubes in an intravenous 28 days repeated dose toxicity study.Int J Nanomedicine. 2017 Feb 27;12:1539-1554. doi: 10.2147/IJN.S123345. eCollection 2017. Int J Nanomedicine. 2017. PMID: 28280324 Free PMC article.
-
Toxicity of multiwalled carbon nanotubes with end defects critically depends on their functionalization density.Chem Res Toxicol. 2011 Nov 21;24(11):2028-39. doi: 10.1021/tx2003728. Epub 2011 Oct 18. Chem Res Toxicol. 2011. PMID: 21978239
-
Cytotoxicity of functionalized carbon nanotubes in J774A macrophages.Nanomedicine. 2012 Aug;8(6):853-9. doi: 10.1016/j.nano.2011.10.002. Epub 2011 Oct 25. Nanomedicine. 2012. PMID: 22033080
-
A review of carbon nanotube toxicity and assessment of potential occupational and environmental health risks.Crit Rev Toxicol. 2006 Mar;36(3):189-217. doi: 10.1080/10408440600570233. Crit Rev Toxicol. 2006. PMID: 16686422 Review.
-
[Nanotubes and occupational medicine].G Ital Med Lav Ergon. 2007 Jul-Sep;29(3 Suppl):851-2. G Ital Med Lav Ergon. 2007. PMID: 18409997 Review. Italian.
Cited by
-
Carbon Nanotubes as Carriers in Drug Delivery for Non-Small Cell Lung Cancer, Mechanistic Analysis of Their Carcinogenic Potential, Safety Profiling and Identification of Biomarkers.Int J Nanomedicine. 2022 Dec 8;17:6157-6180. doi: 10.2147/IJN.S384592. eCollection 2022. Int J Nanomedicine. 2022. PMID: 36523423 Free PMC article. Review.
-
Oxidative Stress in Long-Term Exposure to Multi-Walled Carbon Nanotubes in Male Rats.Antioxidants (Basel). 2023 Feb 12;12(2):464. doi: 10.3390/antiox12020464. Antioxidants (Basel). 2023. PMID: 36830022 Free PMC article.
-
Assessment of Pristine Carbon Nanotubes Toxicity in Rodent Models.Int J Mol Sci. 2022 Dec 5;23(23):15343. doi: 10.3390/ijms232315343. Int J Mol Sci. 2022. PMID: 36499665 Free PMC article. Review.
References
-
- Iijima S. Helical microtubules of graphitic carbon. Nature. 1991;354:56–58. doi: 10.1038/354056a0. - DOI
-
- Singh R., Pantarotto D., McCarthy D., Chaloin O., Hoebeke J., Partidos C.D., Briand J.P., Prato M., Bianco A., Kostarelos K. Binding and condensation of plasmid DNA onto functionalized carbon nanotubes: Toward the construction of nanotube-based gene delivery vectors. J. Am. Chem. Soc. 2005;127:4388–4396. doi: 10.1021/ja0441561. - DOI - PubMed
Grants and funding
LinkOut - more resources
Full Text Sources
