. 2020 Feb 24;9(2):517.
doi: 10.3390/cells9020517.

Nrp1 is Activated by Konjac Ceramide Binding-Induced Structural Rigidification of the a1a2 Domain

Affiliations

Nrp1 is Activated by Konjac Ceramide Binding-Induced Structural Rigidification of the a1a2 Domain

Seigo Usuki et al. Cells. .

Abstract

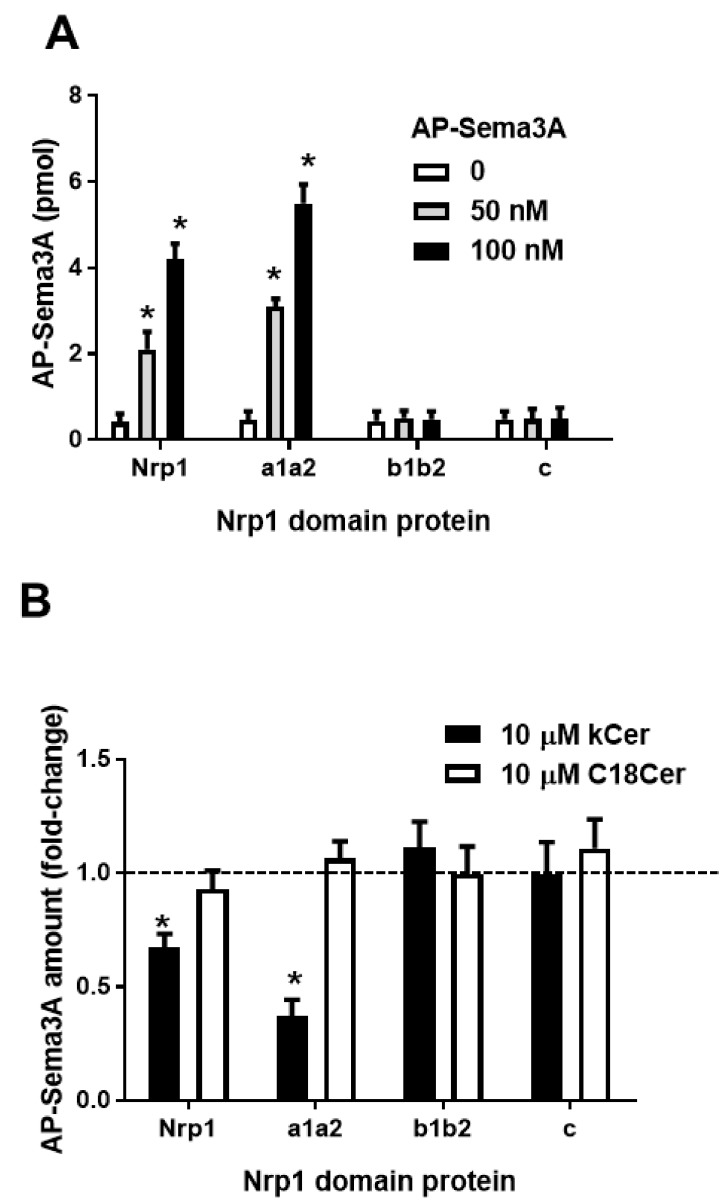
Konjac ceramide (kCer) is a plant-type ceramide composed of various long-chain bases and a-hydroxyl fatty acids. The presence of d4t,8t-sphingadienine is essential for semaphorin 3A (Sema3A)-like activity. Herein, we examined the three neuropilin 1 (Nrp1) domains (a1a2, b1b2, or c), and found that a1a2 binds to d4t,8t-kCer and possesses Sema3A-like activity. kCer binds to Nrp1 with a weak affinity of mM dissociation constant (Kd). We wondered whether bovine serum albumin could influence the ligand-receptor interaction that a1a2 has with a single high affinity binding site for kCer (Kd in nM range). In the present study we demonstrated the influence of bovine serum albumin. Thermal denaturation indicates that the a1a2 domain may include intrinsically disordered region (IDR)-like flexibility. A potential interaction site on the a1 module was explored by molecular docking, which revealed a possible Nrp1 activation mechanism, in which kCer binds to Site A close to the Sema3A-binding region of the a1a2 domain. The a1 module then accesses a2 as the IDR-like flexibility becomes ordered via kCer-induced protein rigidity of a1a2. This induces intramolecular interaction between a1 and a2 through a slight change in protein secondary structure.

Keywords: ceramide; endoglycoceramidase; konjac; neurite outgrowth; neuropilin 1; semaphorin3A; sphingadienine.


Conflict of interest statement

The authors declare no conflicts of interest.

Figures

Figure 1
Figure 1
The nomenclature of long-chain bases and ceramides following the recommendations of the IUPAC-IUBMB Joint Commission. (A) The endoglycoceramidase (EGCase) reaction of konjac glucosylceramide (kGlcCer). Plant-type ceramides can be prepared from plant-type glucosylceramide (GlcCer) by EGCase I treatment. A major molecular species (d18:24t, 8c-C16h:0) of konjac ceramide (kCer) is shown. (B) The main long-chain bases found in plants. The long-chain bases of kCer produced by EGCase treatment are delineated by a dotted line rectangle. (C) kCer molecular species generated by EGCase treatment of kGlcCer. The length of the carbon chain of each hydroxyl fatty acid (C16 to C20) is shown.
Figure 2
Figure 2
Structure of Neuropilin 1 (Nrp1) and the binding mechanism of semaphorin 3A (Sema3A). (A) Diagram displaying the modular structure of Nrp1, which is comprised of five domains (a1, a2, b1, b2, and c), as illustrated by He et al. [1]. S: signal peptide; C1r/s: complement (CUB); FV/VIII: regions homologous to coagulation factor V and VIII; MAM: a specific domain in transmembrane proteins. (B) Interaction between Sema3A and Nrp1. Sema3A binds to domain a1 of a1a2 via the Sema domain, the Ig-like domain, and the C-terminal basic tail, as well as to domain b1 via the C-terminal tail. Vascular endothelial growth factor (VEGF) and heparin bind to b1b2. (C) Proposed model for kCer binding to Nrp1 as a Sema3A agonist based on the two hypotheses. A hydrophobic part of kCer binds to the fatty acid binding pocket, forming the kCer/BSA complex, which releases kCer via formation of the kCer/BSA/Nrp1 complex. kCer is indicated by a dashed arrow (a), representing a weak flow relative to the bold arrow (b).
Figure 3
Figure 3
Co-immunoprecipitation (Co-IP) of alkaline, phosphatase-fused Sema3A (AP-Sema3A) using the His-tagged Nrp1 domain and anti-His antibody. (A) AP-Sema3A (0, 50, or 100 nM) was mixed with Nrp1, a1a2, b1b2, or c (100 nM) prior to Co-IP with an anti-6x-His monoclonal antibody (anti-His mAb) (2 μg). (B) kCer or C18Cer (100 μM) and AP-Sema3A (100 nM) were mixed with Nrp1, a1a2, b1b2, or c (100 nM) before Co-IP with anti-His mAb (2 μg).
Figure 4
Figure 4
Dot blot analysis of the binding characteristics of kCer to Nrp1 domain proteins. (A) The upper blot shows the results for mixtures a1a2 (of 100 nM) plus d4t,8t-NBD-Ceramide (-NBD-Cer), d4t,8c-NBD-Cer, phyto-NBD-Cer, or d 4t-NBD-Cer (all at 100 nM). The lower blot shows the results for mixtures of 100 nM d4t,8t-NBD-Cer with 100 nM a1a2, b1b2, or b. (B) Saturation curve of d4t,8t-NBD-Cer binding to 200 nM a1a2 (●). Control blot of d4t,8t-NBD-Cer without a1a2 is shown on the lower plot (○). Data are presented as means ± standard deviation (SD) (n = 3). X is the concentration of d4t,8t-NBD-Cer (nM). The y-axis label “FI” represents the fluorescence intensity of d4t,8t-NBD-Cer bound to 200 nM a1a2. C is a constant for non-specific binding of d4t,8t-NBDCer. Non-specific binding is represented in the equation as CX. (C) Kd is the dissociation constant of the binding of d4t,8t-NBD-Cer to a1a2. Bmax is the plateau of the binding of d4t,8t-NBD-Cer to a1a2. FI is the fluorescence intensity per nanomole a1a2.
Figure 5
Figure 5
Time course of NBD-Cer and Rhod-bovine serum albumin (BSA) bound to PC12 cells. (A) Dissociation time course analysis of FI based on binding of 100 nM d NBD-Cer (FI = 5000) and 100 nM Rhod-BSA (FI = 5510), examined using Plexin A1 gene-silencing PC12 cells. (B) Images showing (1 to 4) changes in d4t,8t-NBD-Cer and (5 to 8) changes in Rhod-BSA at the indicated timepoints. The left graph shows a time course plot of FI (%) relative to 0 min. Data are presented as mean ± SD (n = 3). Scale bar = 100 μm. (C) Images showing (1 to 4) changes in d4t,8c-NBD-Cer and (5 to 8) changes in Rhod-BSA at the indicated timepoints. The left graph is a time course plot of FI (%) relative to 0 min. Data are presented as mean ± SD (n = 3). Scale bar = 100 μm.
Figure 6
Figure 6
Inhibition profile of the Nrp1 domain of NBD-Cer and Rhod-BSA binding to PC12 cells. (A) Representative images of Plex A1 gene-silencing PC12 cells examined together with Nrp1 domains a1a2, bib2, and c (100 nM), or control (CNTL) plus 100 nM NBD-Cer/100 nM Rhod-BSA. Scale bar = 100 μm. Changes in FI are shown in the right upper graph (NBD-Cer) and lower right graph (Rhod-BSA). Data are presented as mean ± SD (n = 3; *p < 0.01). (B) Colocalization of d4t,8t- or d4t,8c-NBD-Cer and Rhod-BSA during dissociation (0 to 15 min) in cells. Green (■) indicates occupation based on NBD fluorescence, and Red (□) indicates occupation based on Rhod fluorescence. Data are expressed as FI (%) at 0 min and are presented as mean ± SD (n = 3; *p < 0.01).
Figure 7
Figure 7
(A) Molecular docking simulation for the a1 module and d4t,8t-C16kCer, and artificial species of kCer composed of C16:0 fatty acid and d4t,8t-sphingadienine. There are three binding sites (A, B, and C) on the a1 protein. Site A is located near the Sema3A binding region. (B) Possible activation mechanism of Nrp1 by kCer. The sole a1 module is far away from a2 and b1b2 (Figure S4B). intrinsically disordered region (IDR)-like flexibility likely occurs due to the distance between a1 and a2 modules. When kCer binds to Site A of the a1 module, the IDR-like flexibility between a1 and a2 diminishes, and the IDR-like region rigidifies, strengthening the intermolecular interactions between a1 and a2, resulting in a slight change in protein secondary structure.

Similar articles

Cited by

References

    1. He Z., Tessier-Lavigne M. Neuropilin is a receptor for the axonal chemorepellent Semaphorin III. Cell. 1997;90:739–751. doi: 10.1016/S0092-8674(00)80534-6. - DOI - PubMed
    1. Goshima Y., Yamashita N., Nakamura F., Sasaki Y. Regulation of dendritic development by semaphorin 3A through novel intracellular remote signaling. Cell Adh. Migr. 2016;10:627–640. doi: 10.1080/19336918.2016.1210758. - DOI - PMC - PubMed
    1. Tamagnone L., Comoglio P.M. Signalling by semaphorin receptors: Cell guidance and beyond. Trends Cell Biol. 2000;10:377–383. doi: 10.1016/S0962-8924(00)01816-X. - DOI - PubMed
    1. Martin-Satue M., Blanco J. Identification of semaphorin E gene expression in metastatic human lung adenocarcinoma cells by mRNA differential display. J. Surg. Oncol. 1999;72:18–23. doi: 10.1002/(SICI)1096-9098(199909)72:1<18::AID-JSO5>3.0.CO;2-P. - DOI - PubMed
    1. Tseng C.H., Murray K.D., Jou M.F., Hsu S.M., Cheng H.J., Huang P.H. Sema3E/plexin-D1 mediated epithelial-to-mesenchymal transition in ovarian endometrioid cancer. PLoS ONE. 2011;6:e19396. doi: 10.1371/journal.pone.0019396. - DOI - PMC - PubMed

Publication types

LinkOut - more resources