. 2020 Feb 24;9(2):519.
doi: 10.3390/cells9020519.

Microfluidic Device for On-Chip Immunophenotyping and Cytogenetic Analysis of Rare Biological Cells

Affiliations

Microfluidic Device for On-Chip Immunophenotyping and Cytogenetic Analysis of Rare Biological Cells

Kumuditha M Weerakoon-Ratnayake et al. Cells. .

Abstract

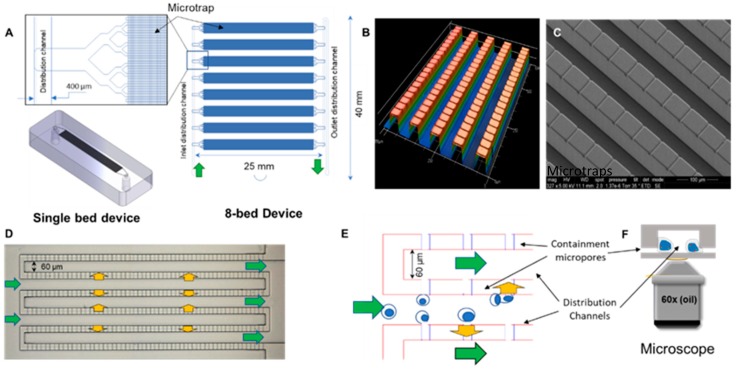
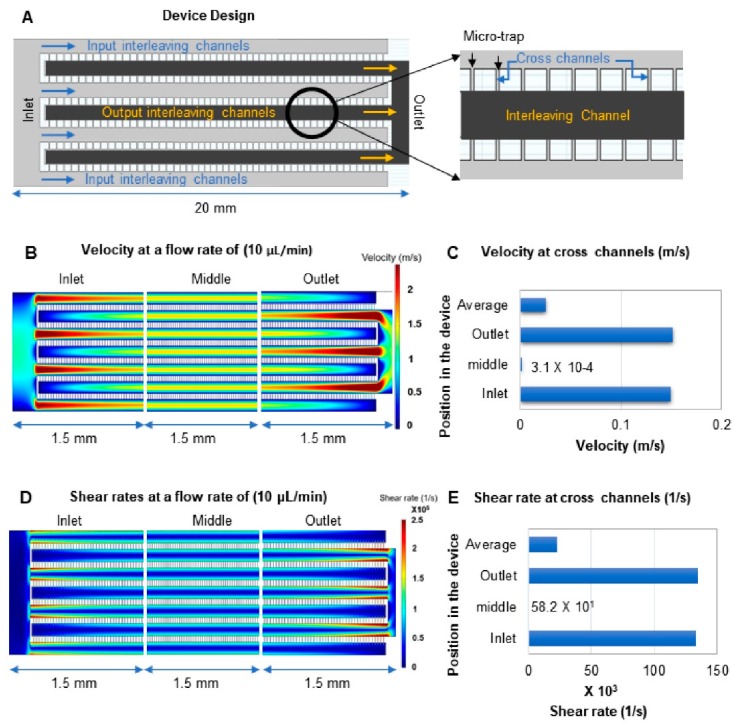
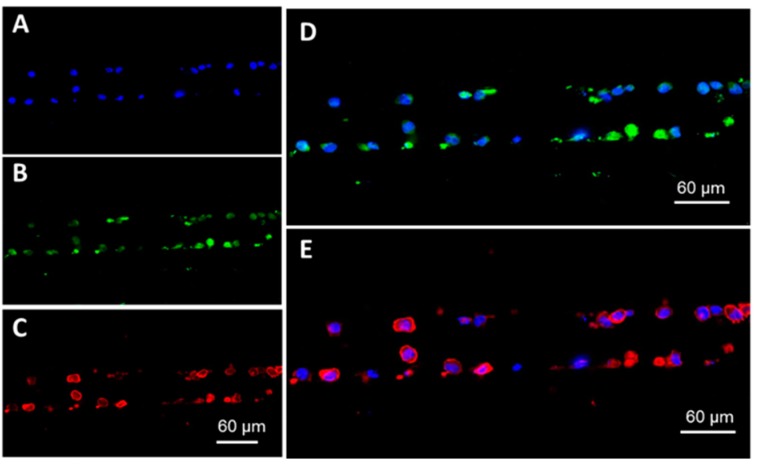
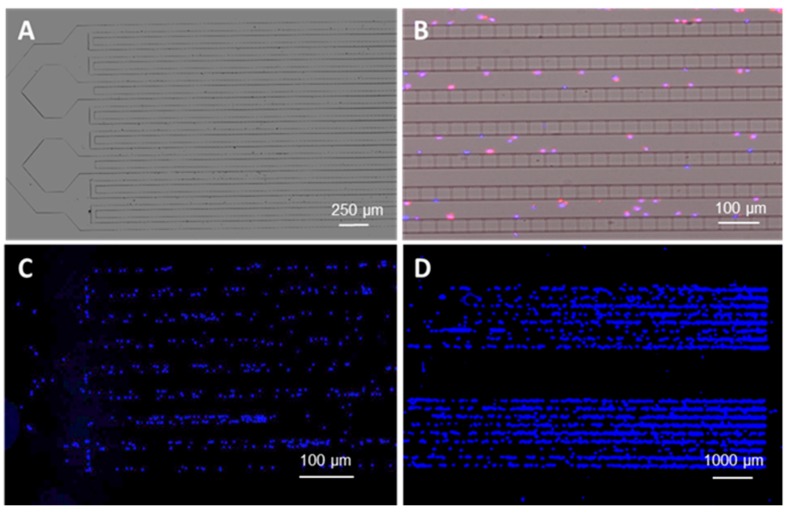
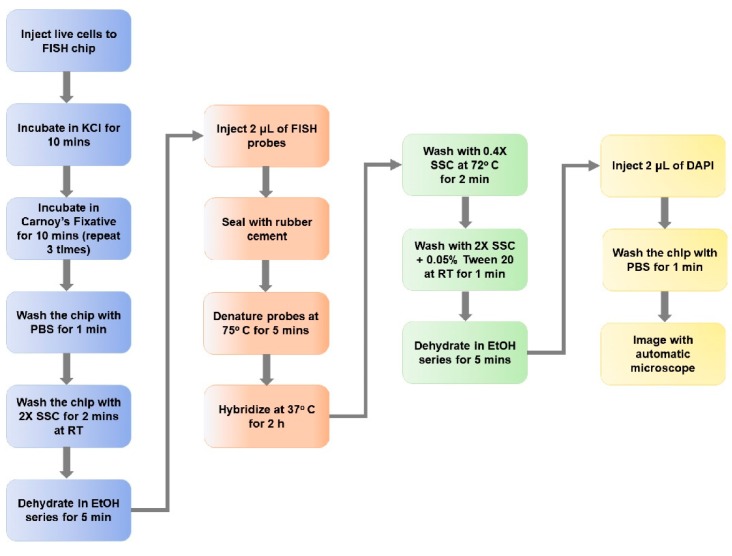
The role of circulating plasma cells (CPCs) and circulating leukemic cells (CLCs) as biomarkers for several blood cancers, such as multiple myeloma and leukemia, respectively, have recently been reported. These markers can be attractive due to the minimally invasive nature of their acquisition through a blood draw (i.e., liquid biopsy), negating the need for painful bone marrow biopsies. CPCs or CLCs can be used for cellular/molecular analyses as well, such as immunophenotyping or fluorescence in situ hybridization (FISH). FISH, which is typically carried out on slides involving complex workflows, becomes problematic when operating on CLCs or CPCs due to their relatively modest numbers. Here, we present a microfluidic device for characterizing CPCs and CLCs using immunofluorescence or FISH that have been enriched from peripheral blood using a different microfluidic device. The microfluidic possessed an array of cross-channels (2-4 µm in depth and width) that interconnected a series of input and output fluidic channels. Placing a cover plate over the device formed microtraps, the size of which was defined by the width and depth of the cross-channels. This microfluidic chip allowed for automation of immunofluorescence and FISH, requiring the use of small volumes of reagents, such as antibodies and probes, as compared to slide-based immunophenotyping and FISH. In addition, the device could secure FISH results in <4 h compared to 2-3 days for conventional FISH.

Keywords: circulating leukemia cells; circulating plasma cells; fish; immunophenotyping; liquid biopsy; microfluidics.


Conflict of interest statement

S.A.S. and M.L.H. hold equity shares in BioFluidica, Inc., a company that holds commercialization rights to the cell isolation technology described herein. M.A.W declares COI as a spouse of a BioFluidica, Inc. employee.

Figures

Figure 1
Figure 1
Microfluidic device for performing automated immunophenotyping and FISH. (A) Design of the microfluidic network composed of a single bed with 7200 microtraps and the 8-bed device containing 10,000 microtraps in each bed for a total of 80,000 traps per device. Microtrap size: 4 × 2 × 50 µm (w × d × l). (B) Profilometer scan of the microtrap chip replicated in PDMS from a 3-level SU-8 relief and a Si master showing microchannel depth varying between input/output distribution channels, interleaving channels, and cross-channels. (C) Cross-channels and the deeper interleaving channels are shown in the SEM image. (D) Optical microscope image of a lithographically patterned 2-level SU-8 relief for preparing a single bed microtrap device. The arrows show the fluid path. (E) Schematic showing operation of the microtrap chip. Cells in solution (green arrows) are contained at the entrances of the microtraps, letting the fluid pass (yellow arrows) into the outlet channels of the interleaving network. (F) Schematic showing the 3-dimensionality of cells captured in the microtrap chip and imaging using a high magnification (60× or 100×) objective through a thin cover plate.
Figure 2
Figure 2
Simulations of the microtrap device. (A) 2-D CAD design of the microtrap device used for COMSOL simulations showing the interleaving network for the flow of fluid, and the cross-channels, which produce the microtraps when a cover plate is sealed to the device. The magnified image of the microtrap area is shown on the right with a single interleaving output channel (red) and two interleaving input channels (gray). (B) The simulated linear fluid velocity throughout the microtrap chip. The simulation shows three sections of the device: (i) input section; (ii) middle section; and (iii) outlet section. Flow was simulated across the interleaving input/output channels and the cross-channels. The dashed box shown here is the region of the device that was simulated in Figure S3 (see Supplementary Materials). (C) Bar graph representing the mean velocities expressed in m/s observed for the cross-channels at different sections of the device and at a 10 μL/min volume flow rate. The sections labeled here correspond to the sections of the device simulated in (B). (D) Simulated shear rate at three different sections of the device, inlet, middle, and outlet sections. (E) Bar graphs representing the mean shear rates across the cross-channels at different sections of the device at a volume flow rate of 10 μL/min. The sections of the device listed here correspond to those sections shown in (D).
Figure 3
Figure 3
On-chip immunophenotyping of RPMI-8226 cells. (A) DAPI-labeled RPMI-8226 cell nucleus aligned at the entrance of the microtraps formed by the cross-channels and the cover plate assembled to the device. (B) CD138 expression of the RPMI-8226 cells and (C) CD38 expression for the same cells. (D) Composite image of CD138 expression (FITC channel) with the cell nucleus (DAPI channel of the microscope). (E) Composite image of CD38 expression (APC channel) with the cell nucleus that was DAPI stained. Exposure times were DAPI 50 ms, FITC 500 ms, and APC 1500 ms with 20× magnification. All images were collected using the Keyence fluorescence microscope. Shown in this fluorescence image are cells aligned along one interleaving input channel with cross-channels on either side of that channel.
Figure 4
Figure 4
(A) Brightfield image of the bifurcated entrance channels of the microtrap device. RPMI-8226 cells were injected into the device at 10 μL/min and contained at the entrance of the microtraps. Cell images were processed according to the procedure listed in the materials and methods section of this manuscript and labeled with DAPI (nuclear stain) and CD38-APC markers. (B) Brightfield image merged with DAPI and APC channels showing the presence of the cell nucleus and CD38 on the cell surface aligned mainly at the microtrap entrances. (C) Entrance of the single bed device imaged using DAPI. RPMI-8226 cells were trapped inside the device at the entrance to the microtraps. (D) Two consecutive beds of the 8-bed device imaged with the DAPI channel of the microscope for stained RPMI-8226 cells.
Figure 5
Figure 5
Workflow of FISH using the microtrap device. The workload was reduced from 2 days (slide method) to 4 h using the microtrap device primarily due to the hybridization time reduced from overnight to 2 h. The probe volume required for the assay was also reduced from 10 to 2 μL as well as using the microtrap device. Live cells were injected into the microtrap device at a flow rate of 10 μL/min and the washing steps were done at 5 μL/min to reduce the shear stress on the fixed cells contained within the microfluidic device.
Figure 6
Figure 6
FISH-on-chip analysis of RPMI-8226 and SUP-B15 cells. (A) RPMI-8226 cells after FISH processing using the microtrap chip with the D13S319 plus deletion probe; (i) a cell that shows one green and one red FISH signal; (ii) a cell with only one green signal; (iii) a cell with 2 green and 2 red signals. (B) FISH analysis of SUP-B15 cells processed with the TEL/AML1 translocation, dual fusion probes showing the TEL (ETV6, 12p13.2) region in red, and AML1 (RUNX1, 21q22.12) region in green. (i) Two cells contained at the entrance of two different microtraps, but the FISH probes were visible in only one cell with two green signals; (ii) shows one red and two green signals with no clear yellow signals present; (iii) two cells that show distinct red and green signals, one cell captured at the entrance of microtrap shows one red, and one green signal with a possible yellow fusion signal. Both (A,B) were imaged in one single z-plane without z-stacking. (C,D) show z-stacking planes of 15 different image planes for FISH images from SUP-B15 cells captured at the microtrap and FISH processed with BCR/ABL plus translocation, dual fusion probe. (C) SUP-B15 cell with two green and two red signals. (D) SUP-B15 cell with one yellow fusion signal (second yellow signal not visible) and one red and green signal. Each image shows 15 separate images through the 15 μm distance range taken at 1-μm imaging intervals. FISH probes were specific to the BCR/ABL gene region, Philadelphia (Ph) chromosome tagging. All images were acquired using a Nikon 60× oil objective with DAPI—200 ms, FITC—1500 ms, TRITC—2500 ms integration times. The average SNR was 59 for the green probe and 68 for the red probe.
Figure 7
Figure 7
(A) Immunophenotyping of cells enriched from peripheral blood of a B-ALL patient by targeting cells with that express the CD19 antigen. The cells were stained using DAPI (nucleus), and monoclonal antibodies directed against TdT (FITC), CD34 (Cy3), and CD10 (Cy5). The images were acquired using a 40× microscope objective. The CLCs shown were DAPI(+)/CD34(+) and TdT(+), but CD10(−). (B) Microfluidic monitoring of a B-ALL patient from day 8 to 85 of chemotherapy. Total cell count represents all DAPI(+)/CD19(+) cells selected. (C) Number of CLCs identified as DAPI(+)/CD19(+)/TdT(+)/CD34(±)/CD10(±). (D) Change in phenotype among CLCs for this patient for days 8 and 85.
Figure 8
Figure 8
On-chip FISH processed B-cells isolated from a diagnosed B-ALL patient. TEL/AML1 FISH probes were used for the chromosomal aberration of t (12;21) translocation. Cells were imaged at the microtraps. Zoomed images show (a) single cell with 2 green FISH signals; (b) single cell with one green and one yellow signal; (c) a single cell with one red, one green, and one yellow FISH signal; (d) single cell with one red, one green, and one yellow FISH signals close to each other in the cell; and (e) single cell with one red and two green signals. In all cases, the images were collected using a 60× objective with z-stacking.

Similar articles

Cited by

References

    1. Macías M., Alegre E., Díaz-Lagares A., Patiño-García A., Pérez-Gracia J.L., Sanmamed M.F., López-López R., Varo N., Gonzalez A. Advances in Virus Research. Elsevier BV; Bethesda, MD, USA: 2018. Liquid Biopsy: From Basic Research to Clinical Practice; pp. 73–119. - PubMed
    1. Jeffrey S.S., Toner M. Liquid biopsy: A perspective for probing blood for cancer. Lab Chip. 2019;19:548–549. doi: 10.1039/C8LC90117A. - DOI - PubMed
    1. Kamande J.W., Lindell M.A.M., Witek M.A., Voorhees P.M., Soper S.A. Isolation of circulating plasma cells from blood of patients diagnosed with clonal plasma cell disorders using cell selection microfluidics. Integr. Biol. 2018;10:82–91. doi: 10.1039/C7IB00183E. - DOI - PMC - PubMed
    1. Jackson J.M., Taylor J.B., Witek M.A., Hunsucker S., Waugh J.P., Fedoriw Y., Shea T.C., Soper S.A., Armistead P.M. Microfluidics for the detection of minimal residual disease in acute myeloid leukemia patients using circulating leukemic cells selected from blood. Analyst. 2016;141:640–651. doi: 10.1039/C5AN01836F. - DOI - PMC - PubMed
    1. Bauman J., Wiegant J., Borst P., Van Duijn P. A new method for fluorescence microscopical localization of specific DNA sequences by in situ hybridization of fluorochrome-labelled RNA. Exp. Cell Res. 1980;128:485–490. doi: 10.1016/0014-4827(80)90087-7. - DOI - PubMed

Publication types

MeSH terms

LinkOut - more resources