. 2020 Feb 24;21(4):1546.
doi: 10.3390/ijms21041546.

The Hypoxic Proteome and Metabolome of Barley (Hordeum vulgare L.) with and without Phytoglobin Priming

Affiliations

The Hypoxic Proteome and Metabolome of Barley (Hordeum vulgare L.) with and without Phytoglobin Priming

Olga A Andrzejczak et al. Int J Mol Sci. .

Abstract

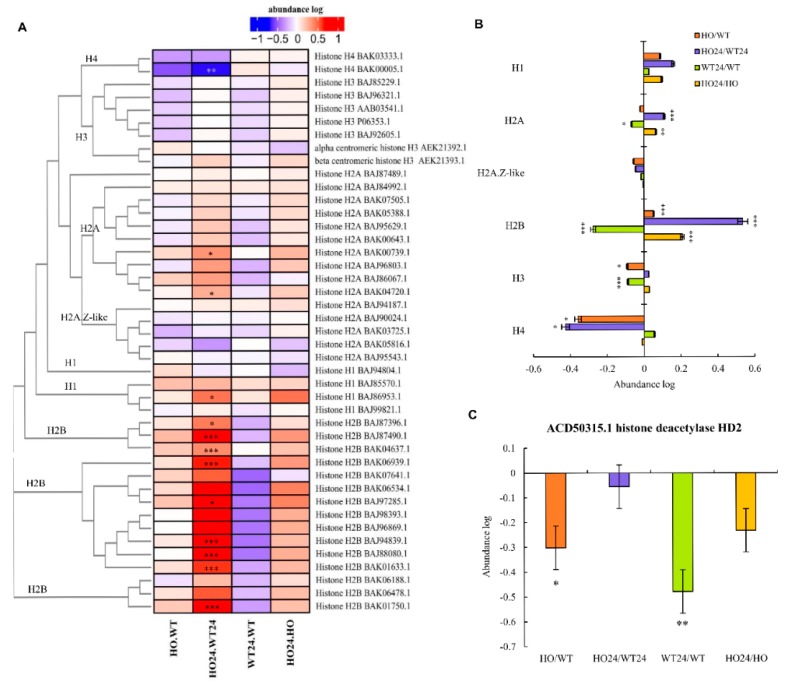
Overexpression of phytoglobins (formerly plant hemoglobins) increases the survival rate of plant tissues under hypoxia stress by the following two known mechanisms: (1) scavenging of nitric oxide (NO) in the phytoglobin/NO cycle and (2) mimicking ethylene priming to hypoxia when NO scavenging activates transcription factors that are regulated by levels of NO and O2 in the N-end rule pathway. To map the cellular and metabolic effects of hypoxia in barley (Hordeum vulgare L., cv. Golden Promise), with or without priming to hypoxia, we studied the proteome and metabolome of wild type (WT) and hemoglobin overexpressing (HO) plants in normoxia and after 24 h hypoxia (WT24, HO24). The WT plants were more susceptible to hypoxia than HO plants. The chlorophyll a + b content was lowered by 50% and biomass by 30% in WT24 compared to WT, while HO plants were unaffected. We observed an increase in ROS production during hypoxia treatment in WT seedlings that was not observed in HO seedlings. We identified and quantified 9694 proteins out of which 1107 changed significantly in abundance. Many proteins, such as ion transporters, Ca2+-signal transduction, and proteins related to protein degradation were downregulated in HO plants during hypoxia, but not in WT plants. Changes in the levels of histones indicates that chromatin restructuring plays a role in the priming of hypoxia. We also identified and quantified 1470 metabolites, of which the abundance of >500 changed significantly. In summary the data confirm known mechanisms of hypoxia priming by ethylene priming and N-end rule activation; however, the data also indicate the existence of other mechanisms for hypoxia priming in plants.

Keywords: N-end rule; anaerobiosis; ethylene; hemoglobin; histones; stress priming.


Conflict of interest statement

The authors declare no conflict of interest.

Figures

Figure 1
Figure 1
(A) Scheme of the experiments preformed. Eight-day-old seedlings of two genotypes were subjected to control (normoxia, wild type (WT), hemoglobin overexpressing (HO)) or hypoxic stress (WT24, HO24) for 24 h in darkness. Then, plants were kept for 72 h of recovery period in 16/8 h day/night conditions. The arrows indicate time of sampling for specific analysis. Changes in physiological parameters. (B) Chlorophyll content; (C) photosystem II efficiency; (D) fresh weight; (E) dry weight; (F) O2•− generation; and (G) H2O2 concentration in barley leaves. Seedlings of wild type shown as WT and with overexpression of phytoglobin as HO, seedlings after hypoxia treatment shown as WT24 (wild type) and HO24 (overexpression of phytoglobin).
Figure 2
Figure 2
Changes in proteome and metabolome of barley seedling wild type (WT) and with overexpression of phytoglobin (HO) caused by hypoxia stress. (A) sPLS-DA of all the proteins identified in the experiment; (B) scheme showing the distribution of differentially accumulated proteins (DAP) between different experimental conditions in contrast to all identified proteins; PCA of the metabolite profiles of (C) all identified metabolites; and (D) selected metabolomics of amino acids, glycolysis pathway, and polyamines (list in Supplementary Table S4). PCA Vectors 1 and 2 were chosen for best visualization of differences between experimental treatments and include 9.4% (A), 60.6% (C), and 79.7% (D) of the information derived from proteomic and metabolic variance.
Figure 3
Figure 3
Proteins having the major impact on the differences caused by (A) hypoxia and (B) genotype. Colors indicate high (red) or low (green) abundance of protein; (C) specific proteins confirming overexpression of phytoglobin; (D) hypoxia stress and different reaction to stress of two genotypes of plants. Asterisk indicate level of p (* p < 0.05, ** p < 0.01, and *** p < 0.001).
Figure 4
Figure 4
Genotype differences in the leaf proteome. (A) Comparison of the number of differentially abundant proteins (DAP) in HO/WT and HO24/WT24 seedlings whose quantity was decreased (lower) or increased (higher); (B) the functional distribution of the DAP proteins whose abundance was decreased (lower) or increased (higher) in HO/WT and HO24/WT24.
Figure 5
Figure 5
Hypoxia differences in the leaf proteome. (A) Comparison of the number of DAP that were accumulated in higher and lower abundance in HO24/HO and WT24/and the common proteins between them; (B) comparison of the functional categories of DAP that were accumulated in higher and lower abundance specifically in HO and WT plants after hypoxia and the common between them.
Figure 6
Figure 6
Heatmap displaying the abundance of DAP related to energy function. Seedlings of wild type shown as WT and with overexpression of phytoglobin as HO, seedlings after hypoxia treatment shown as WT24 (wild type) and HO24 (overexpression of phytoglobin). The color scale illustrates the relative abundance level of each protein across the 3 biological samples; red and blue indicate higher and lower expression in comparisons. Heatmap is showing 4 largest clusters created with k-means. Asterisk indicate level of p (* p < 0.05, ** p < 0.01, and *** p < 0.001).
Figure 7
Figure 7
Heatmap displaying DAP related to transport. Seedling of wild type shown as WT and with overexpression of phytoglobin as HO, seedlings after hypoxia treatment shown as WT24 (wild type) and HO24 (overexpression of phytoglobin). The color scale illustrates the relative abundance level of each protein across the 3 biological samples; red and blue indicate higher and lower expression in comparisons. Heatmap is showing 4 largest clusters created with k-means. Asterisk indicate level of p (* p < 0.05, ** p < 0.01, and *** p < 0.001).
Figure 8
Figure 8
Heatmap displaying DAP related to calcium ion signal transduction. Seedling of wild type shown as WT and with overexpression of phytoglobin as HO, seedlings after hypoxia treatment shown as WT24 (wild type) and HO24 (overexpression of phytoglobin). The color scale illustrates the relative abundance level of each protein across the 3 biological samples; red and blue indicate higher and lower expression in comparisons. Asterisk indicate level of p (* p < 0.05, ** p < 0.01, and *** p < 0.001).
Figure 9
Figure 9
Heatmap displaying DAP with function related to protein fate. Seedling of wild type shown as WT and with overexpression of phytoglobin as HO, seedlings after hypoxia treatment shown as WT24 (wild type) and HO24 (overexpression of phytoglobin). The color scale illustrates the relative abundance level of each protein across the 3 biological samples; red and blue indicate higher and lower expression in comparisons. Heatmap is showing 3 largest clusters created with k-means. Asterisk indicate level of p (* p < 0.05, ** p < 0.01, and *** p < 0.001).
Figure 10
Figure 10
Heatmap displaying DAP connected with (1) hormone metabolism/transport and (2) polyamines. Seedling of wild type shown as WT and with overexpression of phytoglobin as HO, seedlings after hypoxia treatment shown as WT24 (wild type) and HO24 (overexpression of phytoglobin). The color scale illustrates the relative abundance level of each protein across the 3 biological samples; red and blue indicate higher and lower expression in comparisons. Asterisk indicate level of p (* p < 0.05, ** p < 0.01, and *** p < 0.001).
Figure 11
Figure 11
Changes in abundance of histones. (A) Heatmap displaying all histones found in proteomic analysis with phylogenetic tree of sequences; (B) abundance of pulled histones of the same type, showing differences between experimental treatments; (C) changes in abundance of histone deacetylase. Seedling of wild type shown as WT and with overexpression of phytoglobin as HO, seedlings after hypoxia treatment shown as WT24 (wild type) and HO24 (overexpression of phytoglobin). The color scale illustrates the relative abundance level of each protein across the 3 biological samples; red and blue indicate higher and lower expression in comparisons. Heatmap is showing asterisk that indicate level of p (* p < 0.05, ** p < 0.01, and *** p < 0.001) in ratio, and graph (B) asterisk indicate significance from 0 by one sample T-test.
Figure 12
Figure 12
Diagram showing condense metabolic pathways of glycolysis, Krebs cycle, amino acids, polyamines, and gamma-aminobutyric acid (GABA) shunt with marked metabolites and enzymes (purple) that were significantly different for different treatments. The color scale illustrates the relative log2 units of each metabolite or protein across the 4 biological samples (HO, overexpression of phytoglobin; WT, wild type; HO24 and WT24, hypoxia treatments); red and blue indicate higher and lower level. Metabolites and proteins in green were identified and quantified but did not show significant change between treatments. The pathways are based on KEGG, data in Supplementary Table S5.

Similar articles

Cited by

References

    1. CRED/UNISDR . The Human Cost of Weather Related Disasters, 1995–2015. CRED; Brussels, Belgium: 2015. pp. 5–16.
    1. WFP World Food Programme Ready to Respond to Food Crisis in Malawi. [(accessed on 10 February 2020)]; Available online: https://www.wfp.org/news/news-release/world-food-programme-ready-respond....
    1. Sasidharan R., Bailey-Serres J., Ashikari M., Atwell B.J., Colmer T.D., Fagerstedt K., Fukao T., Geigenberger P., Hebelstrup K.H., Hill R.D., et al. Community recommendations on terminology and procedures used in flooding and low oxygen stress research. New Phytol. 2017;214:1403–1407. doi: 10.1111/nph.14519. - DOI - PubMed
    1. Yordanova R.Y., Popova L.P. Flooding-induced changes in photosynthesis and oxidative status in maize plants. Acta Physiol. Plant. 2007;29:535–541. doi: 10.1007/s11738-007-0064-z. - DOI
    1. Ismond K.P., Dolferus R., de Pauw M., Dennis E.S., Good A.G. Enhanced low oxygen survival in Arabidopsis through increased metabolic flux in the fermentative pathway. Plant. Physiol. 2003;132:1292–1302. doi: 10.1104/pp.103.022244. - DOI - PMC - PubMed

MeSH terms

LinkOut - more resources