. 2020 Apr 1;204(7):1943-1953.
doi: 10.4049/jimmunol.1900915. Epub 2020 Feb 26.

TCRs with Distinct Specificity Profiles Use Different Binding Modes to Engage an Identical Peptide-HLA Complex

Affiliations

TCRs with Distinct Specificity Profiles Use Different Binding Modes to Engage an Identical Peptide-HLA Complex

Charlotte H Coles et al. J Immunol. .

Abstract

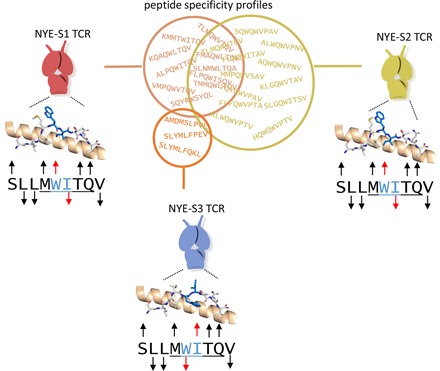
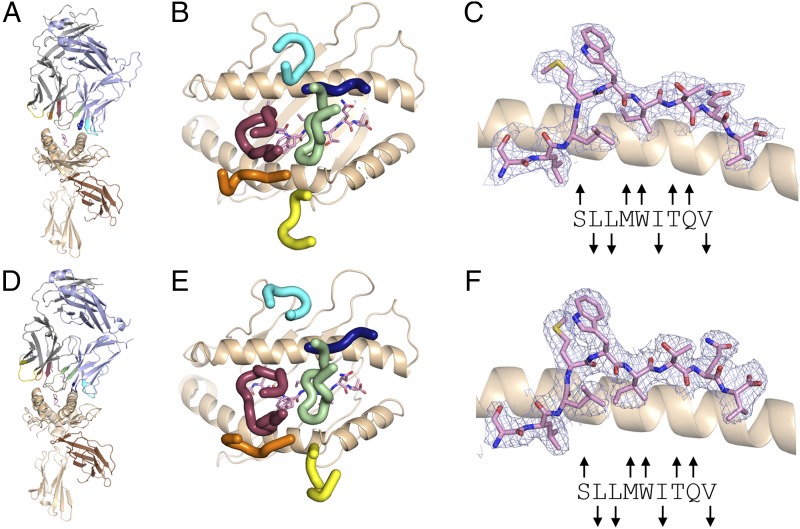
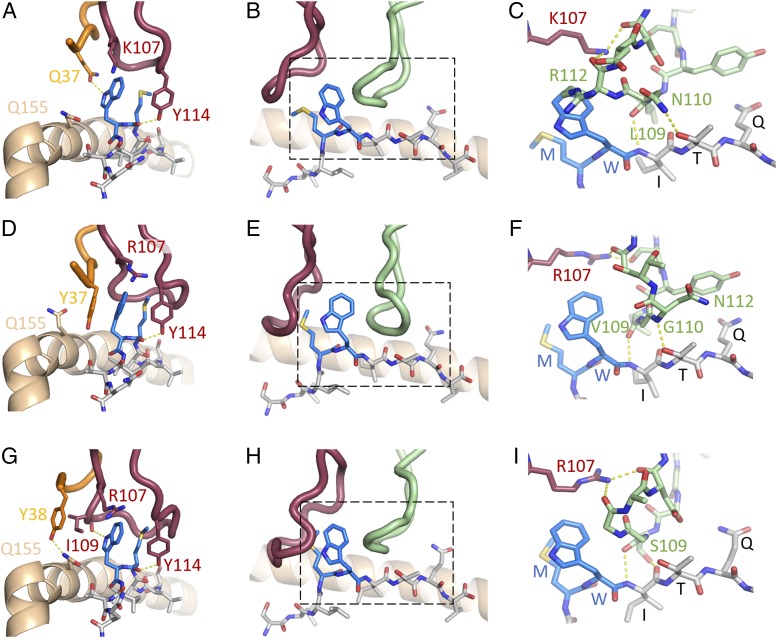
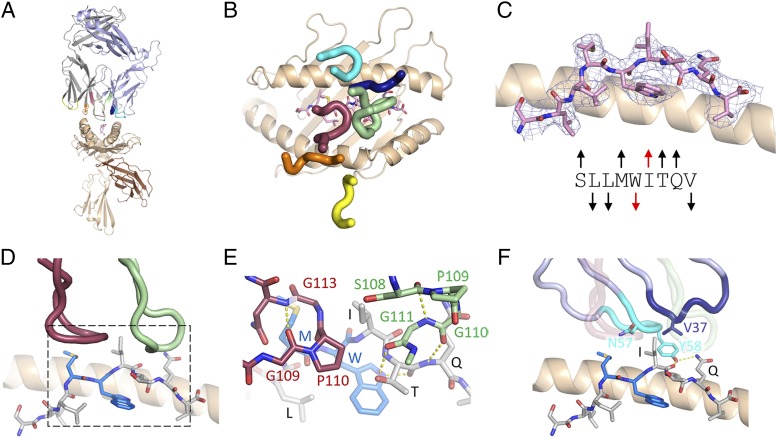
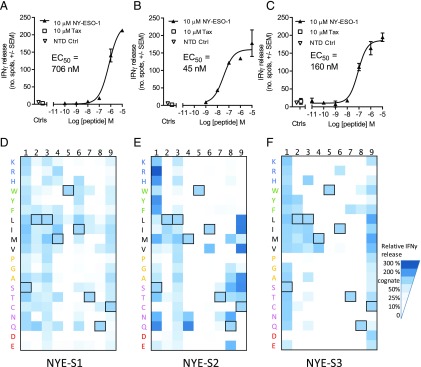
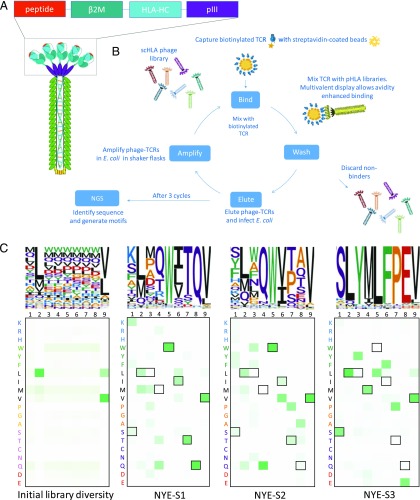
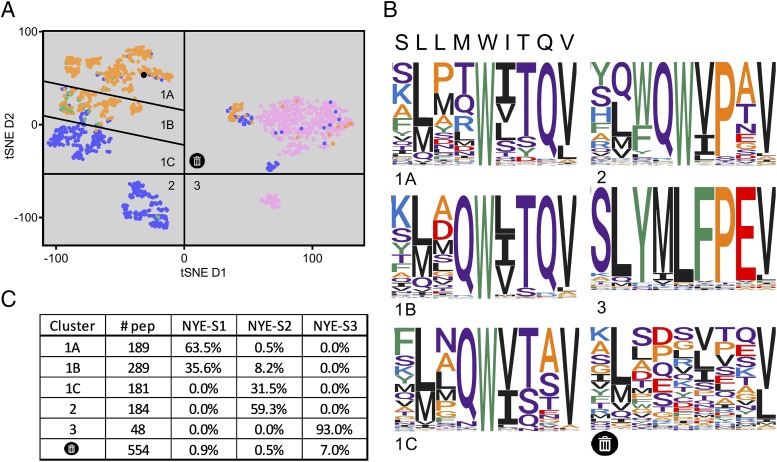
The molecular rules driving TCR cross-reactivity are poorly understood and, consequently, it is unclear the extent to which TCRs targeting the same Ag recognize the same off-target peptides. We determined TCR-peptide-HLA crystal structures and, using a single-chain peptide-HLA phage library, we generated peptide specificity profiles for three newly identified human TCRs specific for the cancer testis Ag NY-ESO-1157-165-HLA-A2. Two TCRs engaged the same central peptide feature, although were more permissive at peripheral peptide positions and, accordingly, possessed partially overlapping peptide specificity profiles. The third TCR engaged a flipped peptide conformation, leading to the recognition of off-target peptides sharing little similarity with the cognate peptide. These data show that TCRs specific for a cognate peptide recognize discrete peptide repertoires and reconciles how an individual's limited TCR repertoire following negative selection in the thymus is able to recognize a vastly larger antigenic pool.


Figures

None
Graphical abstract
FIGURE 1.
FIGURE 1.
NYE_S1 and NYE_S2 TCR–binding footprints on NY-ESO-1157–165(9V)–HLA-A2 and NY-ESO-1157–165 peptide conformations. Overall cartoon representation of TCR–pHLA complexes for NYE_S1 (A) and NYE_S2 (D) TCRs. NY-ESO-1157–165(9V)–HLA-A2 peptide conformation within NYE_S1 (B) and NYE_S2 (E) TCR containing structures. CDR positions above pHLA surface for NYE_S1 (C) and NYE_S2 (F) TCRs. HLA H chain, wheat; β2m, brown; TCR CDR1α, orange; TCR CDR2α, yellow; TCR CDR3α, maroon; TCR CDR1β, dark blue; TCR CDR2β, cyan; TCR CDR3β, green; NY-ESO-1 peptide, pink. 2Fo–Fc maps contoured at 1σ and carved within 2 Å of the peptide are shown in light purple. Arrows above or below the peptide sequence indicate if each side chain is either exposed or buried respectively, relative to the HLA-peptide–binding groove.
FIGURE 2.
FIGURE 2.
Structural characterization of NYE_S1, 1G4, and NYE_S2 TCRs binding to NY-ESO-1157–165(9V)–HLA-A2. CDR3α–mediated interactions with the MW-peg for NYE_S1 (A), 1G4 (B), and NYE_S2 (C) TCRs, respectively. CDR3α and CDR3β stacking against the MW-peg motif for NYE_S1 (D), 1G4 (E), and NYE_S2 (F) TCRs. The areas depicted by dashed boxes are expanded in panels (GI) to highlight CDR3β-mediated interactions. TCR CDR1α, orange; TCR CDR3α, maroon; TCR CDR3β, green; peptide, gray sticks; MW-peg, blue sticks; HLA helix-α1, wheat cartoon; potential H-bonds, yellow dashed lines.
FIGURE 3.
FIGURE 3.
Structural characterization of NYE_S3 TCR binding to NY-ESO-1157–165(9V)–HLA-A2. (A) Overall cartoon representation of NYE_S3 TCR–pHLA complex. (B) NY-ESO-1157–165(9V)–HLA-A2 peptide conformation within the NYE_S3 TCR–containing structure. (C) CDR positions above pHLA surface for NYE_S3. (D) CDR3α and CDR3β stacking against the peptide Ile6 side chain. The area depicted by the dashed box is expanded in (E) to highlight specific interactions. (F) Contribution of additional NYE_S3 TCR CDRs to peptide binding. Transparent CDR3α and CDR3β lie in the foreground of this panel.
FIGURE 4.
FIGURE 4.
Cellular potency and X-scan TCR specificity profiles. Cellular potency was assessed using T cells transduced with NYE_S1 (A), NYE_S2 (B), and NYE_S3 (C) TCRs, exposed to HLA-A2+ T2 cells pulsed with increasing concentrations of NY-ESO-1157–165 peptide. T cell activation was measured using an IFN-γ ELISpot assay at 24 h, and EC50 values were determined (solid triangles). No response was seen at the highest concentration of peptide used for pulsing a nontransduced T cell control (open triangles) or irrelevant TAX peptide (open squares). (DF) X-scanning mutagenesis of all NY-ESO-1157–165 single amino acid variants. Data shown are from a representative donor (n = 2). An average of triplicate data points is presented for each of the 171 separate experiments normalized to the NY-ESO-1157–165 peptide control highlighted in (A)–(C). Each amino acid is shown in one-letter code and colored according to functional similarity: positive (blue), aromatic uncharged (green), aliphatic (black), small nonpolar (orange), polar (pink), and negative (red). Outlined boxes highlight the cognate residues.
FIGURE 5.
FIGURE 5.
Molecular analysis of TCR specificity for NY-ESO-1157–165 peptide. (A) Schematic of multivalent disulphide trapped single-chain trimers (dsSCT) displayed on HLA-A2 phage libraries. (B) Schematic of phage display panning protocol. (C) Heatmaps and sequence logos displaying amino acid permissivity generated from next-generation DNA sequencing (NGS) workflow showing initial peptide diversity in which positions 2 and 9 are biased toward known HLA-A2 preferences, and Cys is excluded prior to TCR selection (left panel). The following three panels show peptide diversity following three cycles of panning using each of the three NY-ESO-1157–165 specific TCRs. Outlined boxes highlight the cognate residues.
FIGURE 6.
FIGURE 6.
Sequence cluster analysis of the most abundant peptides identified in response to the three NY-ESO-1157–165–specific TCRs. (A) The 500 most enriched peptides for each NY-ESO-1157–165-specific TCR were clustered by calculating BLOSUM 45 distance between all peptides, and unique sequences plotted with a two-dimensional tSNE analysis. Peptides are colored according to the TCR, to which binding has been observed. TCR NYE_S1 (orange), NYE_S2 (blue), and NYE_S3 (pink) and peptides recognized by both TCR NYE_S1 and NYE_S2 (green). The NY-ESO-1157–165 peptide is shown in black. (B) Sequence logos for each of the clusters, including a cluster that has no convergence and is presumed to be noise, are shown. (C) The number of unique peptide sequences and the percentage of peptides recognized by each TCR from each cluster are reported.

References

    1. Turner S. J., Doherty P. C., McCluskey J., Rossjohn J. 2006. Structural determinants of T-cell receptor bias in immunity. Nat. Rev. Immunol. 6: 883–894. - PubMed
    1. Rudolph M. G., Stanfield R. L., Wilson I. A. 2006. How TCRs bind MHCs, peptides, and coreceptors. Annu. Rev. Immunol. 24: 419–466. - PubMed
    1. Rossjohn J., Gras S., Miles J. J., Turner S. J., Godfrey D. I., McCluskey J. 2015. T cell antigen receptor recognition of antigen-presenting molecules. Annu. Rev. Immunol. 33: 169–200. - PubMed
    1. Wooldridge L., Ekeruche-Makinde J., van den Berg H. A., Skowera A., Miles J. J., Tan M. P., Dolton G., Clement M., Llewellyn-Lacey S., Price D. A, et al. 2012. A single autoimmune T cell receptor recognizes more than a million different peptides. J. Biol. Chem. 287: 1168–1177. - PMC - PubMed
    1. Arstila T. P., Casrouge A., Baron V., Even J., Kanellopoulos J., Kourilsky P. 1999. A direct estimate of the human alphabeta T cell receptor diversity. Science 286: 958–961. - PubMed

Publication types