. 2020 Mar 25;40(13):2764-2775.
doi: 10.1523/JNEUROSCI.2370-19.2020. Epub 2020 Feb 26.

Interneuron Desynchronization Precedes Seizures in a Mouse Model of Dravet Syndrome

Affiliations

Interneuron Desynchronization Precedes Seizures in a Mouse Model of Dravet Syndrome

Conny H Tran et al. J Neurosci. .

Abstract

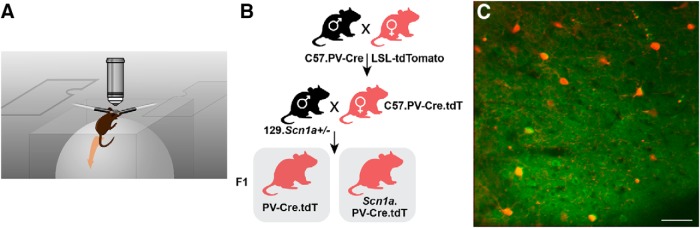
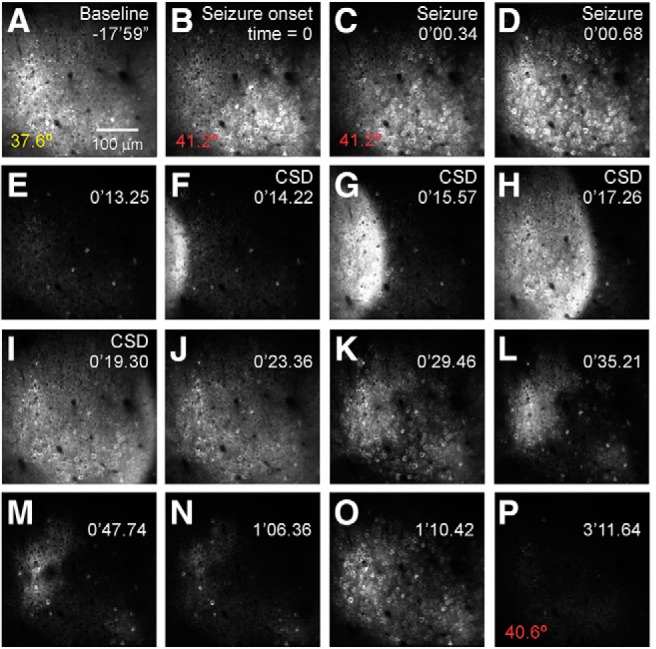
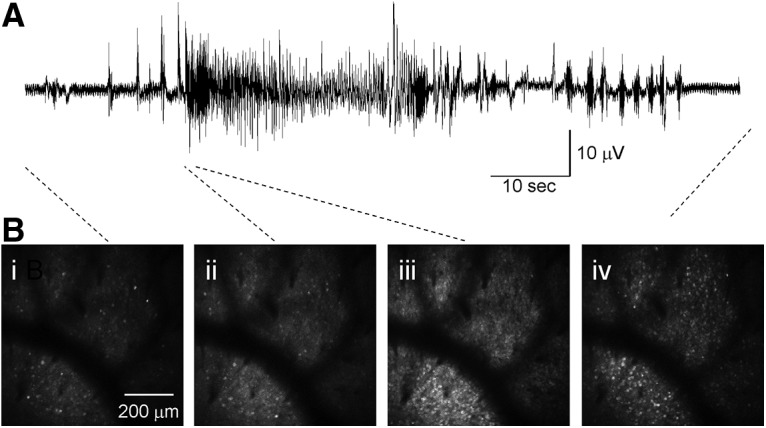
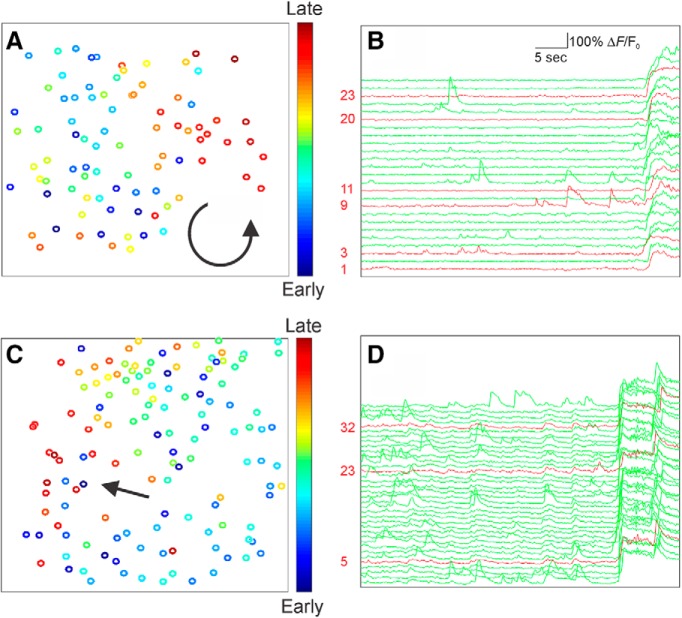
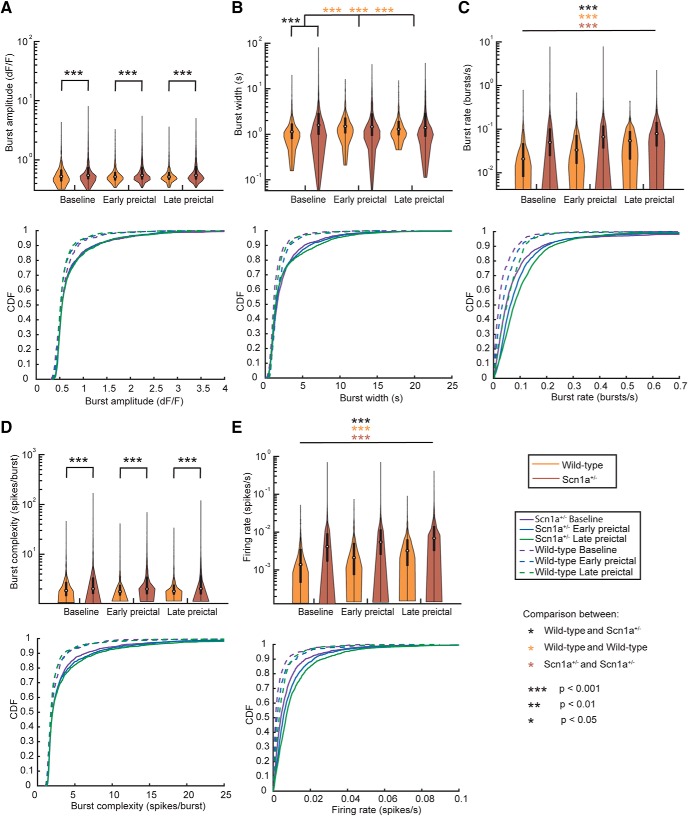
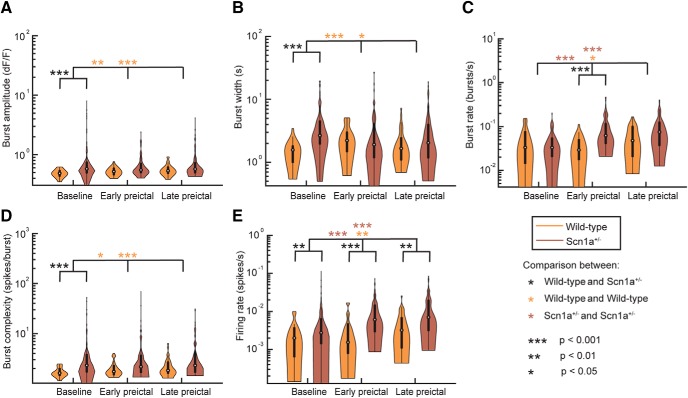
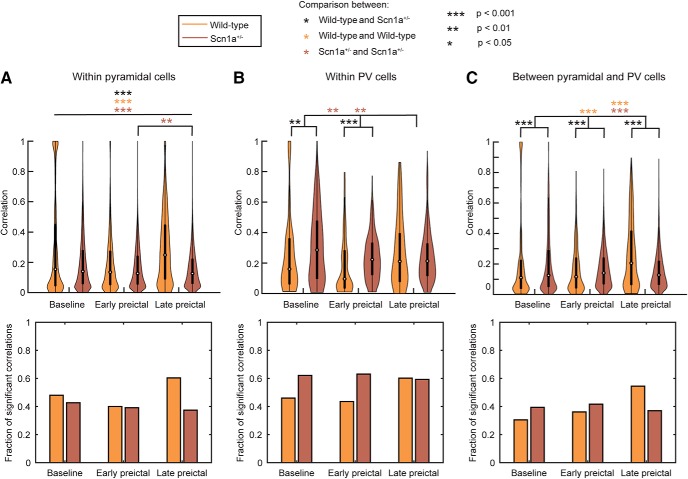
Recurrent seizures, which define epilepsy, are transient abnormalities in the electrical activity of the brain. The mechanistic basis of seizure initiation, and the contribution of defined neuronal subtypes to seizure pathophysiology, remains poorly understood. We performed in vivo two-photon calcium imaging in neocortex during temperature-induced seizures in male and female Dravet syndrome (Scn1a+/-) mice, a neurodevelopmental disorder with prominent temperature-sensitive epilepsy. Mean activity of both putative principal cells and parvalbumin-positive interneurons (PV-INs) was higher in Scn1a+/- relative to wild-type controls during quiet wakefulness at baseline and at elevated core body temperature. However, wild-type PV-INs showed a progressive synchronization in response to temperature elevation that was absent in PV-INs from Scn1a+/- mice. Hence, PV-IN activity remains intact interictally in Scn1a+/- mice, yet exhibits decreased synchrony immediately before seizure onset. We suggest that impaired PV-IN synchronization may contribute to the transition to the ictal state during temperature-induced seizures in Dravet syndrome.SIGNIFICANCE STATEMENT Epilepsy is a common neurological disorder defined by recurrent, unprovoked seizures. However, basic mechanisms of seizure initiation and propagation remain poorly understood. We performed in vivo two-photon calcium imaging in an experimental model of Dravet syndrome (Scn1a+/- mice)-a severe neurodevelopmental disorder defined by temperature-sensitive, treatment-resistant epilepsy-and record activity of putative excitatory neurons and parvalbumin-positive GABAergic neocortical interneurons (PV-INs) during naturalistic seizures induced by increased core body temperature. PV-IN activity was higher in Scn1a+/- relative to wild-type controls during quiet wakefulness. However, wild-type PV-INs showed progressive synchronization in response to temperature elevation that was absent in PV-INs from Scn1a+/- mice before seizure onset. Hence, impaired PV-IN synchronization may contribute to transition to seizure in Dravet syndrome.

Keywords: Dravet syndrome; GABAergic interneurons; Nav1.1; epilepsy; seizures; two-photon calcium imaging.


Figures

Figure 1.
Figure 1.
Schematic of the experimental approach. A, Imaging apparatus. The experimental animal is head-fixed and able to run or rest on a standard spherical treadmill that sits in a custom laser-cut three-piece acrylic chamber that consists of a cube, open at the top, with a two-piece lid that contains an aperture to accommodate the microscope objective. B, Breeding strategy used to produce Scn1a+/− mice and age-matched wild-type littermate controls expressing tdTomato in PV-positive GABAergic INs. PV-Cre mice on a C57 background (C57.PV-Cre) were crossed to the Ai14D reporter strain (LSL-tdTomato; also on a C57 background) to produce PV-Cre.tdTomato double heterozygous mice. PV-Cre.tdTomato double heterozygous females were then crossed to Scn1a+/− males on a 129.S6 background (129.Scn1a+/−) to produce triple transgenic Scn1a+/− mice (Scn1a.PV-Cre.tdT) and wild-type littermates. C, Labeling of PV-INs for in vivo 2P calcium imaging in Scn1a.PV-Cre.tdT mice during seizure induction. Shown is GCaMP6f labeling of neurons in layer 2/3 sensorimotor cortex (green) including PV-INs (red) in an Scn1a.PV-Cre.tdT mouse. The image is an average of 10 frames of 512 × 512 pixels acquired at 29.4 Hz at 2× digital zoom. Scale bar, 50 μm.
Figure 2.
Figure 2.
In vivo 2P calcium imaging depicts the evolution of a naturalistic seizure at cellular resolution in an awake, behaving Scn1a+/− (DS) mouse. In this example, a mouse underwent passive warming to a core body temperature of 42°C while mobile on a spherical treadmill contained within a custom-made enclosure while head-fixed during ongoing imaging. Time during the imaging session relative to seizure onset is shown at the top right in minutes (′) and seconds (″), following a ∼15 min baseline recording period) and core body temperature (bottom left) is shown. A, Baseline GCaMP6f fluorescence imaged at 950 nm. B, Seizure onset, with hypersynchronous activation across the imaging field. C, D, Seizure propagation. E, Post-ictal silence. F–L, Cortical spreading depolarization. M–P, Inter-ictal discharges. Data were acquired at 29.4 Hz at 2× digital zoom using a 16× NA 0.8 water-immersion objective (Nikon). See Movie 1.
Figure 3.
Figure 3.
Combined imaging/electrophysiology during temperature-induced seizures. Local field potential recording indicates that the imaging correlates of behavioral seizures correspond to electrographic seizures. We performed ECoG (see Materials and Methods) combined with in vivo 2P imaging, with an intracortical recording electrode placed within the 3 mm craniotomy window. A, Example recording showing a period of rhythmic spike and sharp wave activity corresponding to an electro-clinical seizure. B, Simultaneous 2P imaging during the electrical recording shown above, before seizure onset (Bi), at electrographic seizure onset (Bii), onset of large-scale recruitment of neuronal activity within the imaging field (Biii), and after cessation of the electrographic event (Biv).
Figure 4.
Figure 4.
Analysis of cellular-resolution imaging of seizure propagation shows widespread neuronal recruitment. A, C, Recruitment of identified neurons during two example seizures is color-coded, with early (cool colors) and late activation (hot colors). Direction of seizure propagation is illustrated with an arrow, for a seizure with a spiral pattern (A) and wave-like pattern (C). B, D, Selected individual ΔF/F0 traces for PV-INs (red) and putative excitatory cells (green) illustrating activity in the immediate preictal period.
Figure 5.
Figure 5.
Neural activity during seizure initiation and propagation. A, Baseline activity is extracted from a 4 min window before temperature elevation. The preictal period (at least 8 min immediately preceding the seizure in Scn1a+/− mice, or a temperature matched epoch in wild-type mice) is broken into two 4 min segments (early and late preictal). B, C, Raster plots of 30 s of neuronal activity of putative principal cells (black) and PV-INs (red) from an Scn1a+/− (B) and a wild-type mouse (C) during temperature elevation, that, in Scn1a+/− mice, leads to a seizure.
Figure 6.
Figure 6.
Neuronal firing properties. Burst amplitude (A), burst width (B), burst rate (C), burst complexity (D), and de-convolved firing rate (E) for wild-type and Scn1a+/− mice during baseline, early, and late preictal periods. Top, Violin plots express the shape of the distribution, white circles indicate the median, and black lines represent the 25–75% quartiles. Bottom, Corresponding cumulative distribution function (CDF) for the above data. Statistical tests were performed using a Wilcoxson rank sum test and Bonferroni corrected for multiple comparisons. For C and E, all pairwise comparisons were statistically significant after multiple comparison correction.
Figure 7.
Figure 7.
PV-IN activity profiles. Burst amplitude (A), burst width (B), burst rate (C), burst complexity (D), and de-convolved firing rate (E) for PV-INs in wild-type and Scn1a+/− mice during baseline, early, and late preictal periods. Violin plots express the shape of the distribution, white circles indicate the median, and black lines represent the 25–75% quartiles. Statistical tests were performed using a Wilcoxson rank sum test and Bonferroni corrected for multiple comparisons.
Figure 8.
Figure 8.
Neuron synchronization. Synchronization (top) and the fraction of significantly correlated pairs of neurons (bottom) was assessed using the maximum of the absolute value of cross-correlation over a 500 ms window between pairwise spike patterns within excitatory cells (A), within PV-INs (B), and between excitatory cells and PV-INs (C). Violin plots express the shape of the distribution, white circles indicate the median, and black lines represent the 25–75% quartiles. Statistical tests comparing synchronization distributions were performed using a Wilcoxson rank sum test and Bonferroni corrected for multiple comparisons. A, All comparisons are significant at p < 0.001 with the exception of between early and late preictal periods in Scn1a+/− mice, which is significant at p < 0.01. The fraction of significant pairs of synchronized neurons was computed by comparison to surrogate datasets at the 95% level.

Comment in

References

    1. Anderson LL, Thompson CH, Hawkins NA, Nath RD, Petersohn AA, Rajamani S, Bush WS, Frankel WN, Vanoye CG, Kearney JA, George AL Jr (2014) Antiepileptic activity of preferential inhibitors of persistent sodium current. Epilepsia 55:1274–1283. 10.1111/epi.12657 - DOI - PMC - PubMed
    1. Baker EM, Thompson CH, Hawkins NA, Wagnon JL, Wengert ER, Patel MK, George A Jr, Meisler MH, Kearney JA (2018) The novel sodium channel modulator GS-458967 (GS967) is an effective treatment in a mouse model of SCN8A encephalopathy. Epilepsia 59:1166–1176. 10.1111/epi.14196 - DOI - PMC - PubMed
    1. Bartos M, Vida I, Jonas P (2007) Synaptic mechanisms of synchronized gamma oscillations in inhibitory interneuron networks. Nat Rev Neurosci 8:45–56. 10.1038/nrn2044 - DOI - PubMed
    1. Beenhakker MP, Huguenard JR (2009) Neurons that fire together also conspire together: is normal sleep circuitry hijacked to generate epilepsy? Neuron 62:612–632. 10.1016/j.neuron.2009.05.015 - DOI - PMC - PubMed
    1. Berdyyeva TK, Frady EP, Nassi JJ, Aluisio L, Cherkas Y, Otte S, Wyatt RM, Dugovic C, Ghosh KK, Schnitzer MJ, Lovenberg T, Bonaventure P (2016) Direct imaging of hippocampal epileptiform calcium motifs following kainic acid administration in freely behaving mice. Front Neurosci 10:53. 10.3389/fnins.2016.00053 - DOI - PMC - PubMed

Publication types

Substances