. 2020 Feb 27;5(4):e135119.
doi: 10.1172/jci.insight.135119.

Identification of Alzheimer's disease-associated rare coding variants in the ECE2 gene

Affiliations

Identification of Alzheimer's disease-associated rare coding variants in the ECE2 gene

Xinxin Liao et al. JCI Insight. .

Abstract

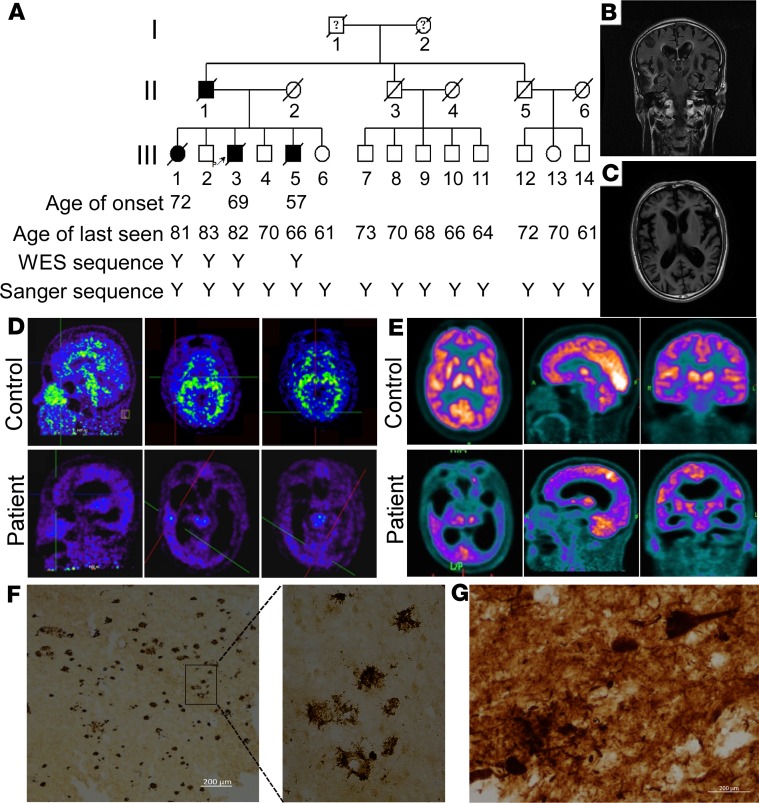
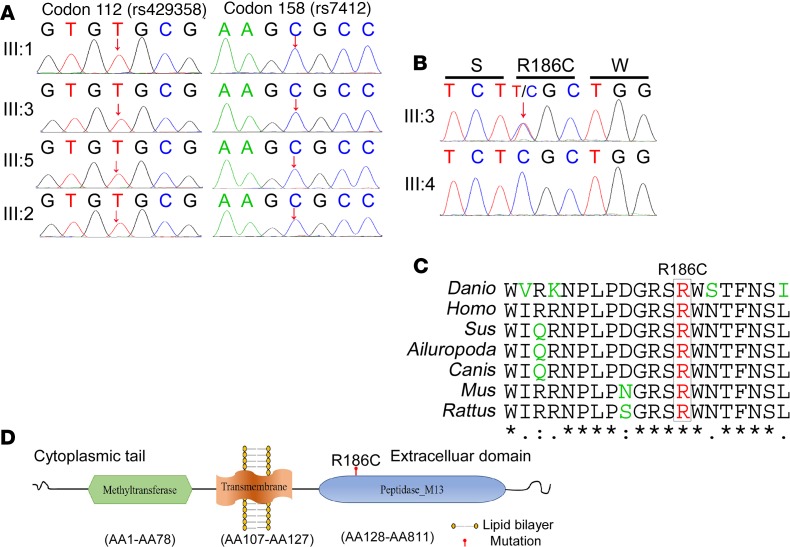
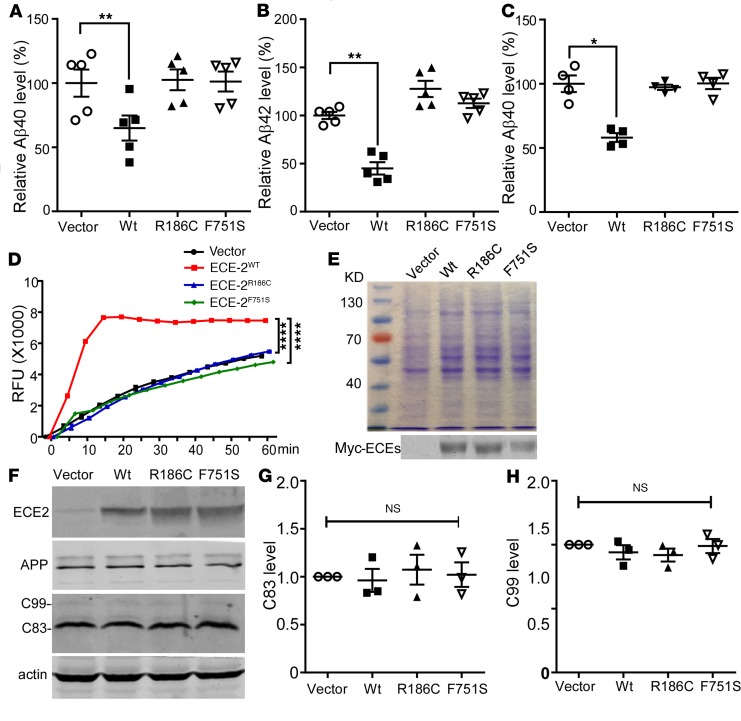
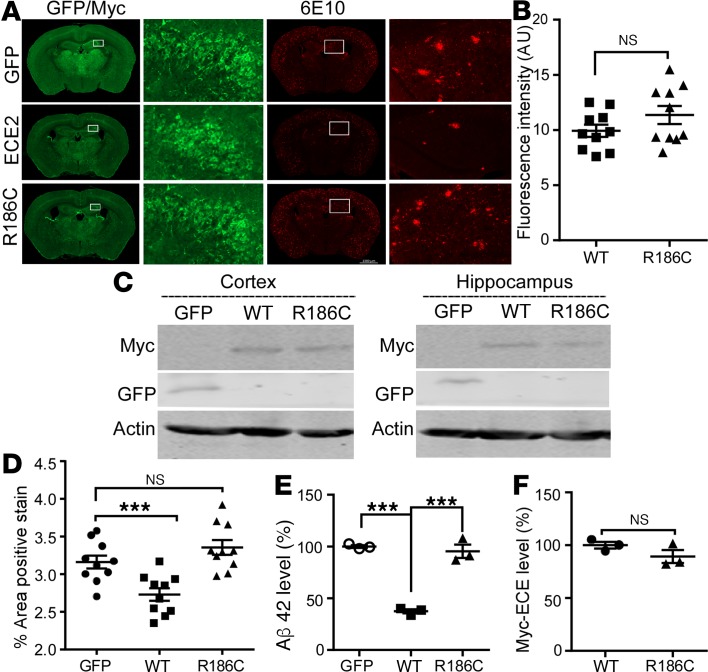
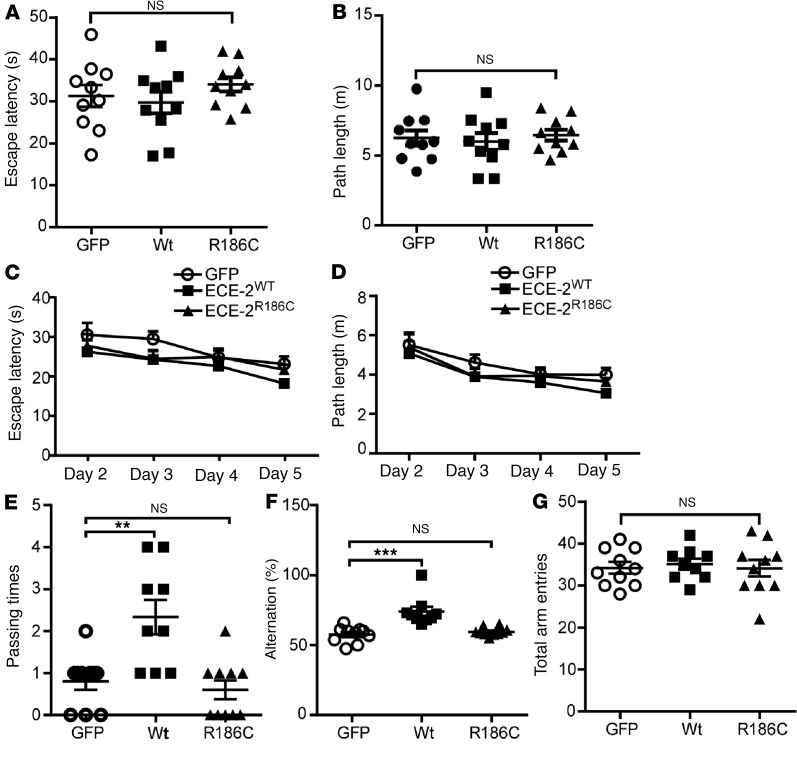
Accumulation of amyloid β protein (Aβ) due to increased generation and/or impaired degradation plays an important role in Alzheimer's disease (AD) pathogenesis. In this report, we describe the identification of rare coding mutations in the endothelin-converting enzyme 2 (ECE2) gene in 1 late-onset AD family, and additional case-control cohort analysis indicates ECE2 variants associated with the risk of developing AD. The 2 mutations (R186C and F751S) located in the peptidase domain in the ECE2 protein were found to severely impair the enzymatic activity of ECE2 in Aβ degradation. We further evaluated the effect of the R186C mutation in mutant APP-knockin mice. Overexpression of wild-type ECE2 in the hippocampus reduced amyloid load and plaque formation, and improved learning and memory deficits in the AD model mice. However, the effect was abolished by the R186C mutation in ECE2. Taken together, the results demonstrated that ECE2 peptidase mutations contribute to AD pathogenesis by impairing Aβ degradation, and overexpression of ECE2 alleviates AD phenotypes. This study indicates that ECE2 is a risk gene for AD development and pharmacological activation of ECE2 could be a promising strategy for AD treatment.

Keywords: Alzheimer’s disease; Genetic variation; Neuroscience.


Conflict of interest statement

Conflict of interest: The authors have declared that no conflict of interest exists.

Figures

Figure 1
Figure 1. Pedigree and clinical features.
(A) Pedigree of family A with Alzheimer’s disease. Subjects in the family were identified by number in 3 generations I, II, and III. Open symbols = unaffected; filled symbols = affected; symbols with a question mark = phenotype unknown; symbols with a diagonal line = deceased subjects; squares = male; circles = female; arrow indicates the proband; Y indicates the analyzed subject. (B and C) Structural magnetic resonance imaging (MRI) of patient III: 3. Coronal T2 flair MRI (B) and axial T1-weighted MRI (C) showed widespread atrophy in cortex and hippocampus. (D) 11C-Pittsburgh compound B (PiB) PET. Compared with the control (III:4, top row), patient III:3 (bottom row) showed increased PiB signal accumulation in frontal lobe (left), temporal lobe (middle), and occipital lobe (right). (E) 18F-fluorodeoxyglucose (18F-FDG) PET. Axial (top, left), sagittal (top, middle), and coronal (top, right) images from the control III:4; axial (bottom, left), sagittal (bottom, middle), and coronal (bottom, right) images from patient III:3. Hypometabolic activity in temporal-parietal, frontal, and occipital cortices of patient III:3. (F) Amyloid plaques in brain tissue sections from patient III:3 were immunostained with anti-Aβ antibody 6E10. (G) Phospho-tau staining in brain tissue sections from patient III:3. Scale bars: 200 μm.
Figure 2
Figure 2. ApoE genotyping and bioinformatics analysis of R186C in the ECE2 gene.
(A) Sanger sequencing of ApoE genotyping of codon 112 (rs429358) and codon 158 (rs7412). The arrow indicates the position of the single-nucleotide polymorphism. (B) Sanger sequencing of the ECE2 gene of the proband III:3 (up) and control III:4 (bottom) in family A with the c.556C>T, p.186R>C mutation. (C) R186 is a highly conserved residue across species. (D) Schematic diagram of the ECE2 protein. R186 is located in the M13 peptidase domain of ECE2.
Figure 3
Figure 3. Effect of ECE2 mutants on Aβ levels and in vitro enzymatic activity.
20E2 cells were transfected with vector, ECE2WT, ECE2R186C, or ECE2F751S constructs for 72 hours. Levels of Aβ40 and Aβ42 from conditioned medium and cell lysates were measured using sandwich ELISA. (A) Aβ40 level in the conditioned media of 20E2 cells (n = 5). (B) Aβ42 level in the conditioned media of 20E2 cells (n = 5). (C) Aβ40 level in cell lysates of 20E2 cells (n = 4). For in vitro enzymatic activity test, HEK293 cells were transiently transfected with vector, ECE2WT, ECE2R186C, or ECE2F751S constructs for 48 hours, and the proteins were purified under native conditions. (D) McaBk2 peptide (10 μM) in 0.2 M sodium acetate buffer (pH 5.5) was incubated with purified vector, ECE2WT, ECE2R186C, or ECE2F751S proteins at 37°C for 1 hour. Relative fluorescent units (RFU) were recorded at Ex/Em = 320 nm/405 nm (n = 3). (E) Identification of purified proteins by Coomassie staining (upper) and Western blotting (bottom) (n = 3). (F) 20E2 cells were transfected with vector, ECE2WT, ECE2R186C, or ECE2F751S plasmids, and cell lysates were blotted for APP, C-terminal fragments (C83 and C99), and ECE2. Full-length APP and APP C-terminal fragments were detected with C20 antibody. ECE2 variants were detected by 9E10 antibody. C83 (G) and C99 (H) quantified and expressed as the ratio of C83 or C99 level in vector-expressing cells (n = 3). All results are expressed as mean ± SEM. Statistical significance was determined by ANOVA followed by Bonferroni’s multiple-comparisons test.
Figure 4
Figure 4. Overexpressed ECE2WT, but not ECE2R186C mutant, reduced the total amyloid load in APPNL-G-F/NL-G-F-knockin mice.
Intracranial injection of rAAV9-GFP-Vector, rAAV9-ECE2WT, or rAAV9-ECE2R186C into the cerebral lateral ventricle of neonatal APPNL-G-F/NL-G-F-knockin mice at P0. (A) GFP, ECE2WT, and ECE2R186C expression in bilateral cortex, hippocampus, and subcortical area; Aβ plaques were detected by 6E10 in APPNL-G-F/NL-G-F-knockin mouse brain sections injected with GFP, ECE2WT, or ECE2R186C viruses (n = 10). Scale bar: 1000 μm. (B) Quantification of average immunofluorescence intensities of ECE2WT and ECE2R186C proteins in APPNL-G-F/NL-G-F-knockin mouse brain sections after subtracting the image background (n = 10). (C) Cortex and hippocampus tissue lysates were blotted for GFP, ECE2WT, and ECE2R186C (n = 3). (D) Percentages of plaques were quantified as shown in the scatter diagram (n = 10). (E) Level of Aβ42 in bilateral hippocampus of APPNL-G-F/NL-G-F-knockin mice by ELISA. ELISA readout for Aβ40 was not higher than background noise (n = 3). (F) Quantification of ECE2WT and ECE2R186C expression in bilateral hippocampus (n = 3). All results are expressed as mean ± SEM. Two-tailed Student’s t test was used to analyze the difference between 2 groups, and multiple comparisons were analyzed by ANOVA followed by Bonferroni’s multiple-comparisons test.
Figure 5
Figure 5. Overexpressed ECE2WT, but not ECE2R186C mutant, alleviated cognitive deficits in APPNL-G-F/NL-G-F-knockin mice.
(AE) A Morris water maze test consisted of 1 day of visible platform trials and 4 days of hidden platform trials, plus a probe trial 24 hours after the last hidden platform trial. Animal movement was traced and recorded by ANY-maze tracking software. In the visible platform tests, mice in each group exhibited a similar (A) escape latency and (B) swimming path length to escape onto the visible platform. In hidden platform tests, mice were trained with 5 trials per day for 4 days. ECE2WT group mice showed shorter latency (C) and path length (D) to escape onto the visible platform on the third and fourth days, but without statistically significant differences. (E) In the probe trial on the sixth day, ECE2WT group mice traveled into the third quadrant, where the hidden platform was previously placed, significantly more times than GFP and ECE2R186C groups. (F and G) The Y-maze test was performed. ECE2WT-injected mice exhibited significantly higher percentage alternation than GFP-injected mice, whereas ECE2R186C-injected mice and GFP-injected mice performed similarly (F). No difference between arm entries was observed between groups (G). Data represented as mean ± SEM (for behavior tests, n = 10 GFP, 9 ECE2WT, and 10 ECE2R186C). Significance was assessed by 1-way ANOVA with Newman-Keuls post hoc test.

References

    1. Zhang Y, Song W. Islet amyloid polypeptide: Another key molecule in Alzheimer’s pathogenesis? Prog Neurobiol. 2017;153:100–120. doi: 10.1016/j.pneurobio.2017.03.001. - DOI - PubMed
    1. Lee JH, et al. Identification of novel loci for Alzheimer disease and replication of CLU, PICALM, and BIN1 in Caribbean Hispanic individuals. Arch Neurol. 2011;68(3):320–328. - PMC - PubMed
    1. Li Y, et al. SORL1 variants and risk of late-onset Alzheimer’s disease. Neurobiol Dis. 2008;29(2):293–296. doi: 10.1016/j.nbd.2007.09.001. - DOI - PMC - PubMed
    1. Elias-Sonnenschein LS, Bertram L, Visser PJ. Relationship between genetic risk factors and markers for Alzheimer’s disease pathology. Biomark Med. 2012;6(4):477–495. doi: 10.2217/bmm.12.56. - DOI - PubMed
    1. Wetzel-Smith MK, et al. A rare mutation in UNC5C predisposes to late-onset Alzheimer’s disease and increases neuronal cell death. Nat Med. 2014;20(12):1452–1457. doi: 10.1038/nm.3736. - DOI - PMC - PubMed

Publication types

Substances

Grants and funding