. 2020 Feb 26;10(1):3504.
doi: 10.1038/s41598-020-60323-9.

Establishment and optimization of a hemp (Cannabis sativa L.) agroinfiltration system for gene expression and silencing studies

Affiliations

Establishment and optimization of a hemp (Cannabis sativa L.) agroinfiltration system for gene expression and silencing studies

Michihito Deguchi et al. Sci Rep. .

Abstract

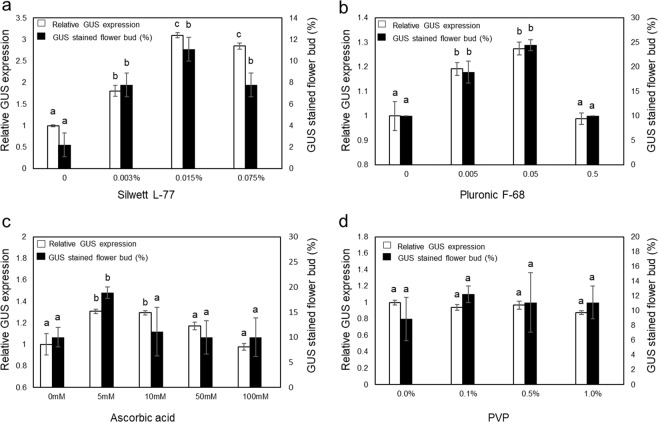
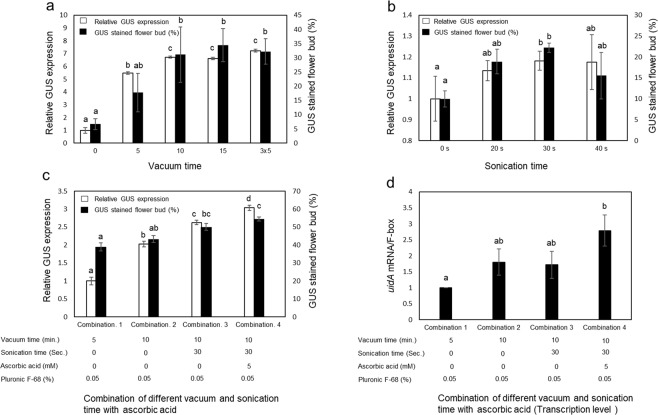
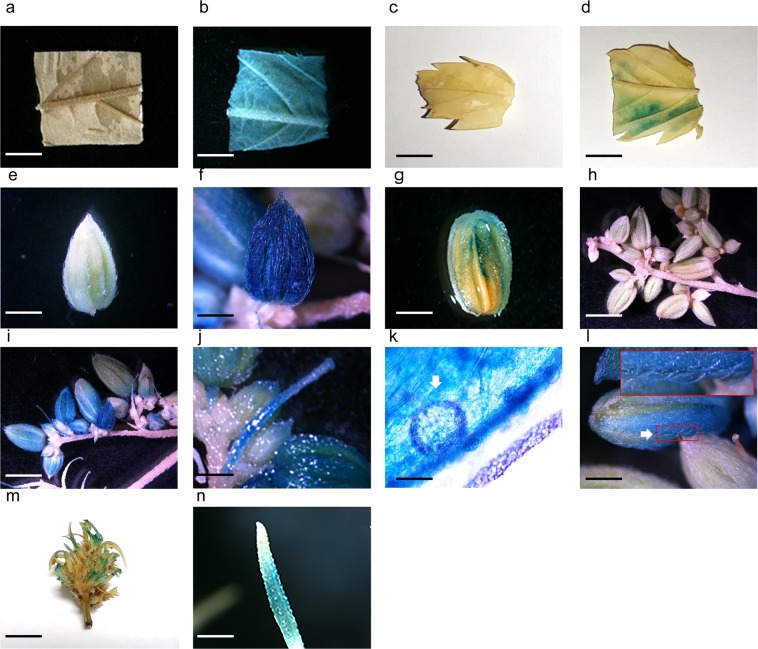
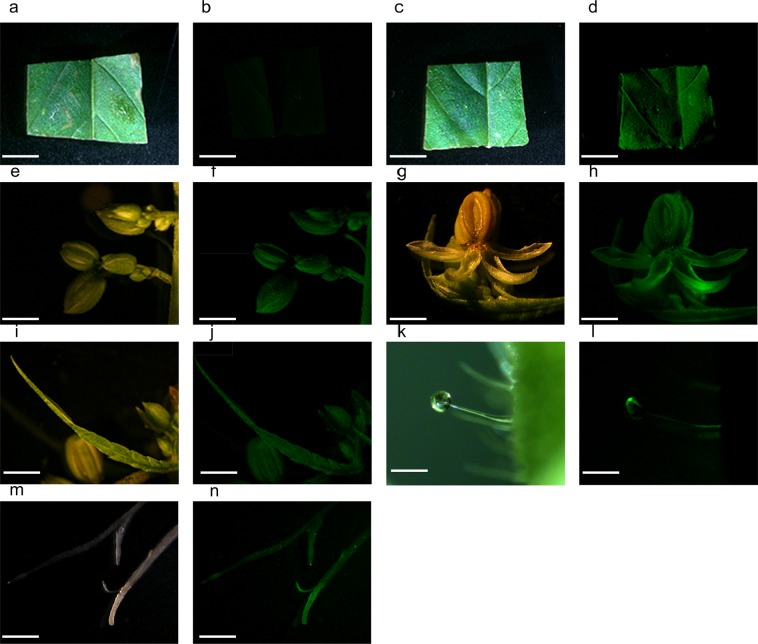
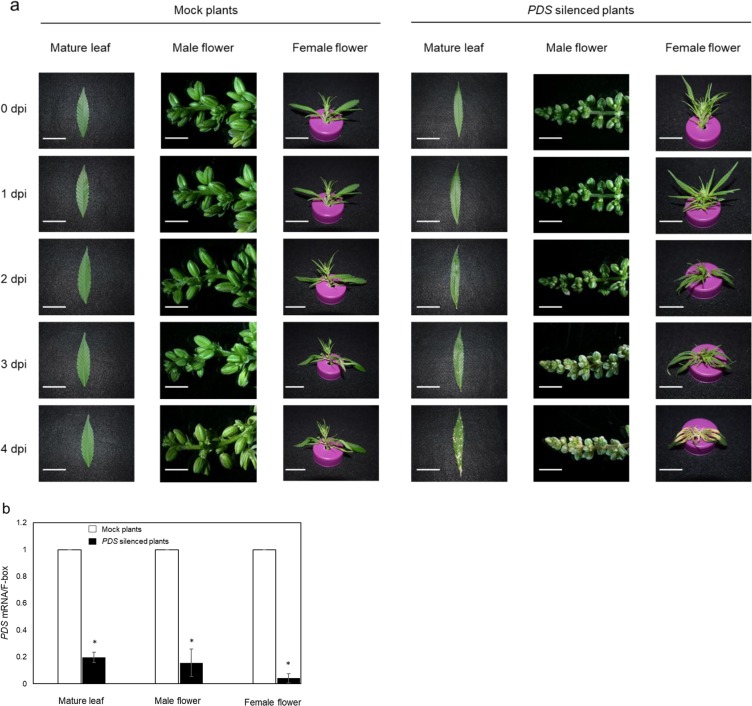
Industrial hemp (Cannabis sativa L.) is a high-yielding annual crop primarily grown for fiber, seeds, and oil. Due to the phytochemical composition of hemp, there has been an increased interest in the market for nutraceuticals and dietary supplements for human health. Recent omics analysis has led to the elucidation of hemp candidate genes involved in the syntheses of specialized metabolites. However, a detailed study of these genes has not been undertaken due to the lack of a stable transformation system. We report for the first time an agroinfiltration system in hemp utilizing vacuum infiltration, which is an alternative method to stable transformation. A combination of 0.015% Silwett L-77, 5 mM ascorbic acid, and thirty second sonication followed by a 10-minute vacuum treatment resulted in the highest β-glucuronidase expression in the leaf, male and female flowers, stem, and root tissues. The phytoene desaturase gene was silenced with a transient hairpin RNA expression, resulting in an albino phenotype in the leaves and the male and female flowers. This agroinfiltration system would be useful for overexpression and silencing studies of target genes to regulate the yield of specialized metabolites in hemp.


Conflict of interest statement

The authors declare no competing interests.

Figures

Figure 1
Figure 1
Schematic of the T-DNA structure of the binary vectors used for transient gene expression. (a) uidA gene (ORF is 1806 bp); (b) eGFP gene (ORF is 723 bp); (c) pEarleyGate 101; (d) Sense and antisense partial PDS fragment (601–800 bp); (e) Empty pK7GWIWG2(I) as the negative control; 35 S P: Cauliflower mosaic virus 35 S promoter; lacUV5P: lacUV5 promoter; OCS T: Terminator of the octopine synthase gene; 35 S T: Cauliflower mosaic virus 35 S promoter; attB1 and attB2: Gateway BP reaction recombination site; attRI and attR2: Gateway LR reaction recombination site; ccd8: E. coli toxic protein coding gene; CmR: Chloramphenicol resistance gene; RB: Right border; LB: Left border.
Figure 2
Figure 2
Effect of chemical additives on transient GUS expression. Agrobacterium GV3101 harboring pEarleyGate 101-uidA was infiltrated with different chemical additives; (a) Silwett L-77, (b) Pluronic F-68, (c) ascorbic acid and d) PVP as measured by image analysis of the GUS-stained female flowers collected 45 days after germination. The total GUS expression value without additives in each figure was used to normalize the relative expression level. Bars indicate ± standard error of the mean. Means followed by the same letter indicate no significant difference (P < 0.05). Statistical analysis was completed using a 1-way ANOVA with Tukey’s multiple comparison test.
Figure 3
Figure 3
Effect of various treatments on the transient GUS expression. Effect of (a) Vacuum time; (b) Sonication time; (c) Combination of different vacuum times, sonication times and ascorbic acid concentrations. (d) Transcriptomic analysis of the combination of different vacuum times, sonication times and different concentrations of ascorbic acid. The control conditions were 5 minutes of vacuum, no sonication and no ascorbic acid to normalize the GUS gene expression. Bars indicate ±standard error of the mean. Identical letters indicate no significant difference (P < 0.05). Statistical analysis was performed using a 1-way ANOVA with Tukey’s multiple comparison test.
Figure 4
Figure 4
Effect of the Agrobacterium strains on the transient GUS expression in male flowers (a). Effect of the hemp cultivars on the transient GUS expression in the mature leaf (b). Bars represent ± standard error of the mean. Identical letters indicate no significant difference (P < 0.05). Statistical analysis was performed using a 1-way ANOVA with Tukey’s multiple comparison test.
Figure 5
Figure 5
GUS staining in various CRS-1 tissues/organs. The pEarleyGate 101-uidA transformed Agrobacterium GV3101 culture that contains 0.015% of Silwett L-77, 0.05% of Pluronic F-68 and 5 mM of ascorbic acid was vacuum infiltrated for 10 minutes after 30 seconds of sonication. The pictures of GUS stained tissues/organs were taken 4 days after infiltration. (a) Control hemp leaf discs (bar 500 µm). (b) Agroinfiltrated leaf discs (bar 500 µm). (c) Control mature leaf (bar 15 mm). (d) Agroinfiltrated mature leaf (bar 15 mm). (e) Control pollen sac (bar 600 µm). (f) Agroinfiltrated pollen sac (bar 600 µm). (g) Agroinfiltrated anthers and sepals (bar 120 µm). (h) Control pollen sac clusters (bar 200 µm). (i) Agroinfiltrated pollen sac clusters (bar 200 µm). (j) Agroinfiltrated filaments (bar 120 µm). (k) Agroinfiltrated pollen (bar 25 µm). (l) Agroinfiltrated nonglandular trichomes (bar 400 µm). (m) Agroinfiltrated female flower (bar 13 mm). (n) Agroinfiltrated pistil (bar 300 µm). Arrows indicate pollen grain and nonglandular trichomes in (k,l), respectively.
Figure 6
Figure 6
Transient GFP expression in various CRS-1 tissues/organs. The pEarleyGate 101-eGFP transformed Agrobacterium GV3101 culture that contains 0.015% of Silwett L-77, 0.05% of Pluronic F-68 and 5 mM of ascorbic acid was vacuum infiltrated for 10 minutes after 30 seconds of sonication. The pictures of GFP fluorescence were taken 4 days after infiltration. (a). Bright field image of an empty vector pEarleyGate 101-treated leaf disc. Bar 800 µm (b). GFP fluorescence of an empty vector pEarleyGate 101-treated leaf disc. Bar 800 µm (c). Bright field image of a pEarleyGate 101-eGFP-treated leaf disc. Bar 800 µm (d). GFP fluorescence of a pEarleyGate 101-eGFP-treated leaf disc (e). Bright field image of a pEarleyGate 101-eGFP-treated pollen sac cluster. Bar 200 µm. (f). GFP fluorescence of a pEarley Gate 101-eGFP-treated pollen sac cluster. Bar 200 µm. (g). Bright field image of pEarleyGate 101-eGFP-treated anther and sepal. Bar 120 µm (h). GFP fluorescence of pEarley Gate 101-eGFP-treated anthers and sepals. Bar 120 µm (i). Bright field image of a pEarleyGate 101-eGFP-treated filament. Bar 200 µm (j). GFP fluorescence of a pEarley Gate 101-eGFP-treated filament. Bar 200 µm (k). Bright field image of a pEarleyGate 101-eGFP-treated capitate-stalked trichome. Bar 150 µm (l). GFP fluorescence of a pEarley Gate 101-eGFP-treated capitate-stalked trichome. Bar 150 µm (m). Bright field image of a pEarleyGate 101-eGFP-treated root from a hemp seedling. Bar 10 mm (n). GFP fluorescence of a pEarley Gate 101-eGFP-treated root from a hemp seedling. Bar 10 mm.
Figure 7
Figure 7
Silencing of hemp PDS gene expression by pK7GWIWG2(I)-CsPDS RNAi. (a) Phenotype of hemp mature leaf (bar 15 mm), male flower (bar 5 mm) and female flower (bar 10 mm) caused by silencing of the PDS gene. The pictures were taken at 0, 1, 2, 3 and 4 days postinfection (dpi). Ten leaves, ten male flowers and ten female flowers were agroinfiltrated and seven leaves, eight male flowers and eight female flowers showed the albino phenotype. (b) Analysis of the PDS gene expression to study the efficiency of gene silencing by agroinfiltration. The empty vector pK7GWIWG2(I) was transiently expressed (Mock) and used for normalization of PDS gene expression. Bars ± standard error of the mean. Asterisk indicates a significant difference in the statistical analysis (P < 0.05) in paired t-tests.

References

    1. Andre CM, Hausman JF, Guerriero G. Cannabis sativa: The plant of the thousand and one molecules. Frontiers in Plant Science. 2016;7:1–19. doi: 10.3389/fpls.2016.00019. - DOI - PMC - PubMed
    1. Chandra, S., Lata, H., Khan, I., & ElSohly, M. A. Cannabis Sativa L.: Botany and Horticulture in Cannabis sativa L.: Botany and Biotechnology. Cham. Switzerland: Springer. 79–100 (2017).
    1. Izzo AA, Borrelli F, Capasso R, Di Marzo V, Mechoulam R. Non-psychotropic plant cannabinoids: new therapeutic opportunities from an ancient herb. Trends Pharmacological Science. 2009;30:515–527. doi: 10.1016/j.tips.2009.07.006. - DOI - PubMed
    1. Gonçalves J, et al. Cannabis and Its Secondary Metabolites: Their Use as Therapeutic Drugs, Toxicological Aspects, and Analytical Determination. Medicines. 2019;6:1. doi: 10.3390/medicines6010031. - DOI - PMC - PubMed
    1. Gagne SJ, et al. Identification of olivetolic acid cyclase from Cannabis sativa reveals a unique catalytic route to plant polyketides. Proceedings of the National Academy of Sciences USA. 2012;109:12811–12816. doi: 10.1073/pnas.1200330109. - DOI - PMC - PubMed

Publication types

MeSH terms