. 2020 Feb 26;10(1):3470.
doi: 10.1038/s41598-020-60409-4.

Combining DNMT and HDAC6 inhibitors increases anti-tumor immune signaling and decreases tumor burden in ovarian cancer

Affiliations

Combining DNMT and HDAC6 inhibitors increases anti-tumor immune signaling and decreases tumor burden in ovarian cancer

Sara Moufarrij et al. Sci Rep. .

Erratum in

Abstract

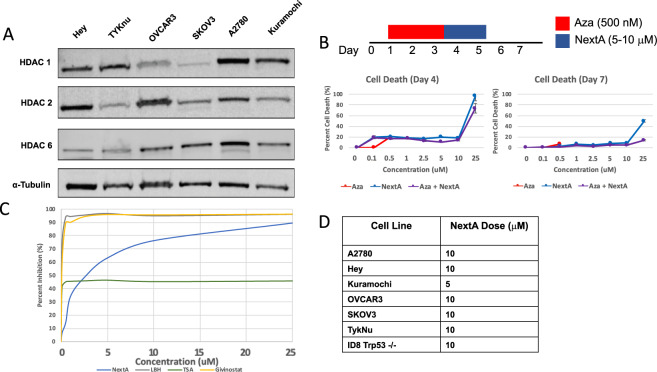
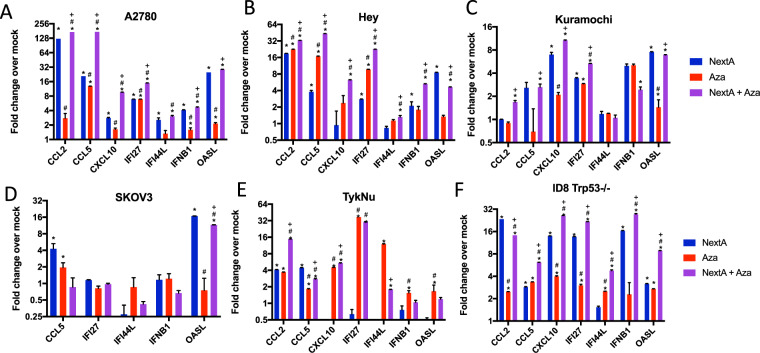
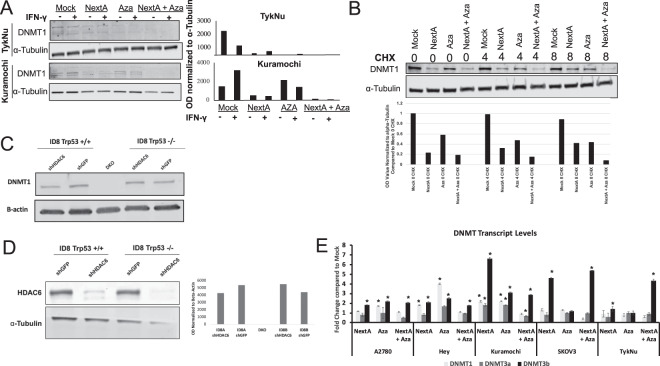
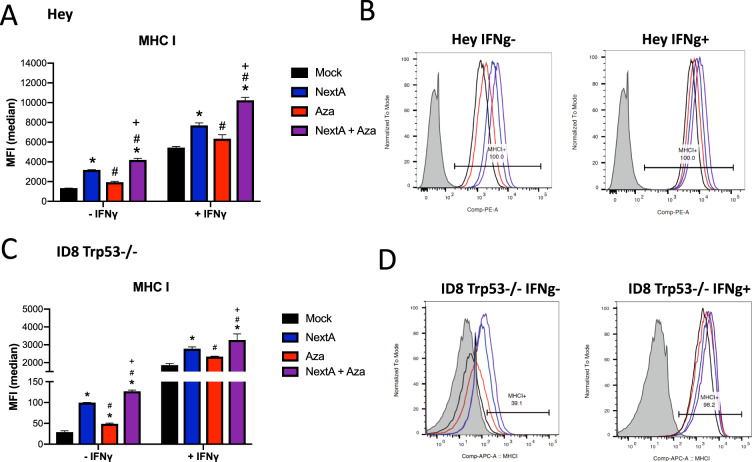
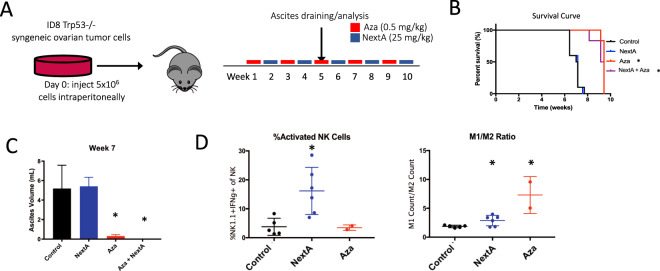
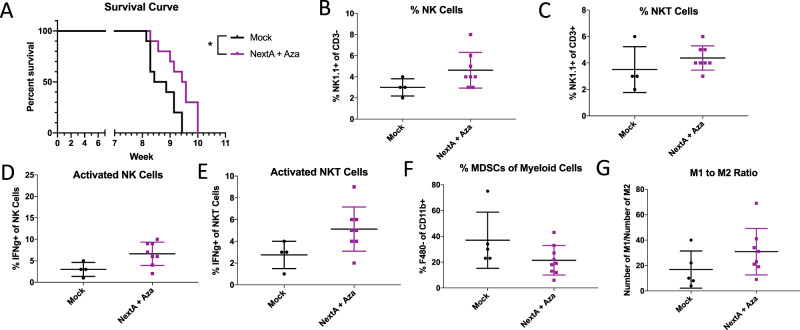
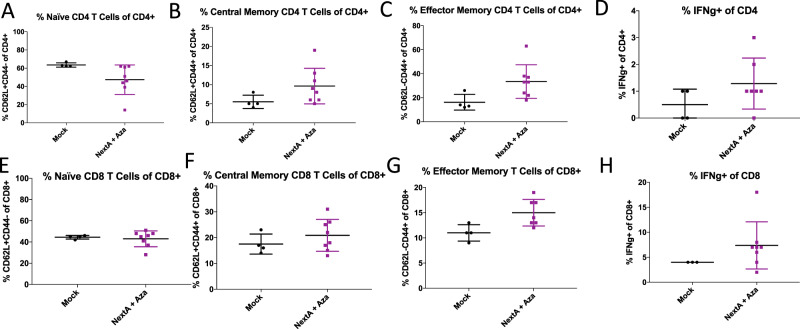
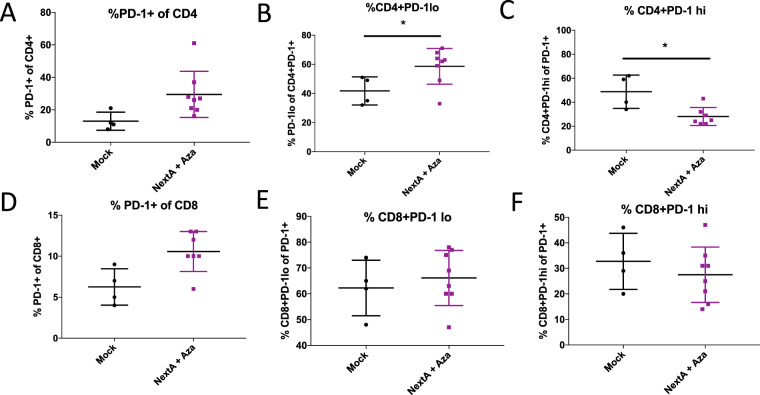
Novel therapies are urgently needed for ovarian cancer, the deadliest gynecologic malignancy. Ovarian cancer has thus far been refractory to immunotherapies that stimulate the host immune system to recognize and kill cancer cells. This may be because of a suppressive tumor immune microenvironment and lack of recruitment and activation of immune cells that kill cancer cells. Our previous work showed that epigenetic drugs including DNA methyltransferase inhibitors and histone deacetylase 6 inhibitors (DNMTis and HDAC6is) individually increase immune signaling in cancer cells. We find that combining DNMTi and HDAC6i results in an amplified type I interferon response, leading to increased cytokine and chemokine expression and higher expression of the MHC I antigen presentation complex in human and mouse ovarian cancer cell lines. Treating mice bearing ID8 Trp53-/- ovarian cancer with HDAC6i/DNMTi led to an increase in tumor-killing cells such as IFNg+ CD8, NK, and NKT cells and a reversal of the immunosuppressive tumor microenvironment with a decrease in MDSCs and PD-1hi CD4 T cells, corresponding with an increase in survival. Thus combining the epigenetic modulators DNMTi and HDAC6i increases anti-tumor immune signaling from cancer cells and has beneficial effects on the ovarian tumor immune microenvironment.


Conflict of interest statement

The authors declare no competing interests.

Figures

Figure 1
Figure 1
Ovarian cancer cell lines are sensitive to HDAC6 inhibitors. (A) Baseline levels of HDAC protein vary between cell lines. Protein was isolated from six different human ovarian cancer cell lines and levels of HDACs 1, 2, and 6 were assessed. α-tubulin was used as a loading control. HDAC1 and HDAC6 were run on the same blot which was cut to image, then stripped and reprobed for HDAC2 and stripped and reprobed for α-tubulin. Cropped blots are shown here and black lines indicate where one part of the blot ends and another begins. Figure S7A shows the entire blot images. (B) The Hey cell line was treated with indicated concentrations of the HDAC6 inhibitor Nexturastat A (NextA) and 500 nM of the DNMT inhibitor 5-azacytidine (Aza) in the following treatment schema: 3 days of Aza treatment followed by 2 days of NextA treatment. Cytotoxicity was assessed at Days 4 and 7 using the CellTox Green cytotoxicity assay, which quantitatively detects cell death. (C) The Hey cell line was treated with indicated concentrations of NextA and broader spectrum HDAC inhibitors Givinostat (Class I & Class II HDACi), LBH (pan-HDACi), TSA (pan-HDACi). The percent inhibition of HDAC activity was calculated using the HDAC-Glo assay. (D) The optimal NextA dose for each cell line was chosen as the dose that inhibited greater than 50% of HDAC activity while not causing more than 20% cytotoxicity.
Figure 2
Figure 2
DNMTi and HDAC6i increase the expression of Interferon Stimulated Genes (ISGs) and cytokines. RNA was isolated from ovarian cancer cell lines at Day 7 of the treatment schema in Fig. 1 and qRT-PCR was performed for ISGs IFI27, OASL, IFI44L, and IFNB1 and cytokines CCL2, CCL5, and CXCL10. Fold change is indicated relative to Mock for each of the following treatments: NextA (blue), Aza (red), and NextA+ Aza (purple) in the following cell lines: (A) A2780, (B) Hey, (C) Kuramochi, (D) SKOV3 (E) TykNu, (F) ID8 Trp53−/−. Fold change was calculated relative to the reference gene TBP. A t-test was performed for statistical significance. *p < 0.05 compared to Mock; #p < 0.05 compared to NextA; +p < 0.05 compared to Aza.
Figure 3
Figure 3
DNMT1 protein levels are decreased by combination treatment of DNMTi and HDAC6i. (A) Ovarian cancer cell lines were treated as in Fig. 1 and protein was extracted at Day 7 after treatment with IFN-gamma (IFN-γ+) (to assess MHC I and PD-L1 expression, in later figures) or control (IFN-γ -). Protein was isolated and immunoblots were run for the DNMT1 protein and α-tubulin as a loading control. Immunoblot membranes were cut and probed separately for DNMT1 (about 188 kDa) and α-tubulin (50 kDa). Cropped blots are shown here, and black lines indicate where one part of the blot ends and another begins. Figure S7B shows the entire blot images. (B) The TykNu cell line was treated as in (A) and the protein synthesis cycloheximide added to cells on Day 7 for 0, 4, and 8 hours at 10 μM as indicated on the blot. Protein was isolated and immunoblots were run for the DNMT1 protein and α-tubulin as a loading control. Immunoblot membranes were cut and probed separately for DNMT1 (about 188 kDa) and α-tubulin (50 kDa). Cropped blots are shown here, and black lines indicate where one part of the blot ends and another begins. Figure S7C shows the entire blot images. (C) Stable knockdowns of the HDAC6 protein were generated in the ID8 Trp53+/+ and Trp53−/− cell lines. Protein was extracted and immunoblots were run for the DNMT1 protein with B-actin as a loading control. Immunoblot membranes were probed for DNMT1 (about 188 kDa) and α-tubulin (50 kDa). Cropped blots are shown here and black lines indicate where one part of the blot ends and another begins. Figure S7D shows the entire blot images. (D) Immunoblot showing knockdown of HDAC6 protein with a-Tubulin as a loading control. Protein was extracted and immunoblots were run for the HDAC6 protein with B-actin as a loading control. Immunoblots were probed for HDAC6 (131 kDa) and tubulin (50 kDa). Cropped blots are shown here and black lines indicate where one part of the blot ends and another begins. Figure S7E shows the entire blot images. (E) Ovarian cancer cell lines were treated as in Fig. 1 and RNA was extracted at Day 7. qRT-PCR was run for DNMT1, DNMT3a, and DNMT3b and TBP was used as a reference gene. *p < 0.05 compared to Mock.
Figure 4
Figure 4
MHC I expression on the cell surface is increased after DNMTi and HDAC6i treatment. Hey human ovarian cancer cells and ID8 Trp53−/− mouse ovarian cancer cells were treated as in Fig. 1 and cells were prepared at Day 7 after treatment with IFN-gamma (IFN-γ+) or control (IFN-γ−). Cells were stained for MHC I surface marker by flow cytometry. (A) MHC I MFI in Hey cell line. (B) Representative histogram of Hey MHC I expression (C) MHC I MFI in ID8 Trp53−/− cell line. (D) Representative histogram of ID8 Trp53−/− MHC I expression. A one way ANOVA was performed for statistical significance: *p < 0.05 compared to Mock; #p < 0.05 compared to NextA; +p < 0.05 compared to Aza.
Figure 5
Figure 5
DNMTi+ HDAC6i combination treatment increases survival and changes the tumor microenvironment in the ID8 Trp53−/− mouse model of ovarian cancer. (A) Schematic of drug treatment. Mice were given intraperitoneal injections with 5.0 × 10⁶ MOSE ID8 Trp53−/− murine ovarian cancer cells. Treatment began 1 week after tumor inoculation and ended when the tumor burden was deemed excessive for the animal as per our IACUC protocol. Mice were injected with 5-azacytidine (Aza) and Nexturastat (NextA) 5 days a week on alternating weeks. Mice in the 5-azacytidine group were given 0.5 mg/kg of 5-azacytidine dissolved in 100 ul of PBS solution daily. Mice in the NexturastatA group were given 25 mg/kg of Nexturastat A dissolved in 100 ul PEG vehicle solution(70% Polyethylene glycol, 10% Tween80, 20% absolute ethanol) daily. Mice in the NextA+Aza group were given 5-azacytidine and NexturastatA on an alternating weekly basis. Mice in the control group were given a drug vehicle comprised of 70% Polyethylene glycol, 10% Tween 80, and 20% 200 proof absolute ethanol as a vehicle control for Nexturastat or PBS as a vehicle control for 5-azacytidine. (B) Both the Aza and NextA + Aza groups exhibited significantly longer survival compared to the Mock and NextA groups (*p < 0.05 by the log-rank (Mantel-Cox) test). (C) Ascites volume (tumor burden) was measured at Week 7. *p < 0.05 by one way ANOVA. (D) Ascites were isolated from mice in three groups with ascites at Week 7 and immunophenotyping was performed for M1 and M2 macrophages and NK cells. *p < 0.05 by one way ANOVA.
Figure 6
Figure 6
DNMTi+ HDAC6i combination treatment improves response and changes the TME in the ID8 Trp53−/− mouse model of ovarian cancer. (A) C57Bl6 mice were injected with ID8 Trp53−/− cells and treated with 0.5 mg/mL Aza daily every other week and 25 mg/kg NextA daily every other week, alternating weeks as in Fig. 5A. The NextA + Aza group had significantly longer survival compared to the Mock group (p = 0.0128 by log-rank (Mantel-Cox) test)). Ascites were isolated at Week 9 and immunophenotyping was performed to measure: (B) Natural Killer (NK) cells as % NK of CD3- immune cells, (C) Natural Killer T cells as % NK of CD3+ immune cells, (D) Activated NK cells (as %IFNg+ of NK cells), (E) Activated NKT cells (as %IFNg+ of NK+ CD3+ cells), (F) Myeloid Derived Suppressor Cells (MDSCs), and (G) ratio of M1 (defined as CD11b+/Ly6C+ Ly6G-/F480+) to M2 (defined as CD11b+/Ly6C-Ly6G+/F480+) macrophages. T-tests were performed to test significance; *p < 0.05. Plots without * indicate non-significant differences.
Figure 7
Figure 7
DNMTi+ HDAC6i combination treatment changes the T cell phenotype in the ID8 Trp53−/− mouse model of ovarian cancer. C57Bl6 mice were injected with ID8 Trp53−/− cells and treated with 0.5 mg/mL Aza daily every other week and 25 mg/kg NextA daily every other week, alternating weeks as in Fig. 5A. Ascites was isolated from mice in each group and immunophenotyping was performed to measure: (A) Naïve CD4 T cells (defined as %CD62L+CD44- of CD4 cells) (B) Central Memory CD4 T cells (defined as %CD62L+ CD44+ of CD4), (C) Effector Memory CD4 T cells (defined as CD62L-CD44+ of CD4), (D) Activated CD4 T cells (defined as % IFNg+ of CD4 T cells), (E) Naïve CD8 T cells (defined as %CD62L+ CD44- of CD8), (F) Central Memory CD8 T cells (defined as %CD62L+ CD44+ of CD8), (G) Effector Memory CD8 T cells (defined as CD62L-CD44+ of CD8), and (H) Activated CD8 T cells (defined as % IFNg+ of CD8 T cells). T-tests were performed to test significance; *p < 0.05. Plots without * indicate non-significant differences.
Figure 8
Figure 8
DNMTi+ HDAC6i combination treatment affects PD-1 on T cells in the ID8 Trp53−/− mouse model of ovarian cancer. C57Bl6 mice were injected with ID8 Trp53−/− cells and treated with 0.5 mg/mL Aza daily every other week and 25 mg/kg NextA daily every other week, alternating weeks as in Fig. 5A. Ascites was isolated from mice in each group and immunophenotyping was performed to measure: (A) PD-1+ cells of CD4, (B) PD-1lo cells of CD4, (C) PD-1hi cells of CD4, (D) PD-1+ cells of CD8, (E) PD-1lo cells of CD8, and (F) PD-1hi cells of CD8. T-tests were performed to test significance; *p < 0.05. Plots without * indicate non-significant differences.

Similar articles

Cited by

References

    1. Bowtell DD, et al. Rethinking ovarian cancer II: reducing mortality from high-grade serous ovarian cancer. Nat. Rev. Cancer. 2015;15:668–679. - PMC - PubMed
    1. Kroeger PT, Drapkin R. Pathogenesis and heterogeneity of ovarian cancer. Curr. Opin. Obstet. Gynecol. 2017;29:26–34. - PMC - PubMed
    1. Ashworth A, Lord CJ. Synthetic lethal therapies for cancer: what’s next after PARP inhibitors? Nat. Rev. Clin. Oncol. 2018;15:564–576. - PubMed
    1. Schreiber RD, Old LJ, Smyth MJ. Cancer immunoediting: integrating immunity’s roles in cancer suppression and promotion. Sci. 2011;331:1565–1570. - PubMed
    1. Durgeau, A., Virk, Y., Corgnac, S. & Mami-Chouaib, F. Recent Advances in Targeting CD8 T-Cell Immunity for More Effective Cancer Immunotherapy. Front Immunol9 (2018). - PMC - PubMed

Publication types

MeSH terms