

Estimates of healthcare spending for preterm and low-birthweight infants in a commercially insured population: 2008-2016
- PMID: 32103158
- PMCID: PMC7314662
- DOI: 10.1038/s41372-020-0635-z
Estimates of healthcare spending for preterm and low-birthweight infants in a commercially insured population: 2008-2016
Abstract
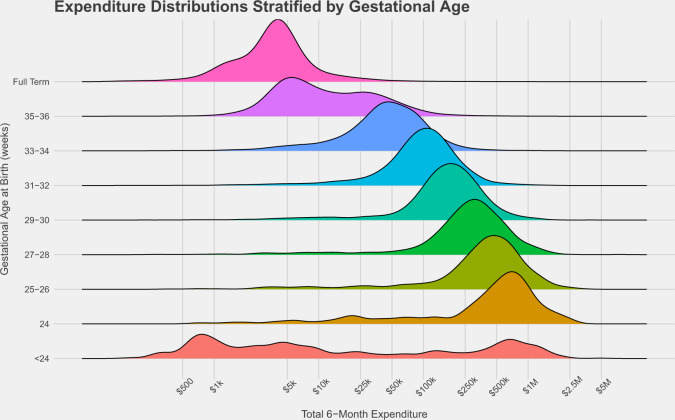
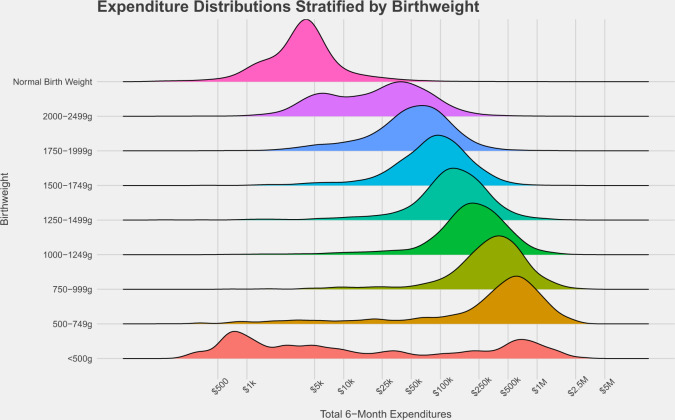
The growth in healthcare spending is an important topic in the United States, and preterm and low-birthweight infants have some of the highest healthcare expenditures of any patient population. We performed a retrospective cohort study of spending in this population using a large, national claims database of commercially insured individuals. A total of 763,566 infants with insurance coverage through Aetna, Inc. for the first 6 months of post-natal life were included, and received approximately $8.4 billion (2016 USD) in healthcare services. Infants with billing codes indicating preterm status (<37 weeks, n = 50,511) incurred medical expenditures of $76,153 on average, while low-birthweight status (<2500 g) was associated with average spending of $114,437. Infants born at 24 weeks gestation (n = 418) had the highest per infant average expenditures of $603,778. Understanding the drivers of variation in costs within gestational age and birthweight bands is an important target for future studies.
Conflict of interest statement
JA is a current employee and Kathe Fox was a former employee of Aetna. The other authors have indicated they have no financial relationships relevant to this article to disclose.
Figures
References
-
- Martin J, Hamilton B, Osterman M, Driscoll A, Mathews T. Births: final data for 2015. National vital statistics report. 2017 https://www.cdc.gov/nchs/data/nvsr/nvsr66/nvsr66_01.pdf. - PubMed
-
- Behrman RE, Butler AS. Preterm birth: causes, consequences, and prevention. 2007 10.1080/01443610802243047. - PubMed
Publication types
MeSH terms
Grants and funding
LinkOut - more resources
Full Text Sources
