. 2020 Mar;579(7800):581-585.
doi: 10.1038/s41586-020-2040-3. Epub 2020 Feb 26.

Sex-specific adipose tissue imprinting of regulatory T cells

Affiliations

Sex-specific adipose tissue imprinting of regulatory T cells

Ajithkumar Vasanthakumar et al. Nature. 2020 Mar.

Erratum in

  • Author Correction: Sex-specific adipose tissue imprinting of regulatory T cells.
    Vasanthakumar A, Chisanga D, Blume J, Gloury R, Britt K, Henstridge DC, Zhan Y, Torres SV, Liene S, Collins N, Cao E, Sidwell T, Li C, Spallanzani RG, Liao Y, Beavis PA, Gebhardt T, Trevaskis N, Nutt SL, Zajac JD, Davey RA, Febbraio MA, Mathis D, Shi W, Kallies A. Vasanthakumar A, et al. Nature. 2021 Mar;591(7851):E26. doi: 10.1038/s41586-020-2251-7. Nature. 2021. PMID: 33674801 No abstract available.

Abstract

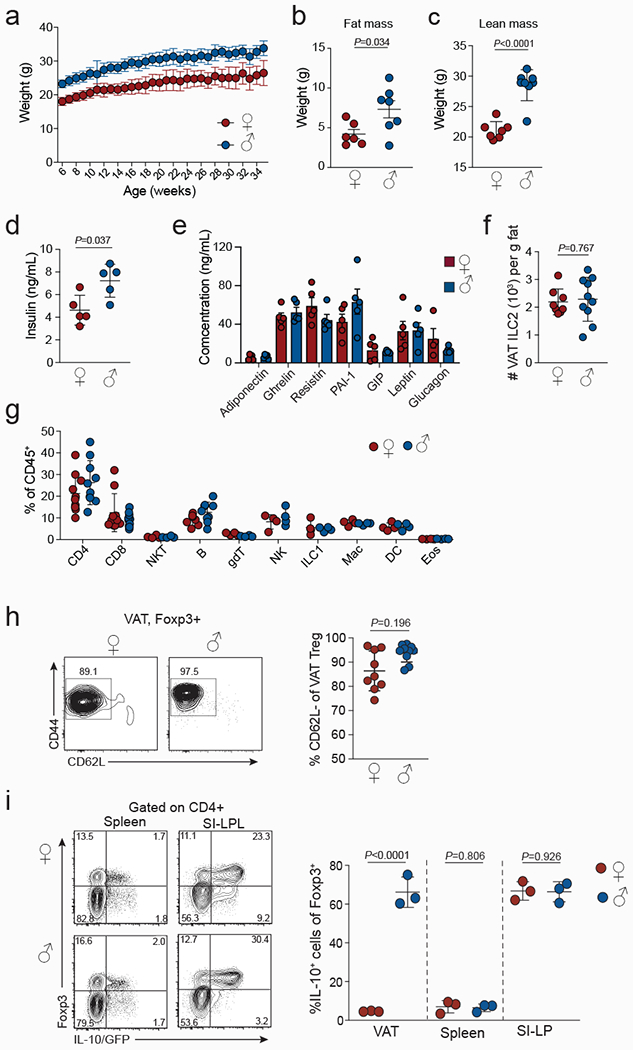
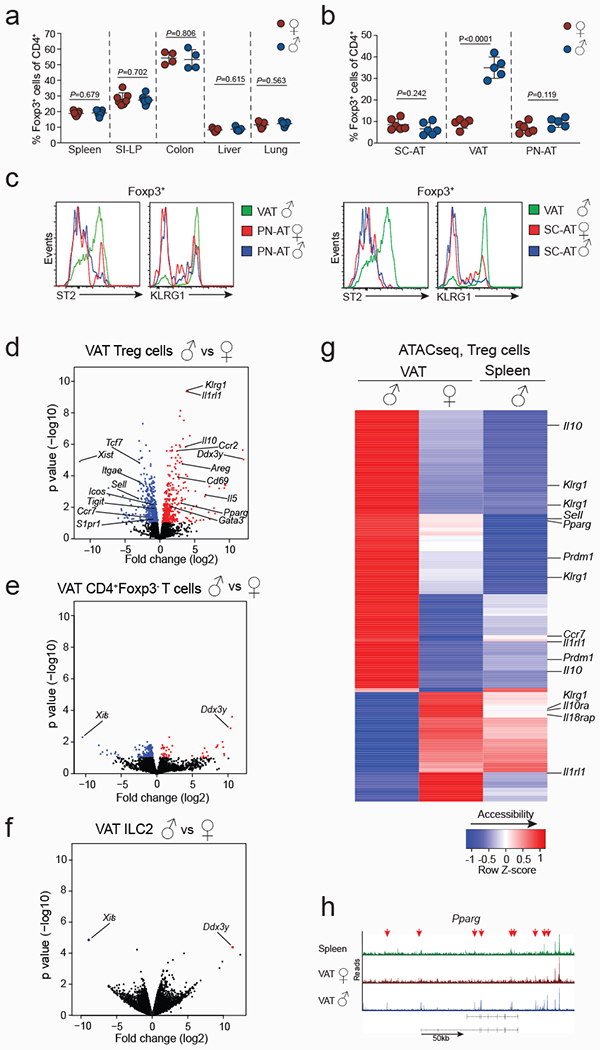
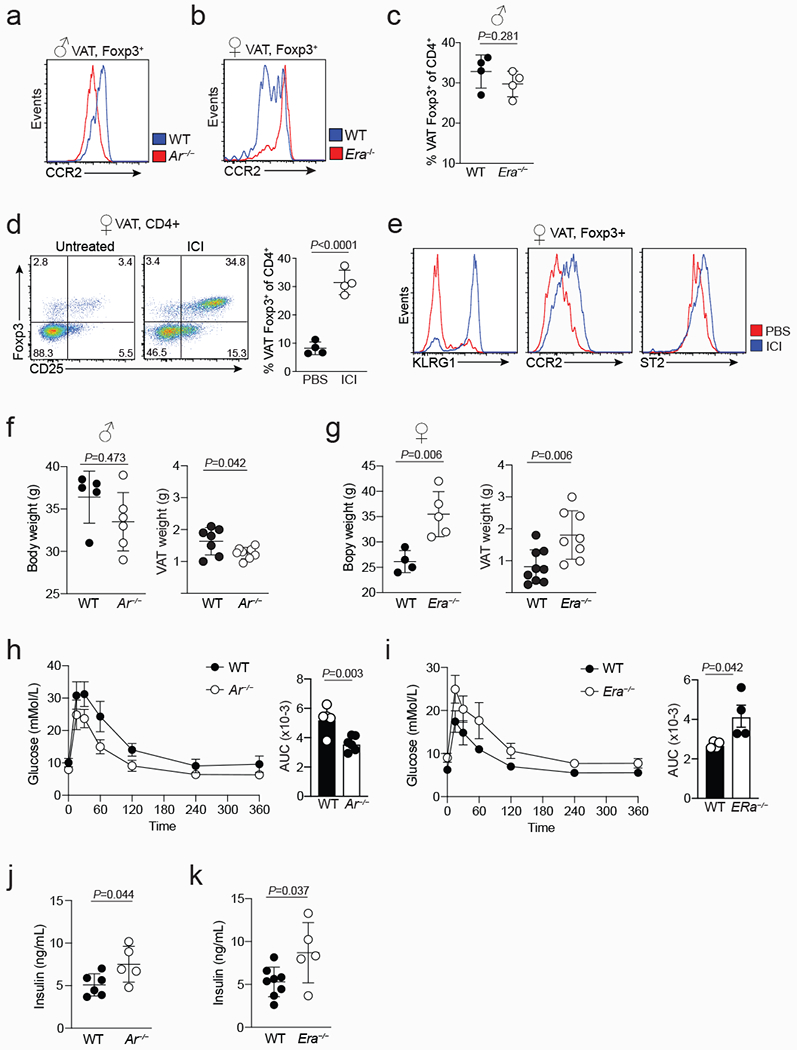
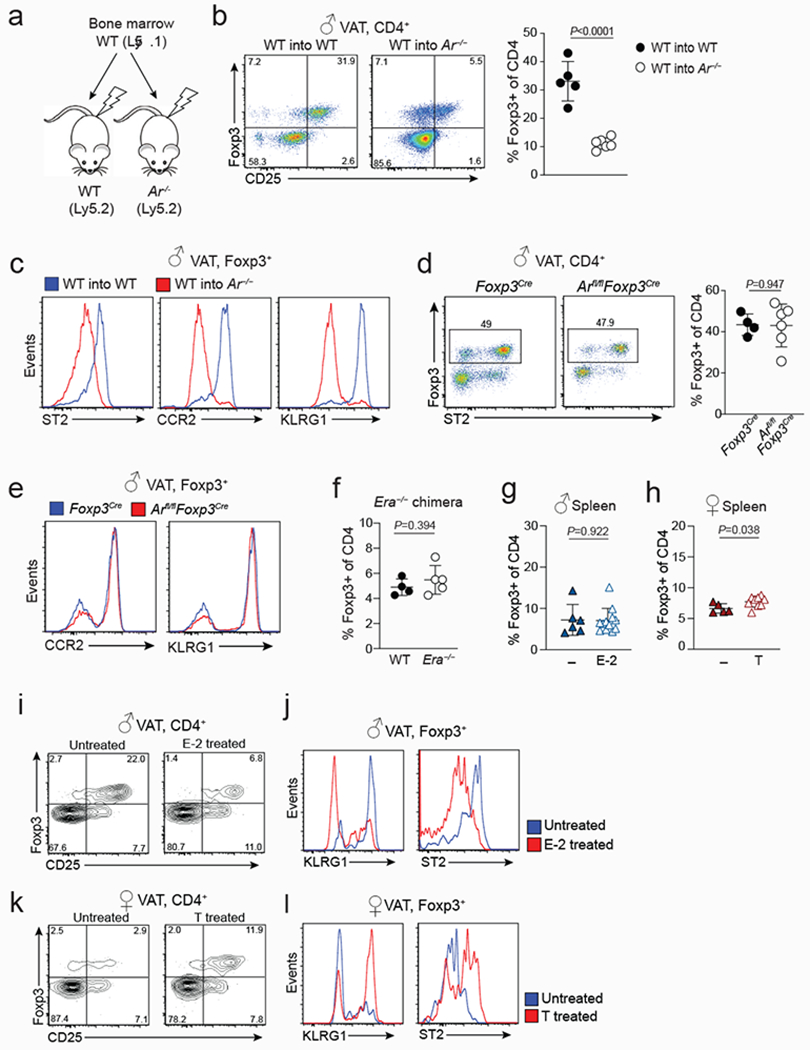
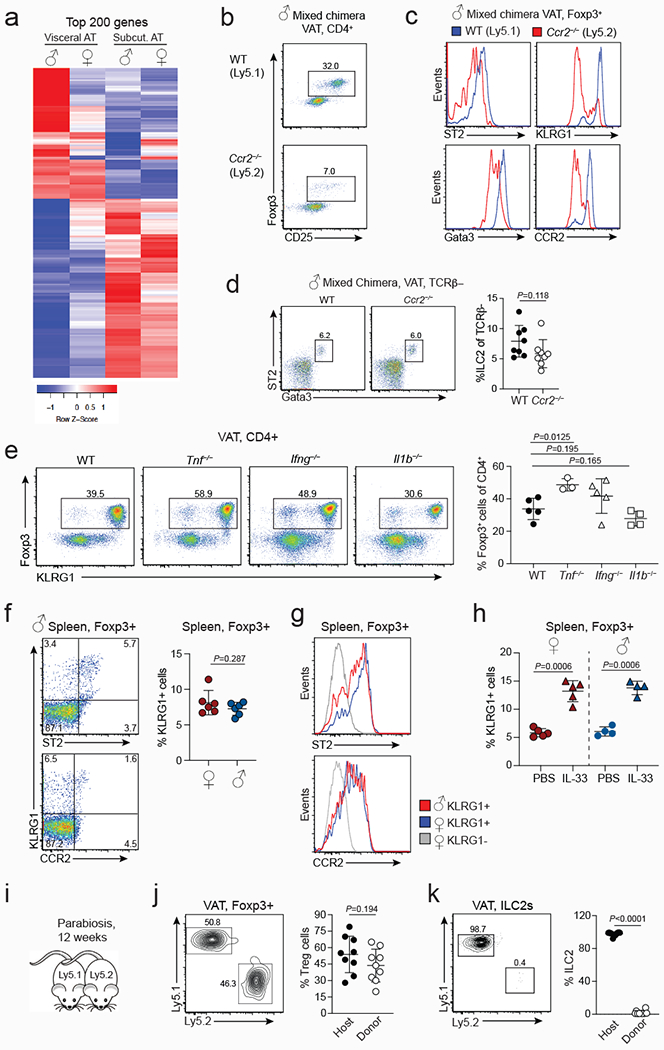
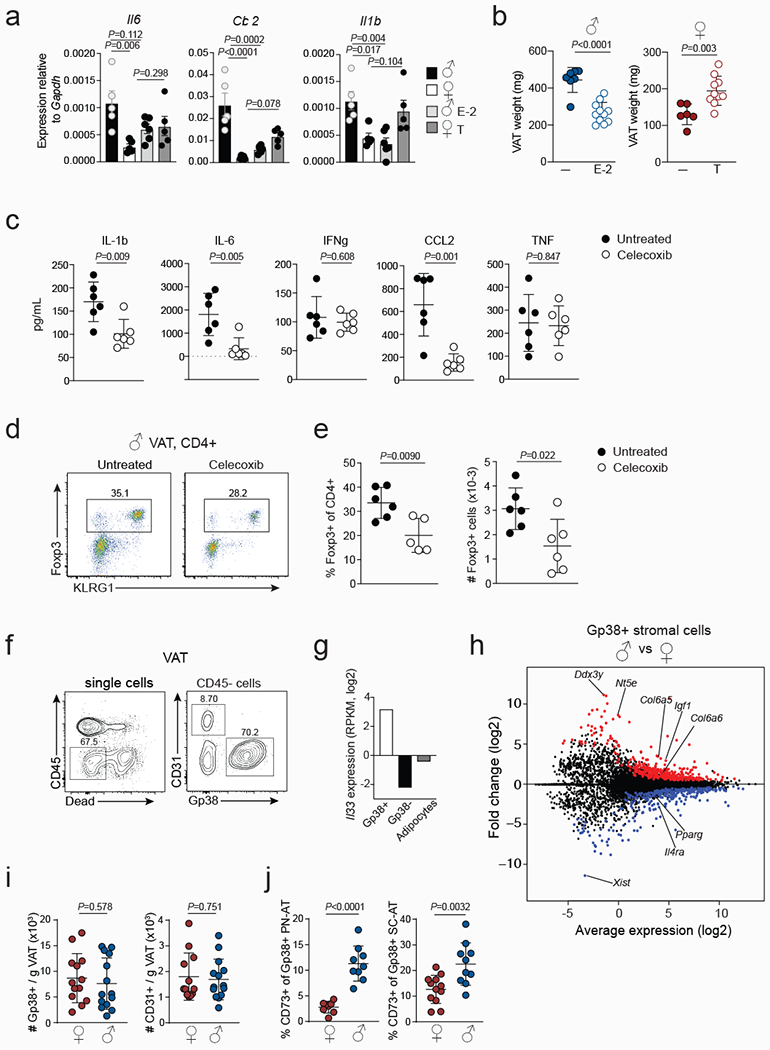
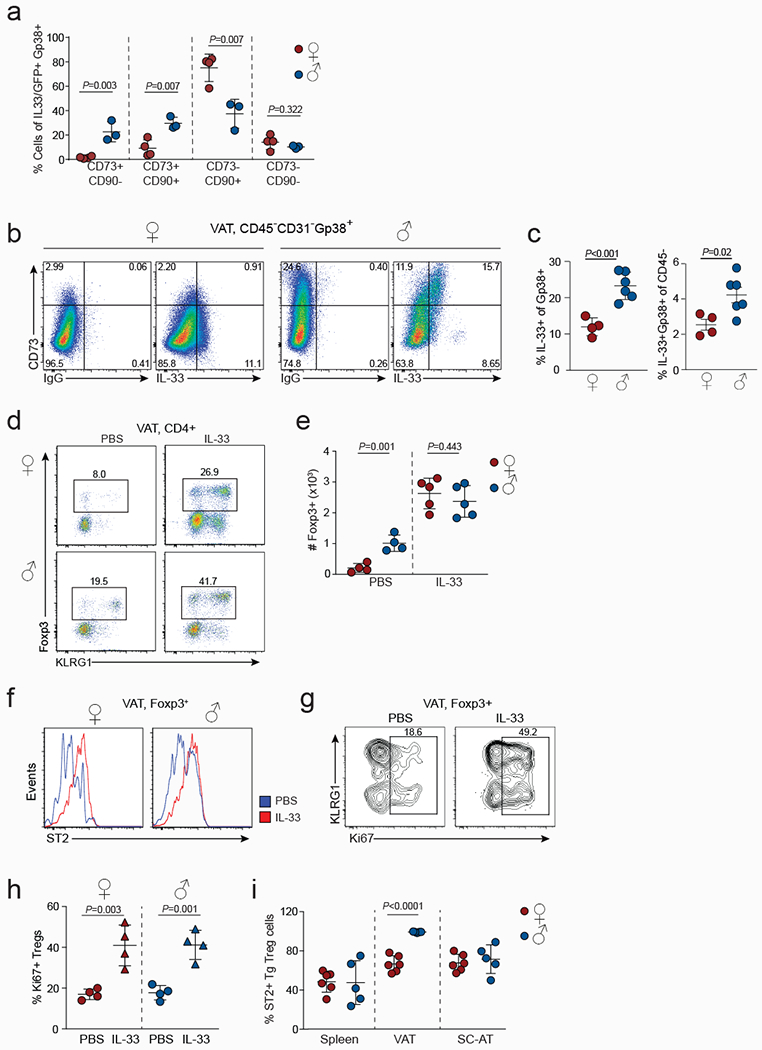
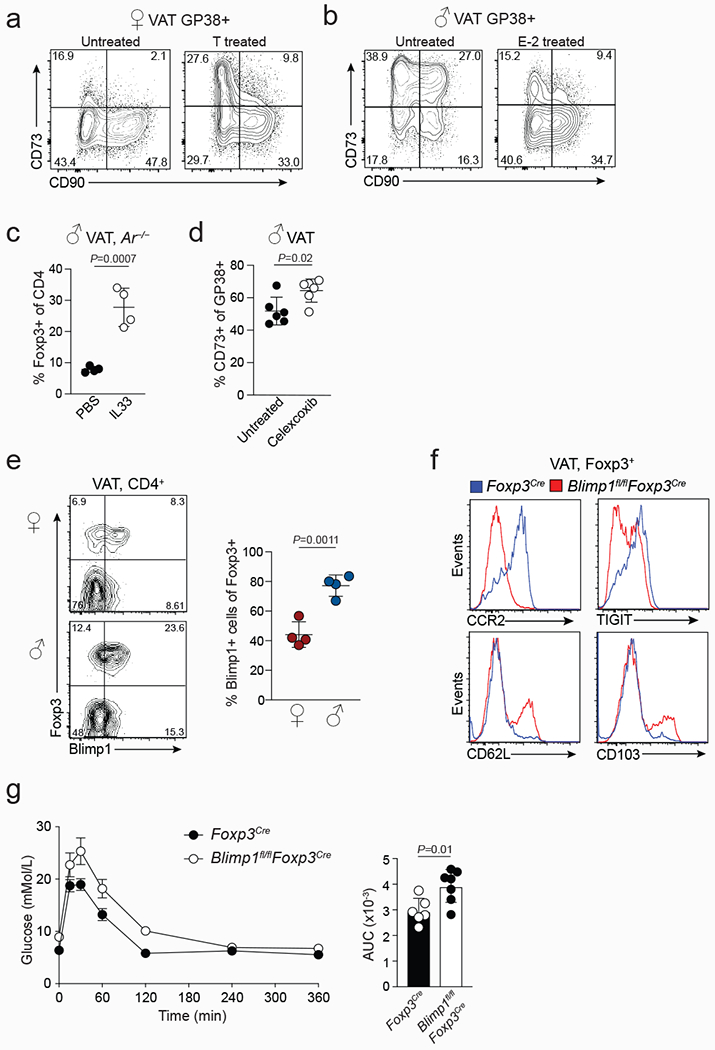
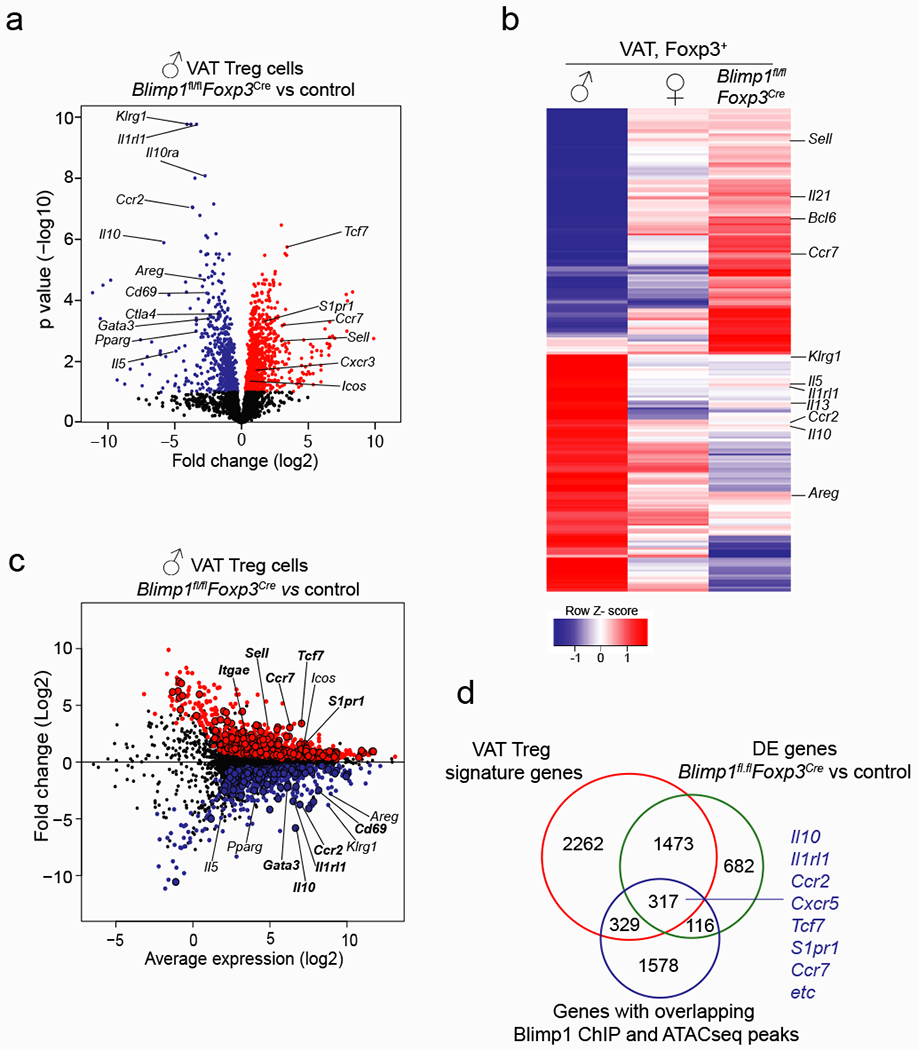
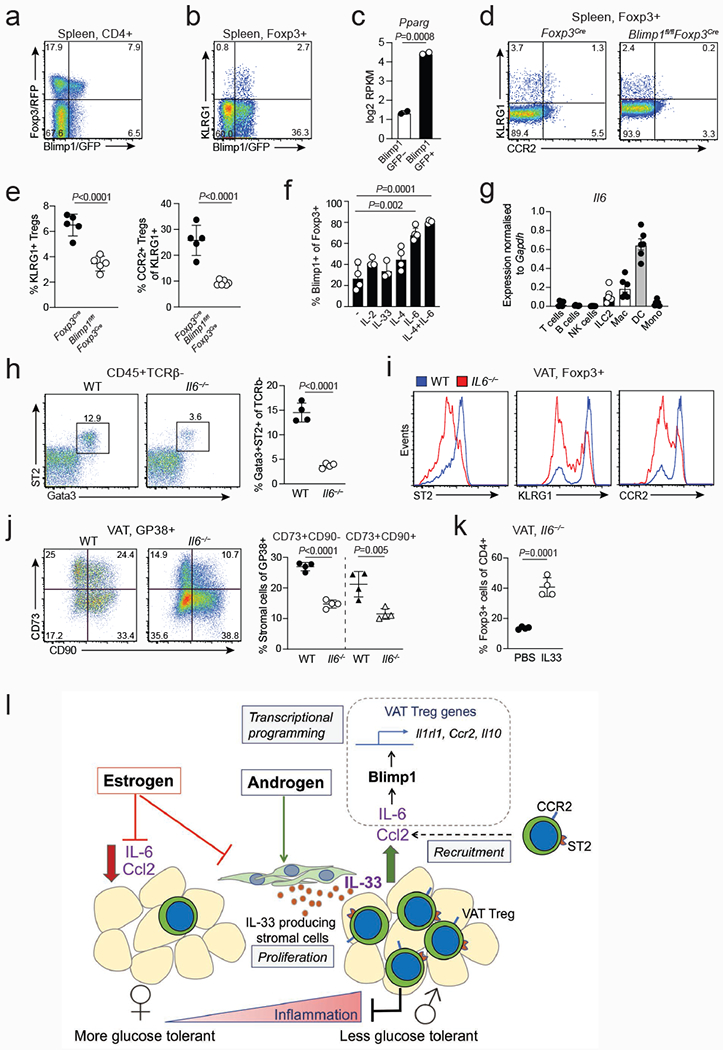
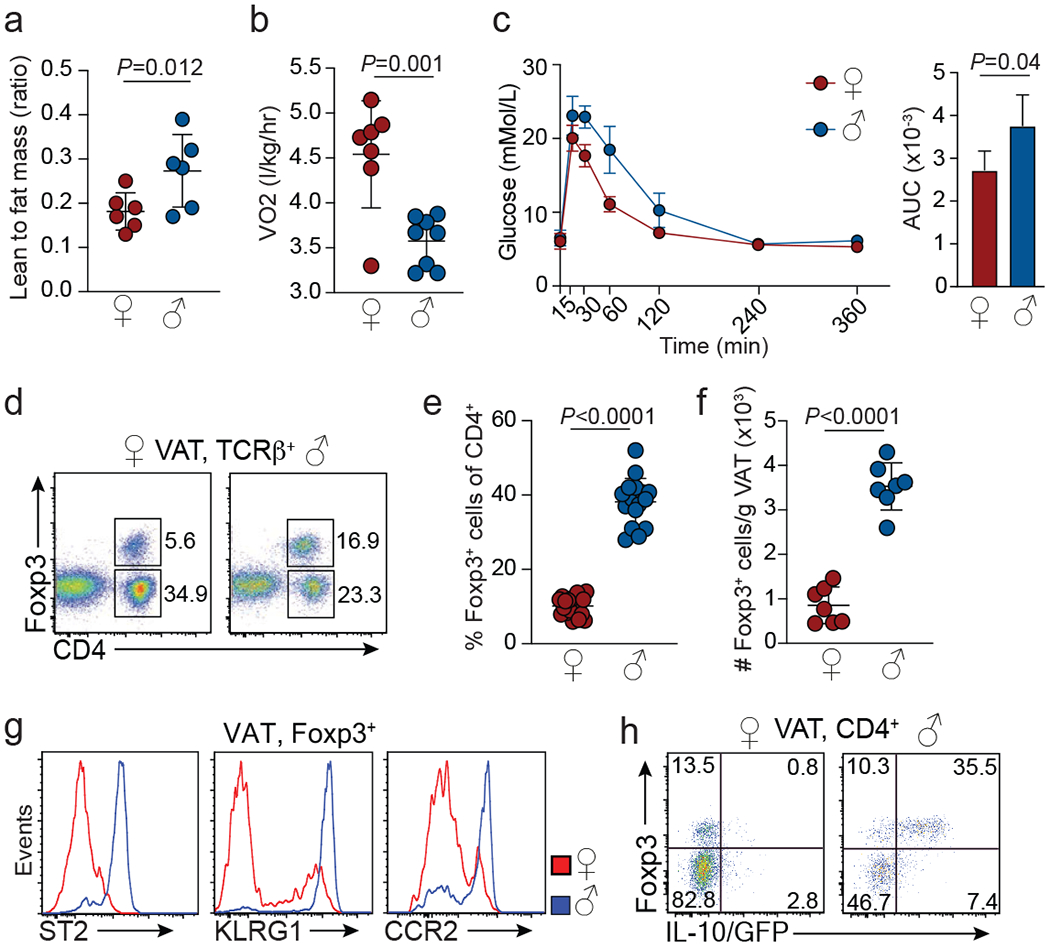
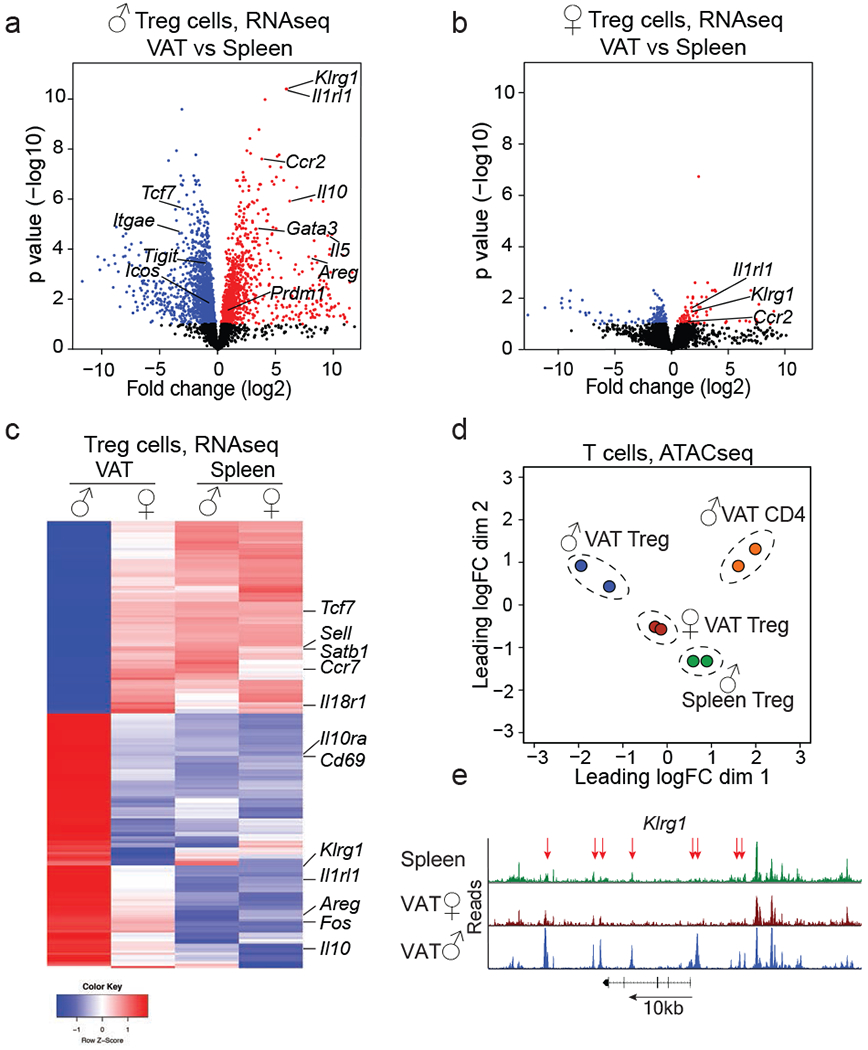
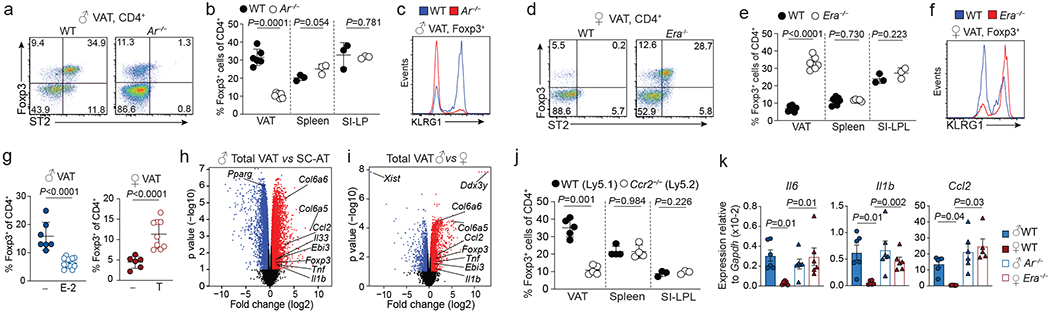
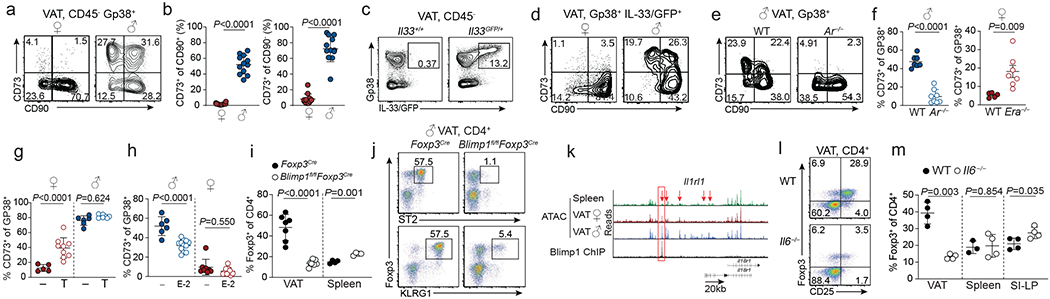
Adipose tissue is an energy store and a dynamic endocrine organ1,2. In particular, visceral adipose tissue (VAT) is critical for the regulation of systemic metabolism3,4. Impaired VAT function-for example, in obesity-is associated with insulin resistance and type 2 diabetes5,6. Regulatory T (Treg) cells that express the transcription factor FOXP3 are critical for limiting immune responses and suppressing tissue inflammation, including in the VAT7-9. Here we uncover pronounced sexual dimorphism in Treg cells in the VAT. Male VAT was enriched for Treg cells compared with female VAT, and Treg cells from male VAT were markedly different from their female counterparts in phenotype, transcriptional landscape and chromatin accessibility. Heightened inflammation in the male VAT facilitated the recruitment of Treg cells via the CCL2-CCR2 axis. Androgen regulated the differentiation of a unique IL-33-producing stromal cell population specific to the male VAT, which paralleled the local expansion of Treg cells. Sex hormones also regulated VAT inflammation, which shaped the transcriptional landscape of VAT-resident Treg cells in a BLIMP1 transcription factor-dependent manner. Overall, we find that sex-specific differences in Treg cells from VAT are determined by the tissue niche in a sex-hormone-dependent manner to limit adipose tissue inflammation.


Conflict of interest statement

Author Information statement. The authors declare no competing interests.

Figures

Extended data Figure 1.
Extended data Figure 1.. Multiple physiological and cellular parameters differ between male and female mice.
a, Weight gain of normal chow diet fed wildtype (WT) male and female mice with age (n=6, females and males). b-e, Multiple physiological parameters measured in age matched WT male and female mice, including fat mass (n=7, females and males) (b), lean mass (n=7, females and males) (c), serum insulin levels (n=5, females and males) (d), and serum adipokine levels 6 h post fasting (n=5, females and males) (e). f, Numbers of ILC2 in male and female VAT from 12-15-week-old mice. (n=8) females, (n=10) males. g, Proportions of different VAT resident immune cells determined from male and female mice (n=4-9). h, Expression of CD44 and CD62L in VAT Treg cells from male and female WT mice. Graph on the right shows quantification (n=9, females and males). i, Flow cytometry plots (left) showing Foxp3RFP and Il10GFP expression in spleens and small intestine lamina propria (SI-LP) and quantification (right) of IL-10/GFP+ Treg cells in VAT, spleen and SI-LP resident CD4+ T cells of female and male Foxp3RFPIl10GFP double reporter mice (n=3, females and males). Unpaired t-test was performed (2-tailed). Data are mean ± s.d. Data pooled or representative of 2 independent experiments.
Extended data Figure 2.
Extended data Figure 2.. VAT specific sexual-dimorphism in Treg cells is underpinned by unique transcriptional signatures and chromatin accessibility.
a, Percentages of Foxp3+ cells in spleens (n=6, females and males), small intestine lamina propria (SI-LP) (n=7, females and males), colons (n=4, females and males), livers and lungs (n=5 females and males) from 25 to 30-week-old wildtype (WT) mice. b, Percentages of Foxp3+ cells in subcutaneous adipose tissue (SC-AT) (n=6 females and males), VAT (n=5, females and males) and perinephric adipose tissue (PN-AT) (n=6 females and males) from 25 to 30-week-old WT mice. c, Expression of ST2 and KLRG1 in Treg cells from the PN-AT (left) and SC-AT (right) of WT male and female mice. Treg cells from male VAT are shown in green as positive control. d-f, Volcano plots show genes differentially expressed between male and female VAT Treg cells (d), VAT CD4+Foxp3 T cells (e), and VAT-ILC2s (f). Each dot represents a gene. Differentially expressed genes are marked in blue (downregulated) or red (upregulated). g, Heatmap shows chromatin accessibility of VAT Treg signature genes assessed by ATACseq. Data displayed from male VAT Treg cells, female VAT Treg cells, male splenic Treg cells. h, ATACseq tracks show chromatin accessibility at the Pparg locus of male splenic Treg cells (green) and Treg cells from female (red) and male (blue) VAT. Arrows indicate regions of differential chromatin accessibility. Data in (a, b) pooled or representative of two independent experiments, and unpaired t-test (2-tailed) performed. Data are mean ± s.d, Sequencing experiments performed in duplicates. For each RNAseq sample, VAT Tregs were sorted from male (n=5) and female (n=12) Foxp3RFP mice. For ATACseq, each sample contained Treg cells from n=4 males and n=10 females. Experiments were performed with 25 to 32-week-old mice. Statistical methods and software packages for sequencing data described in methods.
Extended data Figure 3.
Extended data Figure 3.. Opposing functions of male and female sex-hormones in regulating VAT inflammation, Treg cell recruitment and glucose tolerance.
a, Representative flow cytometry histograms showing expression of CCR2 in wildtype (WT) and Ar−/− VAT Treg cells (a), and WT and Era−/− VAT Treg cells (b). c, Frequency of VAT Treg cells in male WT and Era−/− mice (n=4 of each genotype). d, Flow cytometry plots (left) show VAT Treg cells from control and ICI treated female mice, and graph (right) shows quantification (n=4 for both conditions). e, Expression of indicated markers in control and ICI treated female VAT Treg cells. f, Body mass (left) (n=5 WT; n=6 Ar−/−) and VAT mass (right) (n=7 WT; n=8 Ar−/−) from 20 to 25-week-old male WT and Ar−/− mice. g, Body mass (left) (n=4 WT; n=5 Era−/−) and VAT mass (right) (n=9 WT; n=8 Era−/−) from 20 to 25-week-old female WT and Era−/− mice. h, i, Oral glucose tolerance test (left) and area under the curve (right) comparing age-matched male WT and Ar−/− mice (n=4 WT; n=5 Ar−/−) (h), or female WT and Era−/− mice (n=4, WT and Era−/−) (i). j, k, Fasting serum insulin levels in WT (n=6) and Ar−/− (n=5) male mice (j), and in WT (n=8) and Era−/− (n=5) female mice (k). Unpaired ttest (2-tailed) performed. Data are mean ± s.d. Data pooled or representative of two independent experiments.
Extended data Figure 4.
Extended data Figure 4.. VAT Treg cell extrinsic function of sex-hormones.
a, Schematic shows the strategy used to make bone marrow chimeric mice using wildtype (WT) and Ar−/− recipients. b, Proportions of Treg cells from the VAT of irradiated WT (n=5) and Ar−/− (n=6) mice that received WT bone marrow. Quantification on the right. c, Expression of indicated cell surface markers on VAT Treg cells from WT and Ar−/− mice that were reconstituted with WT bone marrow (from b). d, Flow cytometry plots (left) show expression of Foxp3 and ST2 in VAT CD4+ T cells from male Arfl/flFoxp3Cre (n=6) and Foxp3Cre (n=4) control mice. Quantification on the right. e, Expression of CCR2 and KLRG1 in VAT Treg cells from Arfl/flFoxp3Cre and control mice (from d). f, Percentages of WT and Era−/− Treg cells in the VAT of female bone marrow chimeric mice. Irradiated WT female Ly5.1 recipient mice were reconstituted with either female Ly5.2 WT (n=4) or female Era−/− (n=5) bone marrow cells. g, h, Percentages of splenic Treg cells in estrogen treated (n=12) and untreated (n=6) male WT mice (g) and in testosterone treated (n=9) and untreated (n=5) female WT mice (h). i, Expression of Foxp3 and CD25 in VAT CD4+ T cells isolated from estrogen treated or untreated male WT mice. j, Flow cytometry histograms show expression of KLRG1 and ST2 in VAT Treg cells from estrogen (E-2) treated or untreated male WT mice. k, Expression of Foxp3 and CD25 in VAT CD4+ T cells isolated from testosterone treated or untreated female WT mice. l, Expression of KLRG1 and ST2 in VAT Treg cells from testosterone treated or untreated female WT mice. Unpaired t-test (2-tailed) performed. Data are mean ± s.d. Data pooled or representative of two independent experiments.
Extended data Figure 5.
Extended data Figure 5.. Sex-specific VAT inflammation, Treg cell recruitment and maintenance in VAT.
a, Heatmap shows top 200 differentially expressed genes between male and female VAT and subcutaneous adipose tissue (SC-AT). Duplicate samples used for RNA sequencing. For each sample, VAT or SC-AT from three mice were pooled for RNA extraction. b, Proportions of Treg cells in wildtype (WT) and Ccr2−/− compartments of mixed bone marrow chimeric mice. c, Expression of specified markers in WT and Ccr2−/− VAT Treg cells from male mixed bone marrow chimeric mice. d, Flow cytometry plots (left) and quantification (right) of WT and CCR2-deficient ILC2s in the VAT of male chimeric mice containing congenically marked WT (n=8) and Ccr2−/− (n=8) hematopoietic cells. e, Expression of Foxp3 and KLRG1 in WT (n=5), Tnf−/− (n=3), Ifng−/− (n=5) and Il1b−/− (n=4) mice. Graph on the right shows quantification. f, Expression of KLRG1 and ST2 (top) and KLRG1 and CCR2 (bottom) in splenic Treg cells from WT male mice. Graph (right) shows percentages of KLRG1+ cells of Treg cells in the spleen of WT male (n=6) and female (n=6) mice. g, ST2 and CCR2 expression in male and female KLRG1+ splenic Treg cells. h, Graph shows percentages of KLRG1+ cells of Treg cells in the spleens of female (n=5) and male (n=4) mice treated with PBS or IL-33. i, Schematic of parabiosis experiment. j, k, Flow cytometry plots (left) and quantification (right) show proportions of Treg cells (n=9) (j) and ILC2 (n=9) (k) in the VAT of parabiotic WT female mice that were paired for 12 weeks. Unpaired t-test (2-tailed) performed. Data are mean ± s.d. Data pooled or representative of two independent experiments.
Extended data Figure 6.
Extended data Figure 6.. Sex-hormonal control of VAT inflammation and stromal cell differentiation.
a, Expression of indicated genes in the VAT of Testosterone (T) or estrogen (E-2) treated male and female wildtype (WT) mice measured by quantitative PCR. Untreated females and males, T treated females (n=5); E-2 treated males (n=6). b, VAT weight from untreated (n=7) and E-2 (n=11) treated WT male (left) and untreated (n=6) and T treated (n=10) WT female (right) mice. c, Concentrations of indicated proinflammatory cytokines in the mesenteric lymph nodes of Celecoxib (n=6) or untreated (n=6) WT male mice measured by cytokine bead array. d, Expression of Foxp3 and KLRG1 in CD4+ T cells isolated from the VAT of Celecoxib treated and untreated male WT mice. e, Percentages (left) and numbers (right) of Foxp3+ Treg cells in the VAT of Celecoxib treated (n=6) and untreated (n=6) WT male mice. f, Gating strategy used to identify VAT CD31+ endothelial cells and Gp38+ stromal cells in the CD45-non-hematopoietic cell compartment of WT male and female mice. g, Il33 transcript levels in Gp38+ stromal and Gp38-CD31+ endothelial cells and in adipocyte from 25-week-old male mice (data from RNAseq analysis, two samples per cell type). h, MA plot showing genes differentially expressed between male and female GP38+ VAT stromal cells. RNA sequencing performed in duplicate samples. For each sample, the respective VAT stromal cell population was sorted from WT male (n=5) and female (WT=7) mice. i, Numbers of Gp38+ cells in female (n=13) and male (n=14) VAT (left) and CD31+ cells (right) in female (n=11) and male (n=14) VAT from 25-week-old mice. d, Proportions of CD73+ cells within the female (n=8) and male (n=9) Gp38+ stromal compartment of peri-nephric adipose tissue (PN-AT, left) and subcutaneous adipose tissue (SC-AT) (right) (n=12 females; n=10 males). For (a) One-way ANOVA was performed. Other data were analysed using unpaired t-test (2-tailed). Data are mean ± s.d. except (a) ± s.e.m. Data pooled or representative of two independent experiments.
Extended data Figure 7.
Extended data Figure 7.. Sex-specific distribution of IL-33+ VAT stromal cells and VAT Treg cell response to IL-33 administration.
a, Percentages of IL-33+ cells within each VAT Gp38+ stromal cell compartment of female (n=4) and male (n=3) wildtype (WT) mice. b, IL-33 expression in CD45-CD31-Gp38+ stromal cells as measured by intracellular staining. IgG was used as a control. c, Percentages of IL-33+ cells within the VAT Gp38+ stromal cell compartment of WT female (n=4) and male (n=6) mice (left) and percentages of IL-33+Gp38+ of live cells in VAT (right). d-h, IL-33 (n=5) or PBS (mock) (n=4) was administered to 12-week-old male and female WT mice. Expression of Foxp3 and KLRG1 in VAT CD4+ T cells (d), numbers of VAT Treg cells (e), ST2 expression in VAT Treg cells from IL-33 or PBS treated (f), expression of KLRG1 and Ki67 in VAT Treg cells of male mice (g), and quantification of Ki67+ VAT Treg cells in female (n=4) and male (n=4) WT mice (h). i, Treg cells were sorted from the spleens of transgenic mice expressing a VAT-specific T cell receptor25 and transferred into congenically marked female (n=6) or male (n=5) mice. Percentages of ST2+ TCR transgenic (Tg) Treg cells within the adipose tissue 12 weeks after adoptive transfer. Unpaired t-test (2-tailed) was performed. Data are mean ± s.d. Data pooled or representative of two independent experiments.
Extended data Figure 8.
Extended data Figure 8.. Sex-hormonal regulation of CD73+ VAT stromal cell differentiation and Blimp1 regulation of VAT Treg cells and organismal metabolism.
a, Flow cytometry plots from testosterone (T) treated and untreated female wildtype (WT) mice showing expression of CD73 and CD90 in Gp38+ VAT stromal cells. b, Flow cytometry plots from estrogen (E-2) treated and untreated male WT mice showing expression of CD73 and CD90 in Gp38+ VAT stromal cells. c, Percentages of VAT Treg cells in male Ar−/− mice treated with PBS (n=4) or IL-33 (n=4). d, Percentages of CD73+ stromal cells in Celecoxib treated (n=6) or untreated (n=5) male mice. e, Expression of Foxp3/RFP and Blimp1/GFP in male (n=4) and female (n=4) VAT Treg cells from Foxp3RFPBlimp1GFP double reporter mice. Percentages of Blimp1/GFP+ cells of Foxp3+ Treg cells. f, Expression of indicated molecules in Foxp3Cre and Blimp1fl/flFoxp3Cre VAT Treg cells. g, Oral glucose tolerance test in normal diet fed 25-week-old male Blimp1fl/flFoxp3Cre (n=7) and Foxp3Cre (n=6) mice. Graph on the right shows area under the curve (AUC).Unpaired t-test (2-tailed) was performed. Data are mean ± s.d. Data pooled or representative of two independent experiments.
Extended data Figure 9.
Extended data Figure 9.. Blimp1 establishes the VAT Treg cell transcriptional and chromatin landscapes.
a, Volcano plot shows genes differentially expressed between male Blimp1fl/flFoxp3Cre and control VAT Treg cells. For each genotype duplicate samples were used for RNA sequencing. Each sample contains VAT Treg cells from n=7 Blimp1fl/flFoxp3Cre and n=5 Foxp3Cre mice. b, Heatmap shows top 200 genes differentially expressed between WT male and female VAT Treg cells and Blimp1fl/flFoxp3Cre male VAT Treg cells. c, MD plot shows expression of genes in Blimp1fl/flFoxp3Cre and Foxp3Cre VAT Treg cells. Each dot represents a gene; genes highlighted in red are up and blue are down-regulated in Blimp1fl/flFoxp3Cre VAT Treg cells. Larger dots with black outline indicate genes that are also bound by Blimp1 in regions of open chromatin in VAT Treg cells. d, Venn diagram shows overlap between genes differentially expressed between male VAT Treg cells and male splenic Treg cells (VAT Treg cell signature), male Blimp1fl/flFoxp3Cre and control VAT Treg cells and genes that show Blimp1 ChIP binding in regions of open chromatin (peaks) of male VAT Treg cells. Statistical methods and software packages described in methods.
Extended data Figure 10.
Extended data Figure 10.. Blimp1 regulates putative VAT Treg cell precursors, diverse functions of IL-6 in the VAT, and a model of the sex-hormone mediated circuitry that mediates recruitment, expansion and function of VAT Treg cells.
a, Expression of Foxp3 and Blimp1 in splenic CD4+ T cells from Foxp3RFPBlimp1GFP mice. b, Expression of Blimp1/GFP and KLRG1 in splenic Treg cells. c, Pparg expression in Blimp1/GFP+ vs Blimp1/GFP splenic Treg cells. Bar graph generated from RNAseq read counts. d, Expression of KLRG1 and CCR2 in splenic Treg cells from Foxp3Cre and Blimp1fl/flFoxp3Cre mice. e Graphs on the right show percentages of KLRG1+ cells among splenic Treg cells of Foxp3Cre (n=5) and Blimp1fl/flFoxp3Cre (n=6) mice and percentages of CCR2+ cells within the KLRG1+ fraction of splenic Treg cells. f, Proportion of Blimp1/GFP+ Treg cells obtained after Blimp1/GFP-Treg cells sorted from Foxp3RFPBlimp1GFP mice were cultured in the presence of indicated cytokines (n=3-4). g, Expression of Il6 transcripts as measured by quantitative PCR in hematopoietic cell populations sorted from the male VAT (n=6). h, Flow cytometry plots (left) and quantification (right) of ILC2s in the VAT of male WT (n=4) and Il6−/− (n=4) mice. i, Flow cytometry histograms show expression of indicated markers in WT and Il6−/− VAT Treg cells. j, Expression of CD73 and CD90 in WT (n=4) and Il6−/− (n=4) VAT Gp38+ cells (left). Percentages of CD73+CD90 and CD73+CD90+ stromal cells in the VAT of male WT (n=4) and Il6−/− (n=4) mice (right). k, Percentages of VAT Treg cells in male Il6−/− mice treated with PBS or IL-33. Unpaired t-test (2-tailed) was performed. Data are mean ± s.d. Data pooled or representative of two independent experiments. l, Model of the sex-hormone mediated circuitry that mediates recruitment, expansion and function of VAT Treg cells. Treg cells are recruited to the VAT in a CCL2/CCR2-dependent manner. IL-6 induces the expression of transcription factor Blimp1, which in turn activates expression of prototypical VAT-Treg signature genes IL-33 receptor ST2, CCR2 and IL-10. IL-33 production by androgenresponsive stromal cells leads to local expansion of VAT Treg cells in the male VAT, whichin turn mediate repression of VAT inflammation.
Figure 1.
Figure 1.. Treg cells show VAT specific sexual dimorphism.
a, Ratio of lean mass to fat mass. Female (n=6), male (n=6). b, Oxygen consumption. Female (n=6), male (n=8). c, Glucose tolerance in 25-week-old female and male mice under normal chow diet conditions. Female (n=4), male (n=4). Graph on the right shows area under the curve (AUC) for the glucose tolerance test. d, Proportions of Foxp3+ cells among visceral adipose tissue (VAT) TCRβ+ T cells in female and male C57BL/6 mice. Representative of female (n=19), male (n=16). e, Foxp3+ Treg cells as proportion of CD4+ cells. Female (n=19), male (n=16). f, Treg cell numbers in the VAT of female and male mice. Female (n=7), male (n=7). g, Expression of indicated cell surface markers on male and female VAT Treg cells. Representative of female (n=19), male (n=16). h, IL-10/GFP expression in VAT Treg cells from male and female Foxp3RFPIl10GFP mice. Representative of n=6 mice of each sex. For a-c, e and f, unpaired t-test (2-tailed) was performed. Data are mean ± s.d. Data pooled or representative of 2-3 independent experiments.
Figure 2.
Figure 2.. Treg cells from male and female VAT are distinct in their transcriptional profile and chromatin accessibility.
Treg cells were sorted from visceral adipose tissue (VAT) and spleens of 25 to 32-week-old Foxp3RFP mice to perform RNA sequencing and Assay for Transposase-Accessible Chromatin using sequencing (ATACseq). n=2 samples, each sample contains Treg cells from n=5 male and n=12 female mice. a, Volcano plot shows genes differentially expressed between Treg cells from male VAT and spleen. Each dot represents a gene; genes in red are up, genes in blue are down-regulated in male VAT Treg cells. b, Volcano plot shows genes differentially expressed between Treg cells from female VAT and spleen. Genes in red and blue are up or down-regulated, respectively, in female VAT Treg cells. c, Heatmap shows top 200 genes differentially expressed between male and female VAT and comparison to splenic Treg cells. d, Multi-dimensional scaling analysis of ATACseq data. Distances shown on the plot represent the leading log2-fold-change between samples. (e) ATACseq tracks show chromatin accessibility at the Klrg1 locus of male splenic Treg cells (green) and Treg cells from female (red) and male (blue) VAT. Arrows indicate regions of differential chromatin accessibility. Statistical methods and software packages described in methods.
Figure 3.
Figure 3.. Sex differences in VAT Treg cells are linked to sex hormones.
a, Foxp3 and ST2 expression in VAT CD4+ T cells from male wildtype (WT) and androgen receptor-deficient (Ar−/−) mice. WT (n=6), Ar−/− (n=7). b, Foxp3+ cells within CD4+ T cells in VAT (n=6 WT, n=7 Ar−/−), spleen, and small intestine lamina propria (SI-LP) of WT and Ar−/− mice. WT and Ar−/− (n=3). c, KLRG1 expression in WT and Ar−/− VAT Treg cells. WT (n=6), Ar−/− (n=7). d, Foxp3 and ST2 expression in VAT CD4+ T cells from female WT and estrogen receptor alpha-deficient (Era−/−) mice. WT (n=6), Era−/− (n=7). e, Foxp3+ Treg cells within CD4+ T cells of VAT (n=6 WT, n=7 Era−/−), spleen (n=7 WT, n=5 Era−/−) and SI-LP (n=3, WT and Era−/−) of WT and Era−/− mice. f, KLRG1 expression in female WT and Era−/− VAT Treg cells. WT (n=6), Era−/− (n=7). g, Percentage VAT Treg cells in mock treated (n=7) and estrogen (E-2) treated male WT mice (n=13) (left). In right, mock treated (n=6) and testosterone (T) treated (n=9) female WT mice. h, i, Volcano plot showing genes differentially expressed between male VAT and subcutaneous adipose tissue (SC-AT) (h), or between total male and female VAT (i). Each dot represents a gene; genes in red are up, genes in blue are down-regulated in the respective comparison. j, Proportion of Treg cells in the VAT (n=5), spleen (n=4) and SI-LP (n=3) of male WT and Ccr2−/− mixed bone marrow chimeric mice. k, Quantitative PCR analysis of gene expression in age-matched male WT and Ar−/− and female WT and Era−/− mice. Unpaired t-test performed for b, e, g, j (2-tailed), one way ANOVA for k. Data are mean ± s.d, except (k) mean ± s.e.m. Data pooled or representative of two independent experiments.
Figure 4.
Figure 4.. Hormone-dependent stromal cells and Blimp1 underpin VAT Treg cell sexual dimorphism.
a, CD90 and CD73 expression in GP38+ VAT stromal cells from wildtype (WT) female and male mice. b, Percentage of CD73+ cells of CD90+ (left) and CD90 (right) cells. n=12 male and female. c, IL-33/GFP and Gp38 expression in CD45- VAT stromal vascular fraction from male wildtype (WT) and Il33GFP mice. Representative of n=6. d, CD73 and CD90 expression in GP38+IL-33/GFP+ VAT stromal cells from male and female Il33GFP mice. Representative of n=8 of both sexes. e CD73 and CD90 expression within Gp38+ stromal cells from male WT and Ar−/− VAT. f-h, Proportions of CD73+ cells within Gp38+ VAT stromal cells of WT (n=7) and Ar−/− (n=8) males (f, left), WT (n=5) and Era−/− (n=7) females (f, right), testosterone (T) treated female (n=9) and male (n=8) WT mice (g), and estrogen (E-2) treated male (n=11) and female (n=7) mice (h). i Proportions of Treg cells in the VAT (n=7 per genotype) and spleens (n=4 per genotype) of Blimp1fl/flFoxp3Cre and Foxp3Cre mice. j, Expression of Foxp3, ST2 and KLRG1 in VAT CD4+ T cells from Blimp1fl/fl Foxp3Cre and Foxp3Cre control mice. k, ATACseq tracks show chromatin accessibility (male spleen - green; female VAT - red; male VAT - blue) and ChIPseq shows Blimp1 occupancy (black) in the Il1rl1 locus. Arrows indicate differentially accessible and boxes Blimp1-occupied sites. l, Flow cytometry plots show expression of Foxp3 and CD25 in VAT CD4+T cells from WT and Il6−/− mice. m, Proportions of splenic, VAT and small intestine lamina propria (SI-LP) Treg cells among VAT CD4+ T cells of WT and Il6−/− mice (n=4 per genotype). Unpaired t-test performed (2-tailed). Data are mean ± s.d. Data pooled or representative of two independent experiments.

References

    1. Meseguer A, Puche C & Cabero A Sex steroid biosynthesis in white adipose tissue. Horm Metab Res 34, 731–736 (2002). - PubMed
    1. Kamat A, Hinshelwood MM, Murry BA & Mendelson CR Mechanisms in tissue-specific regulation of estrogen biosynthesis in humans. Trends Endocrinol Metab 13, 122–128 (2002). - PubMed
    1. Luo L & Liu M Adipose tissue in control of metabolism. J Endocrinol 231, R77–R99 (2016). - PMC - PubMed
    1. Rosen ED & Spiegelman BM Adipocytes as regulators of energy balance and glucose homeostasis. Nature 444, 847–853 (2006). - PMC - PubMed
    1. Mraz M & Haluzik M The role of adipose tissue immune cells in obesity and low-grade inflammation. J Endocrinol 222, R113–127 (2014). - PubMed

MeSH terms