. 2020 Mar;579(7797):123-129.
doi: 10.1038/s41586-020-2047-9. Epub 2020 Feb 26.

Global chemical effects of the microbiome include new bile-acid conjugations

Affiliations

Global chemical effects of the microbiome include new bile-acid conjugations

Robert A Quinn et al. Nature. 2020 Mar.

Abstract

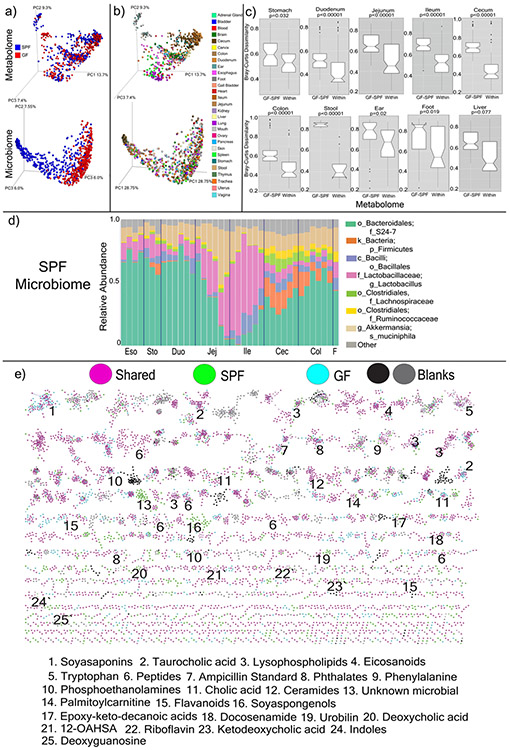
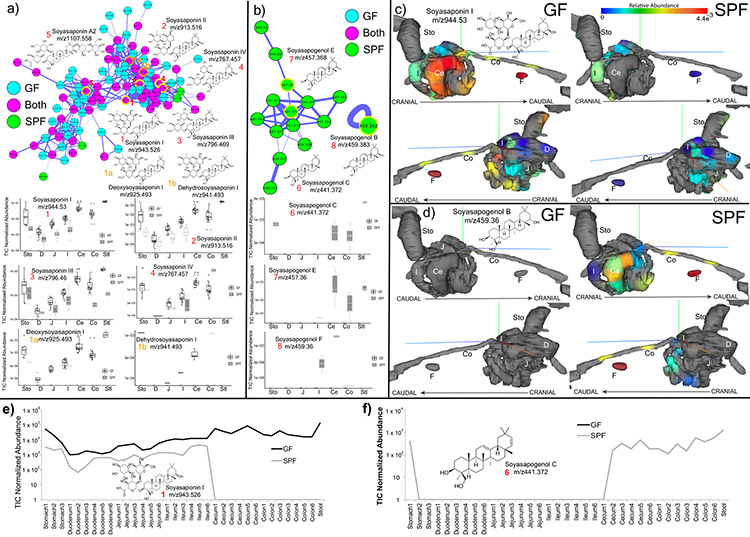
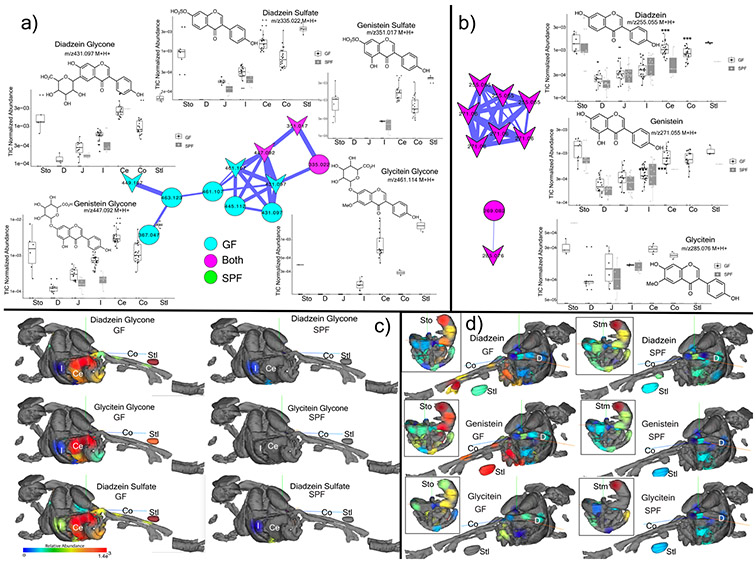
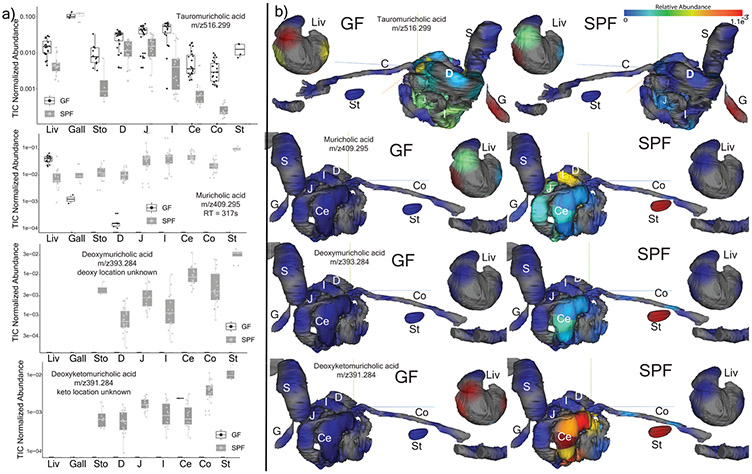
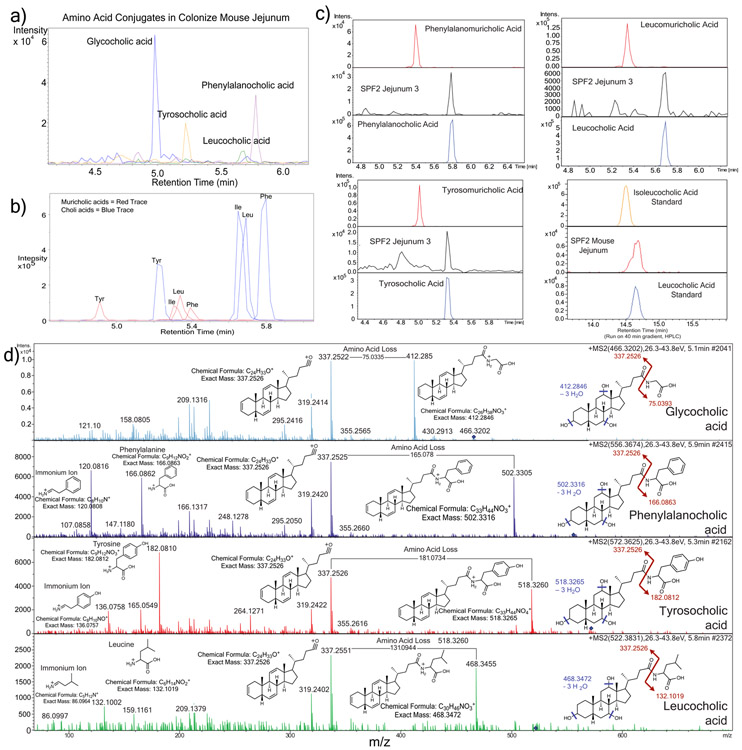
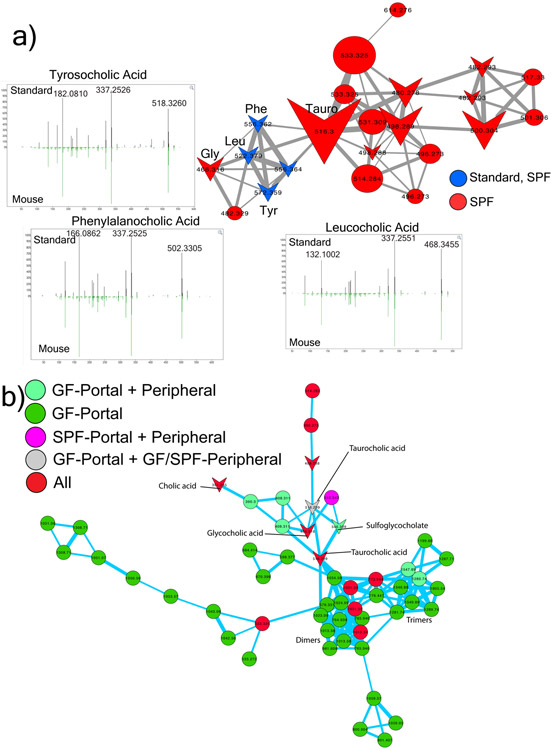
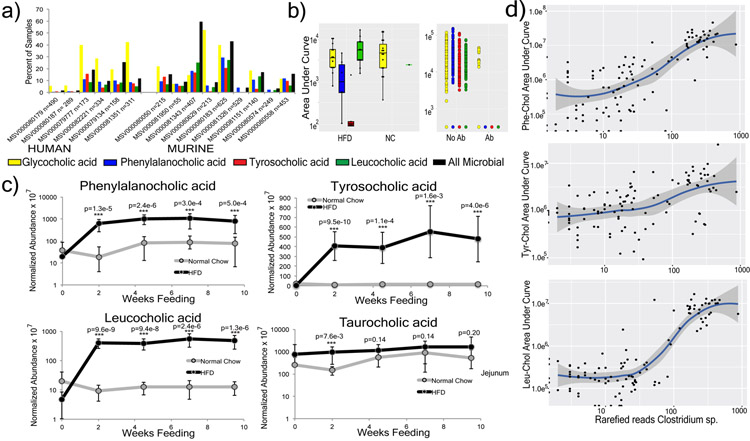
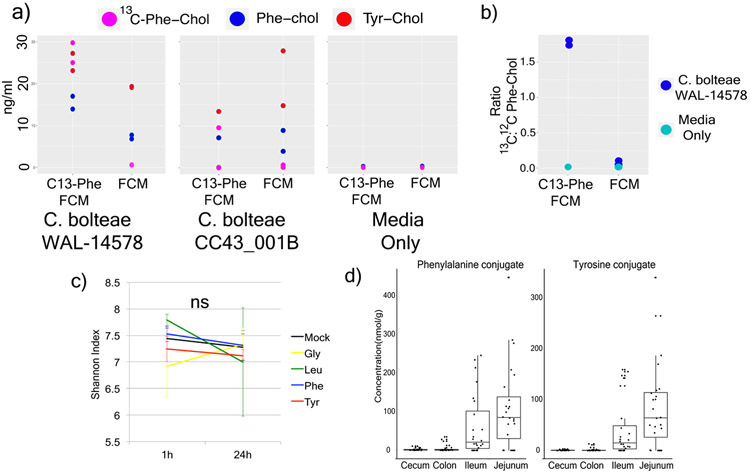
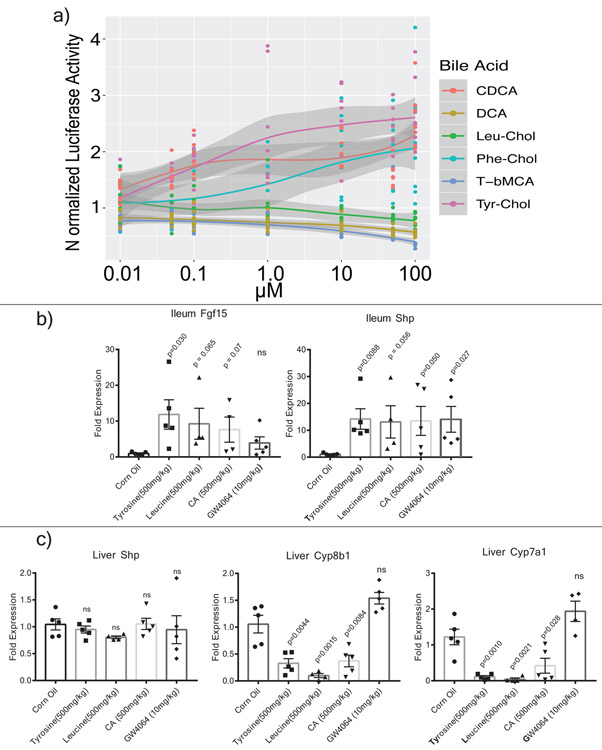
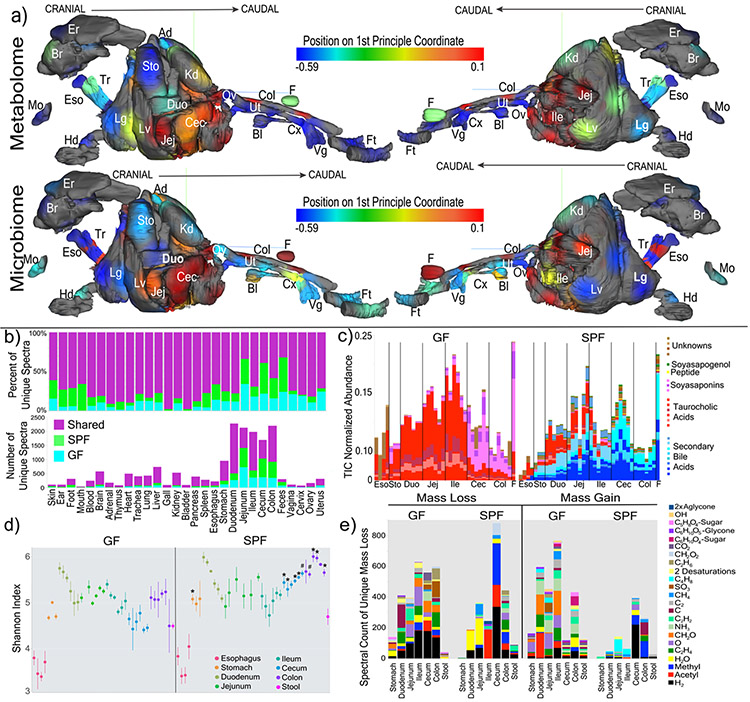
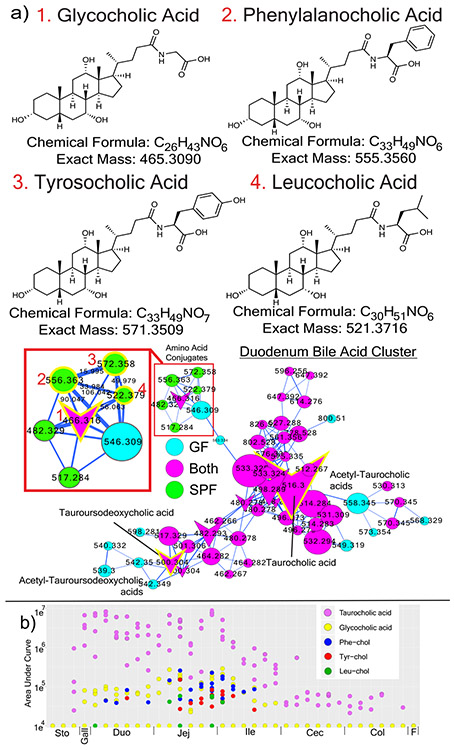
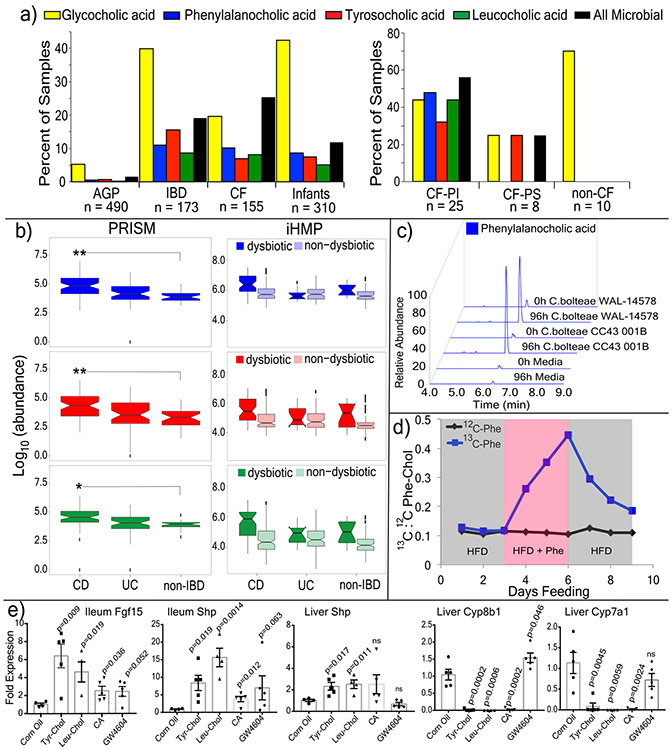
A mosaic of cross-phylum chemical interactions occurs between all metazoans and their microbiomes. A number of molecular families that are known to be produced by the microbiome have a marked effect on the balance between health and disease1-9. Considering the diversity of the human microbiome (which numbers over 40,000 operational taxonomic units10), the effect of the microbiome on the chemistry of an entire animal remains underexplored. Here we use mass spectrometry informatics and data visualization approaches11-13 to provide an assessment of the effects of the microbiome on the chemistry of an entire mammal by comparing metabolomics data from germ-free and specific-pathogen-free mice. We found that the microbiota affects the chemistry of all organs. This included the amino acid conjugations of host bile acids that were used to produce phenylalanocholic acid, tyrosocholic acid and leucocholic acid, which have not previously been characterized despite extensive research on bile-acid chemistry14. These bile-acid conjugates were also found in humans, and were enriched in patients with inflammatory bowel disease or cystic fibrosis. These compounds agonized the farnesoid X receptor in vitro, and mice gavaged with the compounds showed reduced expression of bile-acid synthesis genes in vivo. Further studies are required to confirm whether these compounds have a physiological role in the host, and whether they contribute to gut diseases that are associated with microbiome dysbiosis.


Figures

Extended Data Fig. 1.
Extended Data Fig. 1.. Microbiome and Metabolome Diversity in GF and SPF mice.
a) Principal coordinates analysis (PCoA) of microbiome and mass spectrometry data highlighted by sample source as GF or SPF (n=4). The microbial signatures from the GF mice are an important control that represent background reads found in buffers, tips and tubes and other experimental materials. b) Same data highlighted by organ source (n=4). c) Bray-Curtis dissimilarities of the metabolome data collected from murine organs. The dissimilarities are calculated within individual mice of the same group (GF or SPF, “Within”) or across the GF and SPF groups (“GF-SPF”) (n=4). Only samples collected from exact same location (sub-section) are compared. Significance tested with the Mann-Whitney U-test (two sided, Boxes represent the IQR, the notch is the 95% confidence interval of the mean, the center is the median, and whiskers are 1.5x the IQR). d) Microbiome profile of the murine GI tract in SPF mice. Data was generated by sequencing 16S rRNA gene amplicons from each organ and organ section and analyzed through the Qiita Deblur pipeline as described in the methods. Taxa of relevance are color coded according to the legend. e) Molecular network of LC-MS/MS data with nodes colored by source as GF, SPF, shared, or detected in blanks. Molecular families with metabolites annotated by spectral matching in GNPS are listed by a number corresponding to the molecular family. These are level 2 or 3 annotations according to the metabolomics standards consortium. 12-OAHSA = 12-(9Z-Octadecenoyloxy)-octadecanoic acid
Extended Data Fig. 2.
Extended Data Fig. 2.. Microbial metabolism of soyasaponins in GF and SPF metabolomics data (n=4).
a) Molecular network cluster of soyasaponins colored by source of each node as GF, SPF or shared. Structures of corresponding molecules are shown in nodes highlighted in yellow according to the numbering scheme. Mean total ion current normalized (TIC) abundance of each soyasaponin metabolite from the murine GI tract in the GF and SPF mice (Sto=Stomach, D=Duodenum, J=Jejunum, I=Ileum, Ce=Cecum, Co=Colon, Stl=Stool) (Boxes represent the IQR, the center is the median, and whiskers are 1.5x the IQR, n=4). b) Molecular family of soyasapogenols, their structures and relative abundances in GF and SPF gut organs (data same format a s in a)). c) ‘ili 3-D model visualization of the normalized abundance of soyasaponin I in the murine GI tract. Abundance of the metabolite is indicated according to the viridis spectrum (high red/hot colors, low blue/cool colors) n=4. d) ‘ili 3D cartography of the normalized abundance of soyasapogenol B onto an MRI organ model of the mice. e) Mean normalized abundance of soyasaponin I through all GI sample locations in the GF and SPF mice. f) Mean normalized abundance of soyasapogenol through all GI sample locations. The annotations are level 2 or 33.
Extended Data Fig. 3.
Extended Data Fig. 3.. Microbial metabolism of plant isoflavones in GF and SPF metabolomics data.
a) Structures, molecular network and total ion chromatogram (TIC) normalized abundance of glycone isoflavanoids in the murine GI tract. Nodes are colored according to their source in GF or SPF mice (n=4) and known library hits are shaped as arrowheads (Sto=Stomach, D=Duodenum, J=Jejunum, I=Ileum, Ce=Cecum, Co=Colon, Stl=Stool, Boxes represent the IQR, the center is the median, and whiskers are 1.5 x the IQR, n=4). b) Same information for the aglycones. c) 3D-molecular cartography mapping the abundance of the daidzein and glycitein glycone and sulfated forms through entire 3D-mouse model. The normalized abundance of a particular molecule is indicated as a heat map with red being most abundant and blue being lowest abundance. d) 3D-molecular cartography mapping the abundance of the daidzein and glycitein aglycone forms through entire 3D-mouse model. The GI tract model only is inset for reference. The annotations are level 2 or 33.
Extended Data Fig. 4.
Extended Data Fig. 4.. Microbial metabolism of known bile acids in GF and SPF metabolomics data (n=4).
a) Total ion chromatogram (TIC) normalized abundance of taurocholic acid and secondary bile acids in GF and SPF mice GI tract samples (Liv=Liver, G=Gall, Sto=Stomach, D=Duodenum, J=Jejunum, I=Ileum, Ce=Cecum, Co=Colon, Stl=Stool Boxes represent the IQR, the center is the median, and whiskers are 1.5 x the IQR). b) 3D-molecular cartography mapping the abundance of the same bile acids through the mouse GI tract model including liver separated for better visualization. The normalized abundance of a particular molecule is indicated as a heat map with red being most abundant and blue being lowest abundance. The annotations are level 2 or 33.
Extended Data Fig. 5.
Extended Data Fig. 5.. Mass spectrometry analysis of novel conjugated bile acids.
a) Extracted ion chromatogram MS traces of Tyr-chol (m/z 572.37 +/− 0.05 Da), Phe-chol (m/z 556.37 +/− 0.05 Da) and Leu-chol (m/z 522.37 +/− 0.05 Da, experiments performed four times). b) Extracted ion chromatograms for the synthetic muricholic and cholic acid versions of the Phe- (m/z556.37 +/−0.05), Tyr- (572.37 +/−0.05) and Leu- (522.37 +/−0.05) conjugates showing the different retention times from the muricholic and cholic acid forms. c) Retention time alignments of novel synthetic muricholic and cholic acid conjugates with the novel conjugates found those found in a colonized murine jejunum sample. The isoleucocholic and leucocholic acid analysis was run on a long gradient HPLC column to separate isomeric ile/leu conjugates and compare to that detected in vivo. d) Annotation of MS/MS fragmentation patterns for the 3 novel conjugated bile acids discovered in this manuscript and GCA. Structures of the immonium ions from amino acid fragmentation, whole amino acid fragments and major sterol fragment are shown. Loss of the amino acid mass on the bile acid steroid backbone is also highlighted.
Extended Data Figure 6.
Extended Data Figure 6.. Distribution and metabolism of novel conjugated bile acids.
a) Molecular network of SPF duodenum MS/MS data and synthesized amino acid conjugated bile acids. LC-MS/MS data from synthetic standards was networked with murine samples and spectral matching through molecular networking is indicated by node coloring. Mirror plots showing the alignment between the murine and standards are shown. Nodes shaped as arrowheads had hits in the GNPS libraries and node size is scaled to the spectral count. Tauro=Taurocholic acid. These experiments were repeated twice. b) 3D-molecular cartography of the mean abundance of the newly discovered conjugates mapped onto a 3D-rendered model of the murine GI tract as a heatmap according to the color scale. Organs are labeled as described in Fig. 1. c) Molecular network of GF and SPF portal and peripheral blood conjugated bile acids. Nodes are colored by source as either GF and SPF or portal/peripheral blood. Arrowhead nodes represent known compounds in the GNPS spectral database, circular nodes represent unknowns. The annotations are through spectral matches against reference libraries (level 2 or 33). d) Mean area under curve abundance and standard deviations of bile acids of interest during incubation with an actively growing batch human fecal culture for 24 h (n=3). e) Molecular network of novel conjugated bile acids after incubation in a human fecal batch culture experiment. Each node represents a unique MS/MS spectrum and arrowhead shaped nodes indicate known spectra in the GNPS database. The nodes are colored by their retention time according to the legend and the mass shift between nodes are mapped onto the edge representing the cosine connection between related spectra. The H2 mass shift representing oxidation of the novel conjugates is shown. f) Mean ion intensity and standard deviations of the dehydrogenated forms of Phe-chol, Tyr-chol and Leu-chol through the 24h batch fecal culture incubation (n=3).
Extended Data Fig. 7.
Extended Data Fig. 7.. MASST search results and associations of novel conjugated bile acids with high fat diet.
a) Proportion of samples where Phe-chol, Tyr-chol and Leu-chol were found from a single spectrum MASST search of publicly available data on GNPS. Massive data set ID’s are shown for each dataset and they are divided as either murine or human GI samples. b) Boxplots (boxes represent the interquartile range (IQR), the line is the median, and whiskers are 1.5 x the IQR) of the novel conjugates in a previously published murine study where animals were fed high fat diet (HFD, n=14) or normal chow (NC, n=19) (Gly p=0.72, Phe p=0.038, Tyr p=0.083, Leu p=9.4 x10⁻⁵) and dotplot of mice treated with (n=27) or without antibiotics (Ab, n=415). Bottom color legend corresponds to panels a and b. c) Mean normalized abundance of the three novel conjugated bile acids compared to taurocholic acid in mice (apoE knockout on a C57BL/6J background) fed either HFD (n=12) or normal chow for 10 weeks (n=12). Fecal samples were collected and extracted in 50:50 methanol water and analyzed with LC-MS/MS metabolomics as described in the methods. Standard deviations around the means are shown and significance between HFD and normal chow at each time point is tested with the student’s t-test (***=p<0.001, two sided). d) Correlations between rarefied reads of a deblurred read assigned to a Clostridium sp. from atherosclerosis mice fed high fat diet through time (n=12). The line of best fit is plotted using the lm method in the R statistical software gray area around the line of best fit is the 95% confidence interval.
Extended Data Fig. 8.
Extended Data Fig. 8.. Synthesis of novel conjugated bile acids by Clostridia spp.
a) Dotplot of the measured production of Phe-chol and Tyr-chol using a targeted LC-MS method for two Clostridium bolteae strains grown in fecal culture media (FCM) with or without labelled Phe (n=2). b) The mean ratio and standard error of 13C:12C phenylalanocholic acid from the same C. bolteae strains when grown with fecal culture media (FCM) with 13C-labelled phenylalanine (bottom left, n=2). c) Mean and standard deviation of the Shannon index of human fecal batch culture (n=3) before and after 24-hour growth exposed to conjugated bile acids or a mock control (NS = not significant by Mann-Whitney U-test). d) Box and whisker plots of concentration of Phe-chol and Tyr-chol in original SPF gut samples. (Boxes represent the IQR, the center is the median, and whiskers are 1.5 x the IQR, n=4)
Extended Data Fig. 9.
Extended Data Fig. 9.. Effect of novel bile acids on FXR.
a) Mean normalized luciferase activity as a readout of human FXR stimulation when exposed to various conjugated and unconjugated bile acids as a function of the compound dose (n= 8 measurements, +/− SE, DCA=deoxycholic acid, CDCA=chenodeoxycholic acid, T-βMCA=tauro-beta-muricholic acid). b) Ileum mean fold expression change compared to 36B4 control of various bile acids after gavage in mice (error bars are standard error). c) Liver fold expression change compared to 36B4 control of various bile acids after gavage in mice. Significance was tested with the two-tailed t-test compared to the mock corn oil control (error bars are the standard error).
Figure 1.
Figure 1.. Global impacts of the microbiome on the chemistry of an entire mammal.
a) 3-D model of murine organs mapped with the mean 1st principle coordinate as a heatmap according to the color scale (from Extended data Fig. 1) from the GF and SPF mice (n=4). (Er=ear, Br=brain, Ad=adrenal gland, Es=esophagus, Tr=trachea, Sto=stomach, Kd=kidney, Mo=mouth, Duo=duodenum, Ov=ovary, Col=colon, F=feces, Hd=hand, Lg=lung, Lv=liver, Jej=jejunum, Cec=cecum, Bl-bladder, Ut=uterus, Cx=cervix, Vg=vagina, Ft=feet). b) Mean percent and total number of unique spectra in each organ sampled from the two mouse groups. c) Relative abundance (to total ion current (TIC)) of the 30 most differential metabolites between GF and SPF murine guts. The metabolites are colored as secondary bile acids (blue), primary bile acids (red), soyasaponins (pink), peptides (yellow) and unknowns (brown). Annotations are based on spectral matching or molecular network propagation (level two or three). It must be noted that stereochemistry of the annotated molecules cannot be discerned using these methods. d) Mean and 95% confidence interval of the Shannon-Weiner diversity of the metabolomic data in each GI tract sample for GF and SPF mice. Statistical significance between metabolome diversity in the same sample location between GF and SPF mice was tested with the Mann-Whitney U-test (n=4, two-sided, *=p=0.028, #=p=0.057). e) Results of meta-mass shift chemical profiling showing the spectral counts of known mass differences between unique nodes in either GF or SPF mice. Each mass difference corresponds to the node-to-node gain or loss of a particular chemical group.
Figure 2.
Figure 2.. Novel microbial bile acid conjugates.
a) Structures and molecular networks of novel microbiome conjugated bile acids with the host-conjugated GCA shown for comparison. The molecular network is colored by mapping to either GF or SPF mice according to the color legend with an inset highlighting the parent masses and mass differences between the newly discovered molecules and GCA. Each node represents a clustered MS/MS spectrum and connections between the nodes indicate relationships through the cosine score with their width scaled by the cosine size (cutoff minimum 0.7). Circular nodes are unknowns and arrowheads are spectra with matches in the GNPS libraries. b) Dot plot of the area under curve abundance of the novel and host synthesized bile acid conjugates in each SPF mouse (n=4) through the murine GI tract and its subsections.
Figure 3.
Figure 3.. Presence, synthesis and function of microbial bile acid conjugates.
a) Percent of samples positive for the novel bile acids from GNPS public datasets (AGP=American gut project, CF=cystic fibrosis) and pediatric CF patients compared to non-CF controls (PS=Pancreatic Sufficient, PI=Pancreatic Insufficient, color coding of bile acids refers to panels a-c). b) Abundance of novel conjugates in the PRISM and HMP2 datasets. Statistical significance for PRISM data was tested using the Wald’s test (CD n=68; UC n=53; non-IBD n=34) and for the iHMP dataset with a linear mixed-effects model (two-sided). The iHMP comparisons are separated by IBD type and dysbiotic or non-dysbiotic states (UC n=12 dysbiotic and n=110 non-dysbiotic metabolomes; for CD n=48 dysbiotic and n=169 non-dysbiotic; non-IBD dysbiotic n=15, non-IBD non-dysbiotic n=107). Significance is shown using Benjamini-Hochberg corrected p-values (Leu q=0.031, Tyr q=0.0074, Phe q=0.0043, *q<0.05, **q<0.05). Boxes represent the IQR, notch is the 95% confidence interval of the mean, center is the median, and whiskers are 1.5 x the IQR. c) Extracted ion chromatograms of Phe-chol from cultured isolates of C. bolteae compared to media control at 0h and 96h (top, repeated twice). d) The ratio of 13C:12C Phe-chol in mouse fecal samples fed a high fat diet with 13C-labelled phenylalanine (blue line) or unlabeled phenylalanine (black line) through time. Grey area indicates 3-day period where HFD was fed, red indicates when HFD was supplemented with Phe. e) RT-qPCR data showing mean and standard error of the gene expression ratio (ddCt) of Fgf15, Shp, Cyp7b1 and Cyp7a1 to the 36B4 (RPLPO) reference control in the ileum and/or liver of mice gavaged with different bile acids compared to a mock control (corn oil) after 72 hrs. Statistical significance was tested against the mock control with a two-tailed T-test (n=4-5/group, whiskers in the plot are the standard error). CA=cholic acid

Comment in

References

    1. Ridlon JM, Kang DJ, Hylemon PB & Bajaj JS Bile acids and the gut microbiome. Curr. Opin. Gastroenterol 30, 332–8 (2014). - PMC - PubMed
    1. Gilbert JA et al. Microbiome-wide association studies link dynamic microbial consortia to disease. Nature 535, (2016). - PubMed
    1. Wikoff WR et al. Metabolomics analysis reveals large effects of gut microflora on mammalian blood metabolites. Proc. Natl. Acad. Sci. U. S. A 106, 3698–703 (2009). - PMC - PubMed
    1. Marcobal A et al. Metabolome progression during early gut microbial colonization of gnotobiotic mice. Sci. Rep 5, 11589 (2015). - PMC - PubMed
    1. Miller TL & Wolin MJ Pathways of acetate, propionate, and butyrate formation by the human fecal microbial flora. Appl. Environ. Microbiol 62, 1589–92 (1996). - PMC - PubMed

Publication types

MeSH terms

Substances