. 2020 Apr 17;48(7):e42.
doi: 10.1093/nar/gkaa099.

Real-time kinetics and high-resolution melt curves in single-molecule digital LAMP to differentiate and study specific and non-specific amplification

Affiliations

Real-time kinetics and high-resolution melt curves in single-molecule digital LAMP to differentiate and study specific and non-specific amplification

Justin C Rolando et al. Nucleic Acids Res. .

Abstract

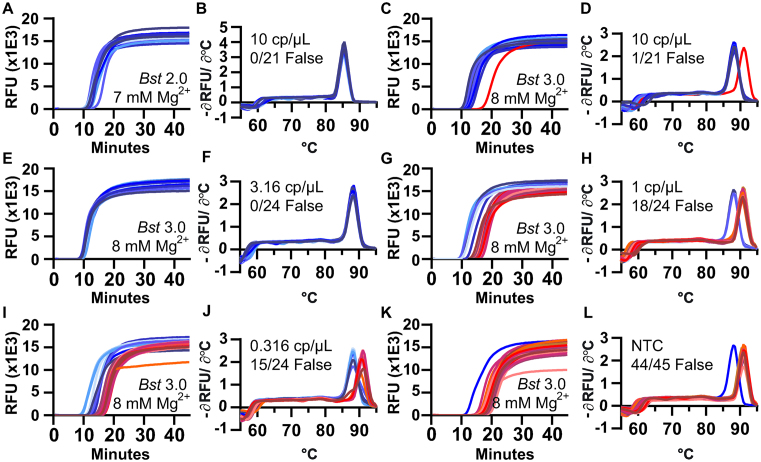
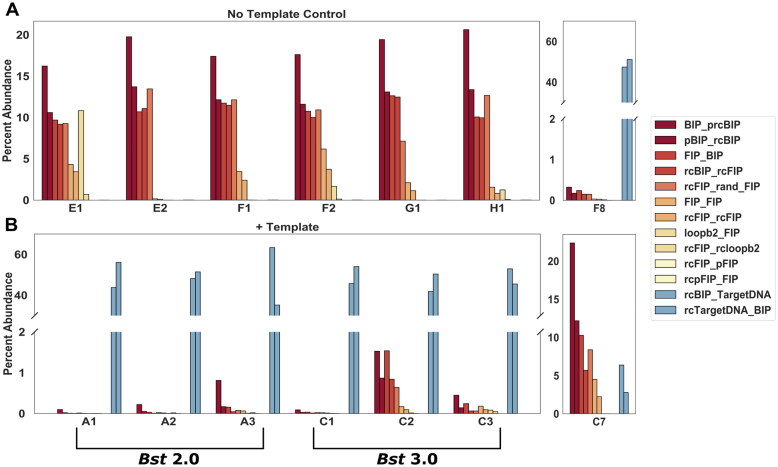
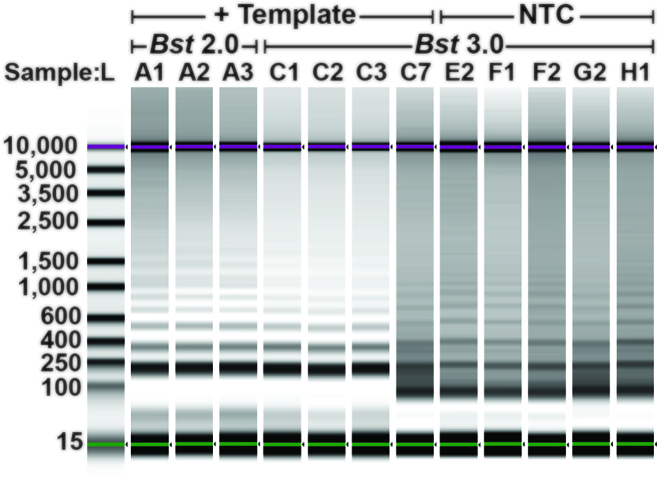
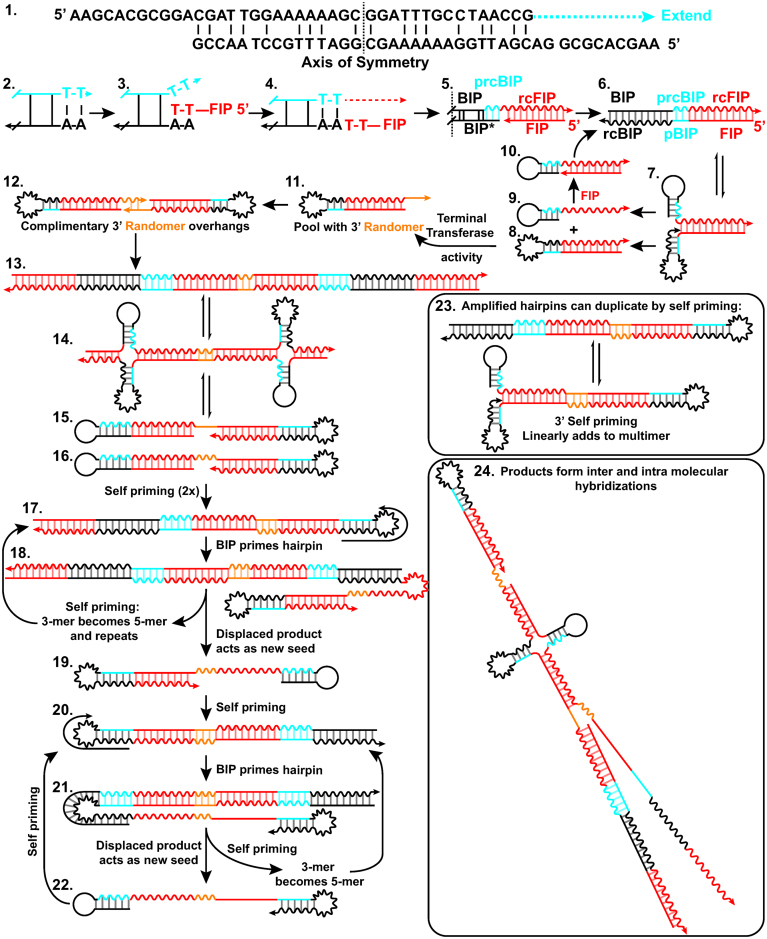
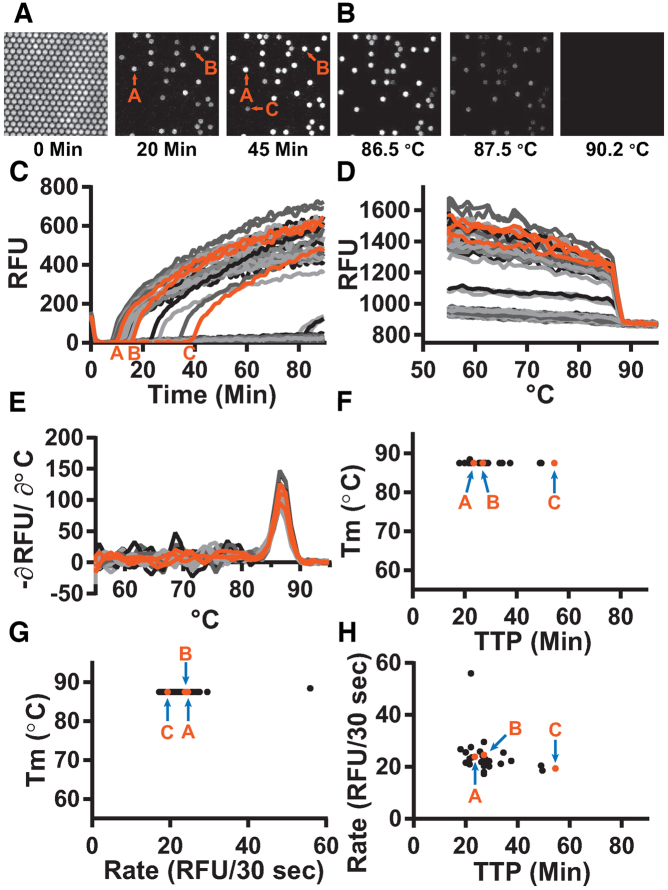
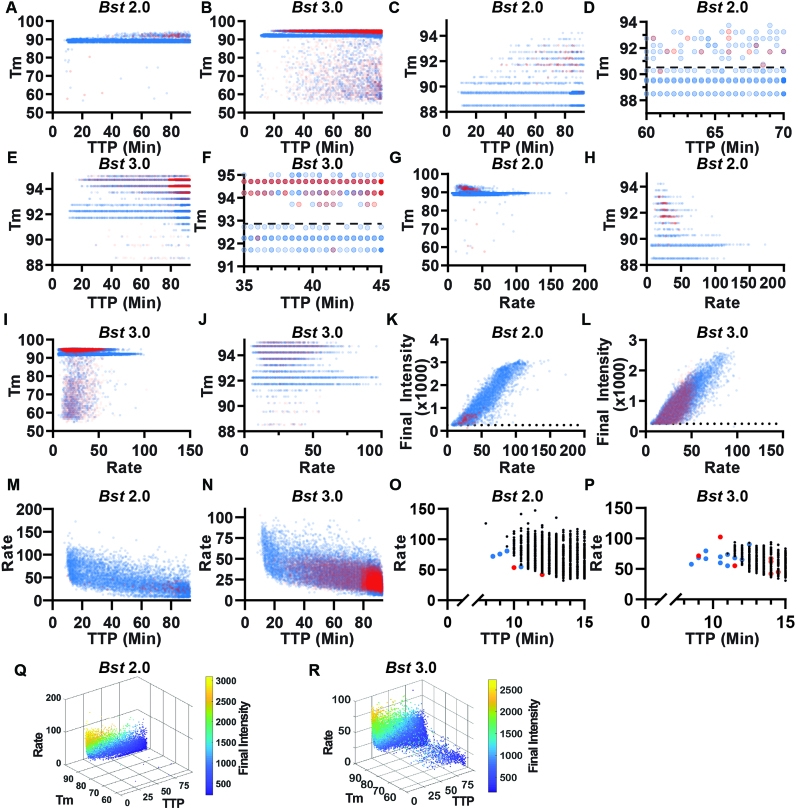
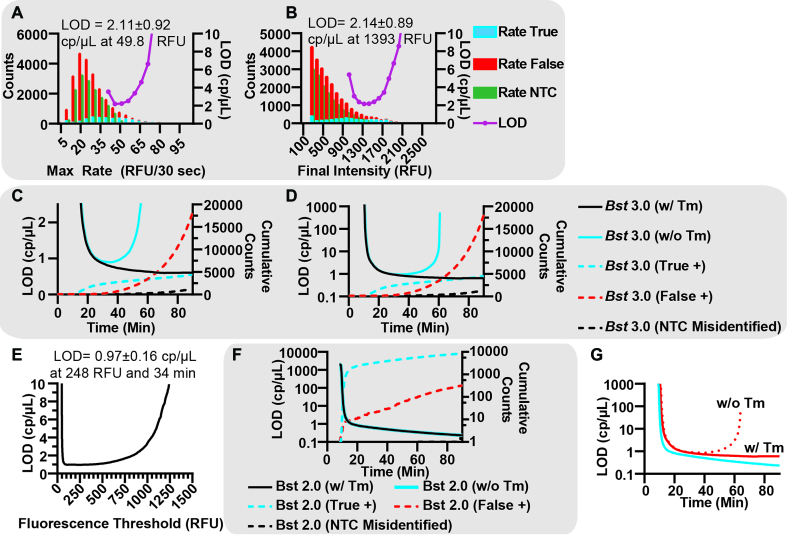
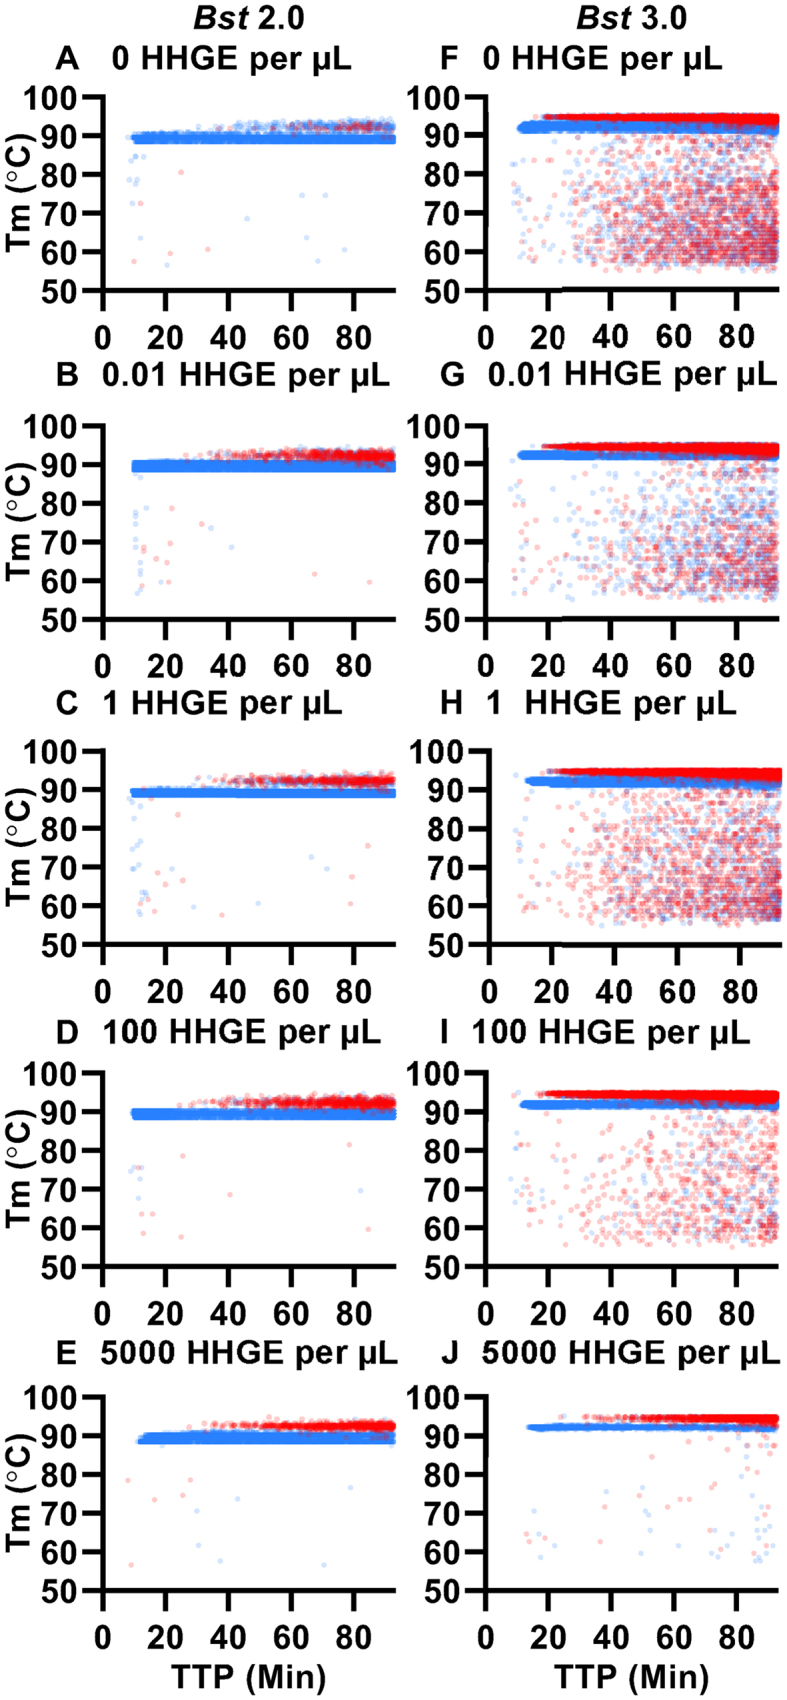
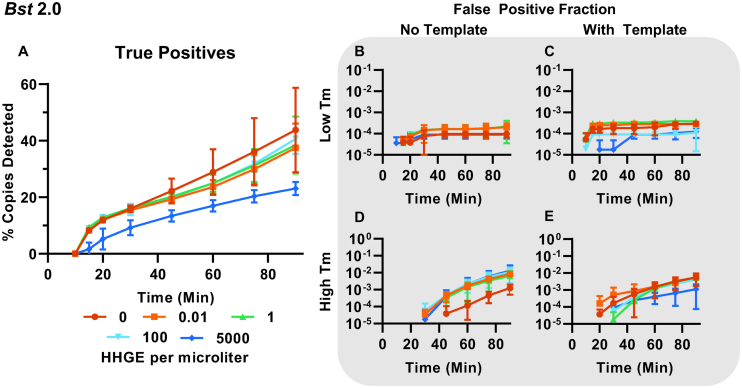
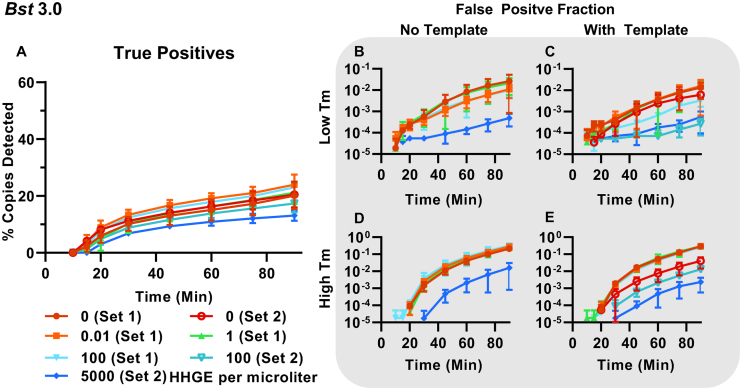
Isothermal amplification assays, such as loop-mediated isothermal amplification (LAMP), show great utility for the development of rapid diagnostics for infectious diseases because they have high sensitivity, pathogen-specificity and potential for implementation at the point of care. However, elimination of non-specific amplification remains a key challenge for the optimization of LAMP assays. Here, using chlamydia DNA as a clinically relevant target and high-throughput sequencing as an analytical tool, we investigate a potential mechanism of non-specific amplification. We then develop a real-time digital LAMP (dLAMP) with high-resolution melting temperature (HRM) analysis and use this single-molecule approach to analyze approximately 1.2 million amplification events. We show that single-molecule HRM provides insight into specific and non-specific amplification in LAMP that are difficult to deduce from bulk measurements. We use real-time dLAMP with HRM to evaluate differences between polymerase enzymes, the impact of assay parameters (e.g. time, rate or florescence intensity), and the effect background human DNA. By differentiating true and false positives, HRM enables determination of the optimal assay and analysis parameters that leads to the lowest limit of detection (LOD) in a digital isothermal amplification assay.


Figures

Figure 1.
Figure 1.
Amplification and Tm curves of Chlamydia trachomatis in a bulk reaction show non-specific amplification products with high Tm. Plots of fluorescence as a function of time during a LAMP reaction (AC, E, G, I and K) and the derivative plot of fluorescence as a function of temperature for the corresponding melting curves (BD, F, H, I and J). Reactions using Bst 2.0 at 10 copies per microliter (cp/μl) (A and B), and using Bst 3.0 at 10 cp/μl (C and D), 3.16 cp/μl (E and F), 1 cp/μl (G and H), 0.316 cp/μl (I and J), and without template (K and L). Reactions of specific amplification are different shades of blue; non-specific amplification is different shades of red. The number of false-positive reactions is reported within each panel as N/Nreaction False. NTotal for all conditions = 159 reactions.
Figure 2.
Figure 2.
Quantification of junctions using next-generation sequencing of select Chlamydia trachomatis amplification products from bulk reactions. Non-specific amplification from the no-template control using Bst 3.0 (A), including amplification of a specific target contamination (well F8) corresponding to Figure 1K and L. Amplification in the presence of 10 cp/μl template (B), using Bst 2.0 (wells A1-A3) corresponding to Figure 1A and B, and Bst 3.0 (wells C1-C3) corresponding to Figure 1C and D. Non-specific amplification in the presence of 10 cp/μl template and Bst 3.0 (well C7) corresponding to Figure 1C and D. For a complete list of abbreviations used in this figure, see Supplementary Table S2.
Figure 3.
Figure 3.
Composite image of select Chlamydia trachomatis amplification products from a bulk reaction. Products were collected using D5000 tape on an Agilent TapeStation. Amplification in the presence of 10 cp/μl template using Bst 2.0 (lanes A1-A3) corresponding to Figure 1A and B, and Bst 3.0 (lanes C1-C3, C7) corresponding to Figure 1C and D. Non-specific amplification in the no-template control (NTC; lanes E2-H1) correspond to Figure 1K and L. Contrast was determined using the automatic ‘scale to sample’ feature in the Agilent TapeStation analysis software.
Figure 4.
Figure 4.
Illustration of a mechanism for formation of non-specific amplification products in LAMP reactions. Putative structures and intermediates are labeled with numbers. Forward sequences are illustrated as a straight line, and the reverse compliment as a wavy line of matching color. Abbreviations used in this figure: BIP, Backward Inner Primer; rcBIP, Reverse compliment of BIP; FIP, Forward Inner Primer; rc FIP, Reverse Compliment of FIP; prcFIP, Partial Reverse Compliment of FIP.
Figure 5.
Figure 5.
Specific amplification in digital single-molecule experiments using Bst 2.0. (A) Fluorescence micrographs of individual partitions are traced over time. For simplicity, we illustrate a subset of 250 of 20,000 possible partitions at three time points (0, 20 and 45 min). Of the 250 partitions in this micrograph, 30 partitions amplified. Partitions A and B are visible at 20 min; partition C becomes visible at 45 min. (B) Fluorescence micrographs of individual partitions are traced across temperatures during an HRM experiment. As the double-stranded DNA in each partition de-hybridizes, the intercalating dye is released and fluorescence decreases. (C) Plotting the fluorescence intensity as a function of time generates the standard amplification traces of individual partitions generated during a 90-min LAMP experiment. Orange curves correspond to partitions A–C from panel A. (D) Traces of fluorescence intensity as a function of temperature for individual partitions during melting experiments. By quantifying real-time intensity of individual partitions as temperature increases, melting traces are obtained. Temperature resolution is 1°C from 55–90°C, and 0.5°C from 90–95°C. (E) The derivative plot of panel D generates the standard melting curve. The temperature at which the derivative maximum occurs corresponds to the ‘melting point’ of the LAMP products in the individual partition. (F) The time each partition reached a fluorescence intensity of 250 RFU (TTP) as a function of temperature. (G) Maximum rate as a function of Tm for each partition. (H) TTP as a function of maximum rate for each partition.
Figure 6.
Figure 6.
Properties of specific and non-specific amplification using real-time kinetics and Tm. Blue indicates amplification events in the presence of template, red indicates amplification in the absence of template (NTC). Among these amplification events, true positives were identified using Tm (88.5–90.3°C for Bst 2.0 and 91.25–92.75°C using Bst 3.0). Color intensity indicates the abundance of paritions at a given TTP and temperature (partitions in panels ACDGHKM using Bst 2.0 are rendered at 20% opacity in the NTC and in the presence of template; panels BEFIJ, LN using Bst 3.0 are rendered at 5% opacity in the NTC and 20% in the presence of template. (A) Tm of individual amplification events as a function of TTP using Bst 2.0. (B) Tm of individual amplification events as a function of TTP using Bst 3.0. (C) Individual partitions with Tm between 88 and 95°C as a function of TTP using Bst 2.0. (D) Individual partitions with Tm between 88 and 95°C and TTP between 60 and 70 min using Bst 2.0. Dashed line at 90.3°C indicates the upper threshold separating specific and non-specific amplification. (E) Individual partitions with Tm between 91 and 95°C as a function of TTP using Bst 3.0. (F) Individual partitions with Tm between 91 and 95°C and TTP between 35 and 45 min using Bst 3.0. Dashed line at 92.75°C indicates the upper threshold separating specific and non-specific amplification. (G) Tm of individual amplification events as a function of maximum rate using Bst 2.0. (H) Tm of individual amplification events between 88 and 95°C as a function of maximum rate using Bst 2.0. (I) Tm of individual amplification events as a function of maximum rate using Bst 3.0. (J) Tm of individual amplification events between 88 and 95°C as a function of maximum rate using Bst 3.0. (K) The final intensity of individual amplification events as a function of maximum rate using Bst 2.0. (L) The final intensity of individual amplification events as a function of maximum rate using Bst 3.0. (K and L) Partitions with a final intensity <250 RFU (dotted line) were excluded from analyses. (M) The maximum rate of individual amplification events as a function of TTP using Bst 2.0 and (N) using Bst 3.0. (O) Plot of maximum rate from false-positive amplifications in NTC (red), false positives amplifications in the presence of template (blue) and true-positive amplifications by Tm (black) as a function of TTP using Bst 2.0 and (P) using Bst 3.0. (Q) 3D plots comparing maximum rate, Tm, TTP and final intensity of individual partitions using Bst 2.0 and (R) using Bst 3.0.
Figure 7.
Figure 7.
Classification of amplification reactions using HRM to determine optimal performance of dLAMP assays. (A) Histogram of the false positives identified by Tm within the presence of template (red), true positives by Tm (blue) and false positives in the NTC (green), binned by max rate of the partition and an LOD curve plotted as a function of max rate using Bst 3.0. (B) Histogram of the false positives identified by Tm within the presence of template (red), true positives by Tm (blue) and false positives in the NTC (green), binned by final intensity of the partition and an LOD curve plotted as a function of final intensity using Bst 3.0. (C) LOD Curves using Bst 3.0 as a function of time without using in the final assay (blue) and using Tm in the final device (black). Plots of cumulative counts of true positives (red dashed), false positives (blue dashed) and incorrectly identified partitions (black dashed). (D) Logarithmic plot of LOD curves using Bst 3.0 as a function of time without using Tm in the final assay (blue) and using Tm in the final device (black). Plots of cumulative counts of true positives (red dashed), false positives (blue dashed) and incorrectly identified partitions (black dashed). (E) LOD plotted as a function of fluorescence intensity, when the assay is measured at the optimal TTP of 34 min. (F) Logarithmic plot of LOD curves, using Bst 2.0, as a function of time without using Tm in the final assay (blue) and using Tm in the final device (black). The blue and black plots overlay. Plots of cumulative counts of true positives (blue dashed), false positives (red dashed) and incorrectly identified partitions (black dashed). (G) Plot of LOD curves as a function of time comparing Bst 2.0 (solid blue with Tm, dotted blue without Tm) and Bst 3.0 (solid red with Tm, dotted red without Tm). Curves for Bst 2.0 overlap.
Figure 8.
Figure 8.
Impacts of host (human) genomic DNA in human haploid genome equivalents (HHGE) on specific and non-specific amplification. Plots of Tm as a function TTP using Bst 2.0 at (A) 0 HHGE per μl; (B) 0.01 HHGE per μL, (C) 1 HHGE per μl, (D) 100 HHGE per μl and (E) 5000 HHGE per μl; and using Bst 3.0 at (F) 0 HHGE per μl, (G) 0.01 HHGE per μl, (H) 1 HHGE per μl, (I) 100 HHGE per μl (J) 5000 HHGE per μl in the presence of template (blue) and NTC (red). N = 3 for all conditions, except Bst 3.0 at 0 and 100 HHGE per μl in the presence of template, where N = 6.
Figure 9.
Figure 9.
Quantification of the impact of hgDNA on specific and non-specific amplification using Bst 2.0 a as a function of time. (A) The percentage copies detected (specific amplification) as a function of time. (B and C) The fraction of partitions with non-specific amplification with Tm less than the specific amplification in the NTC (B) and in the presence of template (C) as a function of time. (D andE) The fraction of partitions with non-specific amplification with Tm greater than the specific amplification in the NTC (D) and in the presence of template (E) as a function of time. Panel (A) is available in tabular form as Supplementary Table S9.
Figure 10.
Figure 10.
Quantification of the impact of hgDNA on specific and non-specific amplification using Bst 3.0 as a function of time. (A) The percentage copies detected (specific amplification) as a function of time. (B and C) The fraction of partitions with non-specific amplification with Tm less than the specific amplification in the NTC (B) and in the presence of template (C) as a function of time. (D and E) The fraction of partitions with non-specific amplification with Tm greater than the specific amplification in the NTC (D) and in the presence of template (E) as a function of time. Panel (A) is available in tabular form as Supplementary Table S10.

References

    1. Kong J.E., Wei Q., Tseng D., Zhang J., Pan E., Lewinski M., Garner O.B., Ozcan A., Di Carlo D.. Highly stable and sensitive nucleic acid amplification and cell-phone-based readout. ACS Nano. 2017; 11:2934–2943. - PubMed
    1. Phillips E.A., Moehling T.J., Bhadra S., Ellington A.D., Linnes J.C.. Strand displacement probes combined with isothermal nucleic acid amplification for instrument-free detection from complex samples. Anal. Chem. 2018; 90:6580–6586. - PMC - PubMed
    1. Notomi T., Okayama H., Masubuchi H., Yonekawa T., Watanabe K., Amino N., Hase T.. Loop-mediated isothermal amplification of DNA. Nucleic Acids Res. 2000; 28:e63. - PMC - PubMed
    1. Somboonna N., Choopara I., Arunrut N., Sukhonpan K., Sayasathid J., Dean D., Kiatpathomchai W.. Rapid and sensitive detection of Chlamydia trachomatis sexually transmitted infections in resource-constrained settings in Thailand at the point-of-care. PLoS Negl. Trop. Dis. 2018; 12:e0006900. - PMC - PubMed
    1. Ljubin-Sternak S., Meštrović T.. Chlamydia trachomatis and genital mycoplasmas: pathogens with an impact on human reproductive health. J. Pathog. 2014; 2014:183167. - PMC - PubMed

Publication types

Supplementary concepts