

Organismal benefits of transcription speed control at gene boundaries
- PMID: 32103605
- PMCID: PMC7132196
- DOI: 10.15252/embr.201949315
Organismal benefits of transcription speed control at gene boundaries
Abstract
RNA polymerase II (RNAPII) transcription is crucial for gene expression. RNAPII density peaks at gene boundaries, associating these key regions for gene expression control with limited RNAPII movement. The connections between RNAPII transcription speed and gene regulation in multicellular organisms are poorly understood. Here, we directly modulate RNAPII transcription speed by point mutations in the second largest subunit of RNAPII in Arabidopsis thaliana. A RNAPII mutation predicted to decelerate transcription is inviable, while accelerating RNAPII transcription confers phenotypes resembling auto-immunity. Nascent transcription profiling revealed that RNAPII complexes with accelerated transcription clear stalling sites at both gene ends, resulting in read-through transcription. The accelerated transcription mutant NRPB2-Y732F exhibits increased association with 5' splice site (5'SS) intermediates and enhanced splicing efficiency. Our findings highlight potential advantages of RNAPII stalling through local reduction in transcription speed to optimize gene expression for the development of multicellular organisms.
Keywords: NET-seq; speed; splicing; stalling; transcription.
© 2020 The Authors. Published under the terms of the CC BY NC ND 4.0 license.
Conflict of interest statement
The authors declare that they have no conflict of interest.
Figures
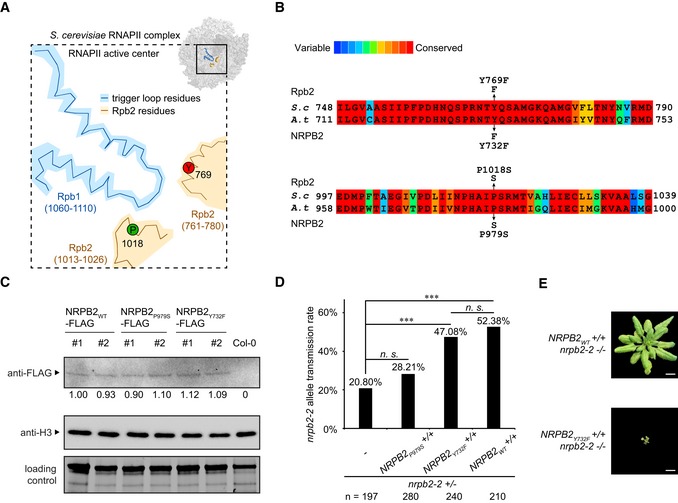
- A
Schematic drawing of Saccharomyces cerevisiae RNAPII transcription active center. Trigger loop is shown in blue. TL‐interacting Rpb2 domain is shown in beige. Proline 1018 (P1018, green) and gating tyrosine 769 (Y769, red) are highlighted. The schematic drawing is based on PDB: 2e2h 15.
- B
Protein sequence alignment of RNAPII Rpb2 Y769 and P1018 regions in S. cerevisiae and Arabidopsis thaliana. P979S and Y732F are the yeast equivalent point mutations in Arabidopsis. The color scheme indicates conservation from variable (blue) to conserved (red).
- C
Detection of NRPB2WT‐FLAG, NRPB2P979S‐FLAG, and NRPB2Y732F‐FLAG protein by Western blotting in NRPB2 WT ‐FLAG Col‐0, NRPB2 P979S ‐FLAG Col‐0, and NRPB2Y 732F ‐FLAG Col‐0 plants. Untagged NRPB2 (Col‐0) was used as a negative control. Histone H3 was used as an internal control, and total protein level detected by stain‐free blot was used as a loading control. Quantification was done by normalizing to the loading control and anti‐H3 blot based on three independent replicates.
- D
Transmission rate of nrpb2‐2 allele in nrpb2‐2 +/− line (n = 197) and nrpb2‐ +/− lines combined with homozygous NRPB2 P979S ‐FLAG +/+ (n = 280), NRPB2 Y732F ‐FLAG +/+ (n = 240), and NRPB2 WT ‐FLAG +/+ (n = 210), respectively. Fisher's exact test was used as a statistical test, three asterisks denote P < 0.001 between samples, and n.s. stands for not significant.
- E
Image of homozygous mutant nrpb2‐2 fully complemented by NRPB2 WT ‐FLAG (top, NRPB2 WT +/+ nrpb2‐2 −/−) and partially complemented by NRPB2 Y732F ‐FLAG (bottom, NRPB2 Y732F +/+ nrpb2‐2 −/−). Plants were grown for 4 weeks in soil. Scale bars represent 1 cm.
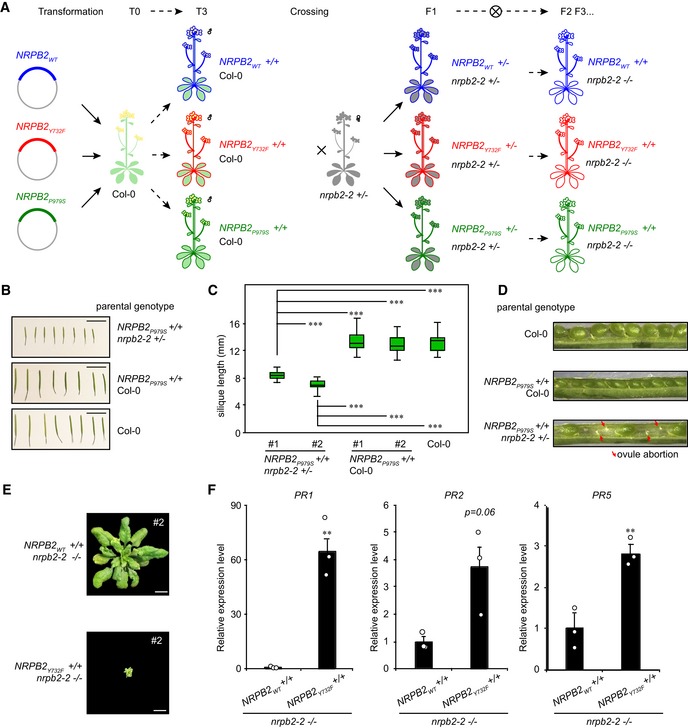
- A
Schematic overview of a work flow to generate NRPB2 WT +/+ nrpb2‐2 −/−, NRPB2 Y732F +/+ nrpb2‐2 −/− , and NRPB2 P979S +/+ nrpb2‐2 +/− Arabidopsis. First, constructs harboring NRPB2 WT (blue), NRPB2 Y732F (red), and NRPB2 P979S (green) transgene expression cassette were transformed into wild‐type (Col‐0) Arabidopsis via Agrobacterium‐mediated transformation; T3 transformant plants with homozygous transgenes are crossed with nrpb2‐2 +/− (gray) heterozygous Arabidopsis; then, plants positive for both transgenes and nrpb2‐2 allele were selected for propagation into F3 generation to screen for homozygous double mutants of transgene and nrpb2‐2.
- B
Phenotype of Arabidopsis siliques of wild‐type (Col‐0), NRPB2 P979S +/+ Col‐0, and NRPB2 P979S nrpb2‐2 +/− plants. Scale bars represent 10 mm.
- C
Silique length of wild‐type (Col‐0), NRPB2 P979S Col‐0, and NRPB2 P979S +/+ nrpb2‐2 +/− plants (n > 20 for each genotype). Two‐sided Student's t‐test was used for statistical test, *** denotes P < 0.001. The solid horizontal lines and box limits represent median, lower and upper quartiles of data values in each group. The upper and lower whiskers extend to the largest or smallest value, respectively, no further than 1.5*IQR from the relevant quartile.
- D
Opened siliques from wild‐type (Col‐0), NRPB2 P979S +/+ Col‐0, and NRPB2 P979S +/+ nrpb2‐2 +/− plants. Red arrows indicate aborted ovules.
- E
Phenotype of alternative transformation events to lines presented in Fig 1E. Homozygous mutant nrpb2‐2 was fully complemented by NRPB2‐FLAG (top) and partially complemented by NRPB2 Y732F ‐FLAG (bottom). Plants were grown for 4 weeks in soil. Scale bars represent 1 cm.
- F
Relative expression level of PR1, PR2, and PR5 in NRPB2 WT +/+ nrpb2‐2 −/− and NRPB2 Y732F +/+ nrpb2‐2 −/− by RT–qPCR. Error bars represent SEM from three independent replicates. **denotes P < 0.01 by two‐sided Student's t‐test.
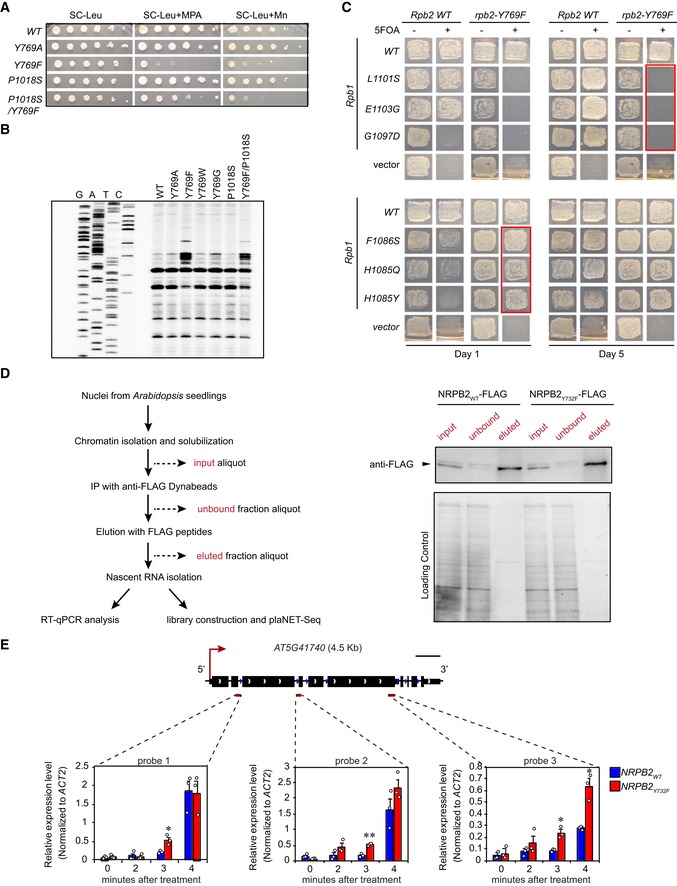
- A
Differential sensitivity of various budding yeast rpb2 mutants towards Mn2+ and MPA in SC‐Leu media.
- B
Primer extension analyses for ADH1 transcription start site usage in rpb2 mutants in budding yeast.
- C
Genetic interaction between rpb2‐Y769F and Rpb1 TL mutations. Growth was assayed at day 1 and day 5. Ability to grow on SC‐Leu + 5FOA indicates that rpb2‐Y769F counteracts Rpb1 TL mutations. Red box indicates the phenotype of rpb2‐Y769F crossed with Rpb1 TL mutations.
- D
A work flow of immunoprecipitation (IP) of FLAG‐tagged NRPB2 protein by anti‐FLAG followed by nascent RNA isolation, RT–qPCR analyses, and plaNET‐seq (left). Western blotting (right) of NRPB2WT‐FLAG and NRPB2Y732F‐FLAG as IP input (input), after IP (unbound), and after elution by FLAG peptides (eluted). Upper panel shows representative anti‐FLAG blots. Lower panel shows total proteins as loading control for indicated fractions.
- E
Nascent RNA profile of AT5G41740. Nascent RNA RT–qPCR assay measuring RNAPII signal at three positions (dark red bars: probes 1, 2, and 3) on gene upon flagellin 22 treatment in a 0‐, 2‐, 3‐, and 4‐min time course. Nascent RNA signal values were normalized to reference gene ACT2. Error bars represent SEM from 3 independent replicates. The statistical significance of differences between NRPB2 Y732F and NRPB2 WT at the same time point was assessed by two‐sided Student's t‐test. n.s. denotes not significant; * denotes P < 0.05; and ** denotes P < 0.01. Scale bar (black) represent 0.5 kb.
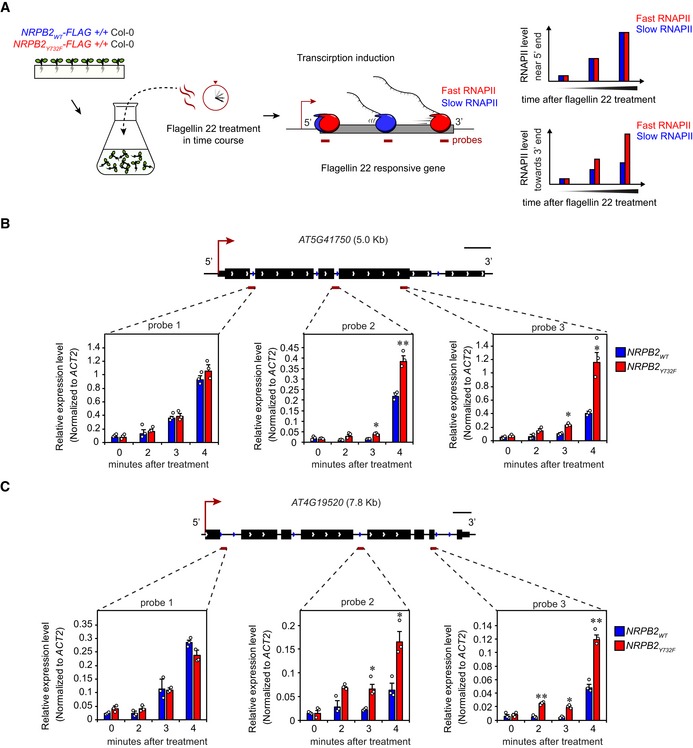
- A
Schematic drawing of the experimental design to investigate RNAPII transcription speed in vivo. In brief, Arabidopsis seedlings of NRPB2 WT ‐FLAG Col‐0 and NRPB2 Y732F ‐FLAG Col‐0 were grown on MS media for 12 days and then were transferred to MS liquid media for 2 days. Flagellin peptides (flagellin 22) were added into media, and treated samples were collected in a 0‐min (no treatment), 2‐, 3‐ and 4‐min time course. The nascent RNA was isolated and used for reverse transcription and qPCR analyses to reveal RNAPII accumulation at different region in genes. See Materials and Methods for technical details.
- B
Nascent RNA profile of AT5G41750. Nascent RNA RT–qPCR assay measuring RNAPII signal at three positions (dark red bars: probes 1, 2, and 3) on the gene upon flagellin 22 treatment in a 0‐, 2‐, 3‐, and 4‐min time course. Nascent RNA signal values were normalized to reference gene ACT2. Error bars represent SEM from three independent replicates. The statistical significance of differences between NRPB2 Y732F and NRPB2 WT at the same time point was assessed by a two‐sided Student's t‐test. n.s. denotes not significant; * denotes P < 0.05; and ** denotes P < 0.01. Scale bar (black) represent 0.5 kb.
- C
Nascent RNA profile of AT4G19520. Nascent RNA RT–qPCR assay measuring RNAPII signal at three positions (dark red bars: probes 1, 2, and 3) on the gene upon flagellin 22 treatment in a 0‐, 2‐, 3‐, and 4‐min time course. Nascent RNA signal values were normalized to reference gene ACT2. Error bars represent SEM from three independent replicates. The statistical significance of differences between NRPB2 Y732F and NRPB2 WT at the same time point was assessed by a two‐sided Student's t‐test. n.s. denotes not significant; * denotes P < 0.05; and ** denotes P < 0.01. Scale bar (black) represents 0.5 kb.
- A
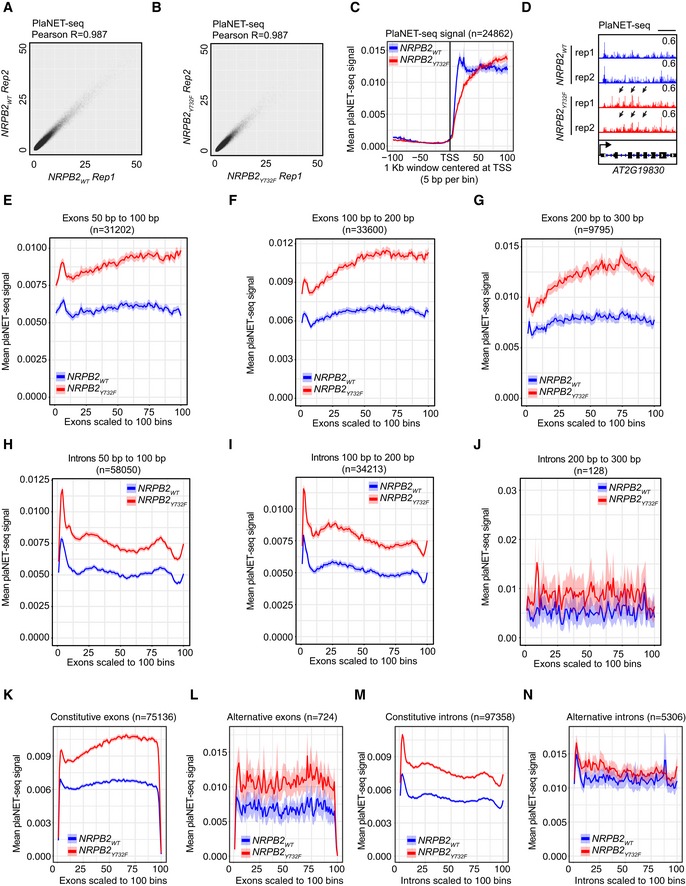
Scatterplot showing the biological reproducibility of plaNET‐seq experiment in NRPB2 WT +/+ nrpb2‐2 −/−. TPM‐normalized plaNET‐seq signal was summarized within 10‐bp bins genome‐wide. Pearson R = 0.987.
- B
Scatterplot showing the biological reproducibility of plaNET‐seq experiment in NRPB2 Y732F +/+ nrpb2‐2 −/−. TPM‐normalized plaNET‐seq signal was summarized within 10‐bp bins genome‐wide. Pearson R = 0.987.
- C
Metagene profile of plaNET‐seq mean signal of RNAPII in a 1 kb window centered at the TSS of Arabidopsis genes (n = 24,862) in NRPB2 WT (blue) and NRPB2 Y732F (red).
- D
plaNET‐seq signal of RNAPII across the whole AT2G19830 gene in NRPB2 WT (blue) and NRPB2 Y732F (red). Arrows indicate the elevated nascent RNAPII signal in the gene body.
- E
Metagene profile of plaNET‐seq mean signal of RNAPII in exons (50–100 bp, scaled to 100 bins, n = 31,202) in NRPB2 WT +/+ nrpb2‐2 −/− (NRPB2 WT, blue) and NRPB2 Y732F +/+ nrpb2‐2 −/− (NRPB2 Y732F , red).
- F
Metagene profile of plaNET‐seq mean signal of RNAPII in exons (100–200 bp, scaled to 100 bins, n = 33,600) in NRPB2 WT +/+ nrpb2‐2 −/− (NRPB2 WT, blue) and NRPB2 Y732F +/+ nrpb2‐2 −/− (NRPB2 Y732F , red).
- G
Metagene profile of plaNET‐seq mean signal of RNAPII in exons (200–300 bp, scaled to 100 bins, n = 9,795) in NRPB2 WT +/+ nrpb2‐2 −/− (NRPB2 WT, blue) and NRPB2 Y732F +/+ nrpb2‐2 −/− (NRPB2 Y732F , red).
- H
Metagene profile of plaNET‐seq mean signal of RNAPII in introns (50–100 bp, scaled to 100 bins, n = 58,050) in NRPB2 WT +/+ nrpb2‐2 −/− (NRPB2 WT, blue) and NRPB2 Y732F +/+ nrpb2‐2 −/− (NRPB2 Y732F , red).
- I
Metagene profile of plaNET‐seq mean signal of RNAPII in introns (100–200 bp, scaled to 100 bins, n = 34,213) in NRPB2 WT +/+ nrpb2‐2 −/− (NRPB2 WT, blue) and NRPB2 Y732F +/+ nrpb2‐2 −/− (NRPB2 Y732F , red).
- J
Metagene profile of plaNET‐seq mean signal of RNAPII in introns (200–300 bp, scaled to 100 bins, n = 128) in NRPB2 WT +/+ nrpb2‐2 −/− (NRPB2 WT, blue) and NRPB2 Y732F +/+ nrpb2‐2 −/− (NRPB2 Y732F , red).
- K
Metagene profile of plaNET‐seq mean signal of RNAPII in constitutive exons (n = 75,136) in NRPB2 WT +/+ nrpb2‐2 −/− (NRPB2 WT, blue) and NRPB2 Y732F +/+ nrpb2‐2 −/− (NRPB2 Y732F , red).
- L
Metagene profile of plaNET‐seq mean signal of RNAPII in alternative exons (n = 724) in NRPB2 WT +/+ nrpb2‐2 −/− (NRPB2 WT, blue) and NRPB2 Y732F +/+ nrpb2‐2 −/− (NRPB2 Y732F , red).
- M
Metagene profile of plaNET‐seq mean signal of RNAPII in constitutive exons (n = 97,358) in NRPB2 WT +/+ nrpb2‐2 −/− (NRPB2 WT, blue) and NRPB2 Y732F +/+ nrpb2‐2 −/− (NRPB2 Y732F , red).
- N
Metagene profile of plaNET‐seq mean signal of RNAPII in alternative exons (n = 5,306) in NRPB2 WT +/+ nrpb2‐2 −/− (NRPB2 WT, blue) and NRPB2 Y732F +/+ nrpb2‐2 −/− (NRPB2 Y732F , red).
- A
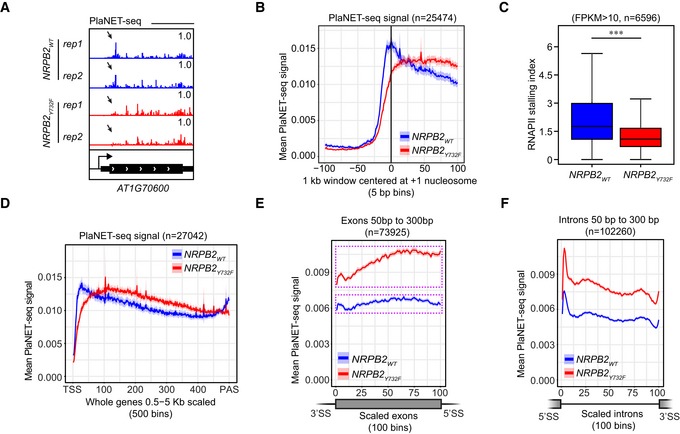
plaNET‐seq signal of RNAPII in the promoter‐proximal region of AT1G70600 in NRPB2 WT +/+ nrpb2‐2 −/− (NRPB2 WT, blue) and NRPB2 Y732F +/+ nrpb2‐2 −/− (NRPB2 Y732F , red). Arrows indicate the RNAPII signal at the region of promoter‐proximal stalling.
- B
Metagene profile of plaNET‐seq mean signal of RNAPII in a 1 kb window centered at the +1 nucleosome in Arabidopsis genes (n = 25,474) in NRPB2 WT +/+ nrpb2‐2 −/− (NRPB2 WT, blue) and NRPB2 Y732F +/+ nrpb2‐2 −/− (NRPB2 Y732F, red). The significance of differences of plaNET‐seq signal in the region from −25 bins to +25 bins around +1 nucleosome between NRPB2 WT and NRPB2 Y732F was assessed by a two‐sided Mann–Whitney U‐test, P = 5.20e‐10.
- C
RNAPII stalling index calculated for all the genes with plaNET‐seq FPKM ≥ 10 in NRPB2 WT +/+ nrpb2‐2 −/− (NRPB2 WT, blue) and NRPB2 Y732F +/+ nrpb2‐2 −/− (NRPB2 Y732F , red; n = 6,596). Medians of the stalling index are 1.891 and 1.222 for NRPB2 WT and NRPB2 Y732F, respectively. *** denotes P‐value < 0.001 by Wilcoxon signed‐rank test. The solid horizontal lines and box limits represent median, lower and upper quartiles of data values in each group. The upper and lower whiskers extend to the largest or smallest value, respectively, no further than 1.5*IQR from the relevant quartile.
- D
Metagene profile of plaNET‐seq mean signal over whole genes (length from 0.5 kb to 5 kb, scaled to 500 bins, n = 27,042) in NRPB2 WT +/+ nrpb2‐2 −/− (NRPB2 WT, blue) and NRPB2 Y732F +/+ nrpb2‐2 −/− (NRPB2 Y732F , red).
- E
Metagene profile of plaNET‐seq mean signal of RNAPII in exons (length from 50 to 300 bp, scaled to 100 bins, n = 73,925) in NRPB2 WT +/+ nrpb2‐2 −/− (NRPB2 WT, blue) and NRPB2 Y732F +/+ nrpb2‐2 −/− (NRPB2 Y732F , red). Pink dashed line rectangle illustrates the amplitude of differences between the minimum and the maximum of RNAPII signal across the exons. A two‐sided Mann–Whitney U‐test was used to assess the plaNET‐seq signal of NRPB2 WT (blue) and NRPB2 Y732F (red) in exons, P < 1e‐16.
- F
Metagene profile of plaNET‐seq mean signal of RNAPII in introns (length from 50–300 bp, scaled to 100 bins, n = 102,260) in NRPB2 WT +/+ nrpb2‐2 −/− (NRPB2 WT, blue) and NRPB2 Y732F +/+ nrpb2‐2 −/− (NRPB2 Y732F , red). A two‐sided Mann–Whitney U‐test was used to assess the plaNET‐seq signal of NRPB2 WT (blue) and NRPB2 Y732F (red) in introns, P < 1e‐16.
- A
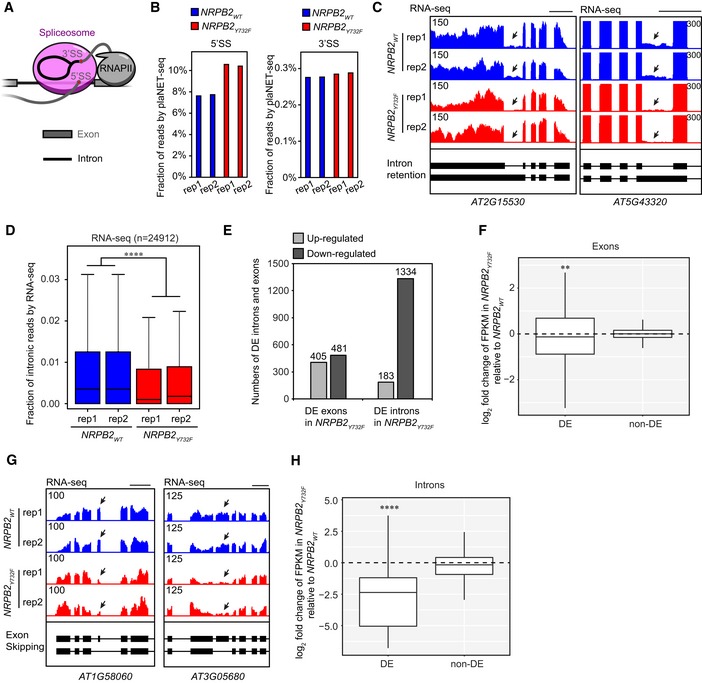
A schematic illustration of the co‐transcriptional RNAPII–spliceosome complex. plaNET‐seq mainly detects splicing intermediates corresponding to 5′ splicing site (5′SS) co‐purified with engaged RNAPII complex.
- B
Bar charts showing the fractions of 5′ and 3′ splicing intermediate reads from plaNET‐seq in NRPB2 WT +/+ nrpb2‐2 −/− (NRPB2 WT, blue) and NRPB2 Y732F +/+ nrpb2‐2 −/− (NRPB2 Y732F , red).
- C
Genome browser snapshots illustrating enhanced intron splicing in NRPB2 Y732F +/+ nrpb2‐2 −/− (NRPB2 Y732F, red) compared to NRPB2 WT +/+ nrpb2‐2 −/− (NRPB2 WT , blue). Scale bars denote 0.5 kb.
- D
The fraction of RNA‐seq intronic reads calculated for all genes (n = 24,912) in NRPB2 WT +/+ nrpb2‐2 −/− and NRPB2 Y732F +/+ nrpb2‐2 −/−. Two‐sided Mann–Whitney U‐test: **** denotes P‐value < 2.2e‐16. The solid horizontal lines and box limits represent median, lower and upper quartiles of data values in each group. The upper and lower whiskers extend to the largest or smallest value, respectively, no further than 1.5*IQR from the relevant quartile.
- E
Differentially expressed (DE) exons and introns in NRPB2 Y732F +/+ nrpb2‐2 −/− compared to NRPB2 WT +/+ nrpb2‐2 −/− based on RNA‐seq results. Numbers of DE exons and introns were shown in plot.
- F
Quantification (log2 fold change of FPKM from RNA‐seq) of differentially expressed (DE) exons and non‐DE exons in NRPB2 Y732F +/+ nrpb2‐2 −/− compared to NRPB2 WT +/+ nrpb2‐2 −/−. ** denotes P‐value < 0.01 by Wilcoxon signed‐rank test. The solid horizontal lines and box limits represent median, lower and upper quartiles of data values in each group. The upper and lower whiskers extend to the largest or smallest value, respectively, no further than 1.5*IQR from the relevant quartile.
- G
Genome browser snapshots illustrating enhanced exon skipping in NRPB2 Y732F +/+ nrpb2‐2 −/− (NRPB2 Y732F, red) compared to NRPB2 WT +/+ nrpb2‐2 −/− (NRPB2 WT , blue). Scale bars denote 0.5 kb.
- H
Quantification (log2 fold change of FPKM from RNA‐seq) of differentially expressed (DE) introns and non‐DE exons in NRPB2 Y732F +/+ nrpb2‐2 −/− compared to NRPB2 WT +/+ nrpb2‐2 −/−. **** denotes P‐value < 0.0001 by Wilcoxon signed‐rank test. The solid horizontal lines and box limits represent median, lower and upper quartiles of data values in each group. The upper and lower whiskers extend to the largest or smallest value, respectively, no further than 1.5*IQR from the relevant quartile.
- A
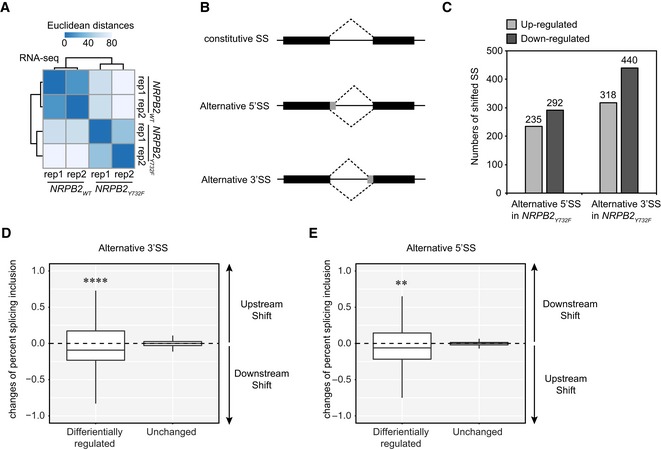
Reproducibility of RNA‐seq data demonstrated by clustered heatmap of Euclidean distances between two independent replicates of RNA‐seq in both NRPB2 WT +/+ nrpb2‐2 −/− and NRPB2 Y732F +/+ nrpb2‐2 −/−. Darker blue stands for higher reproducibility, and lighter blue represents low reproducibility.
- B
Illustration of constitutive splicing site (SS), alternative 5′ splicing site (SS), and alternative 3′ splicing site (SS).
- C
Differentially regulated alternative 5′SS and 3′SS in NRPB2 Y732F +/+ nrpb2‐2 −/− compared to NRPB2 WT +/+ nrpb2‐2 −/− based on RNA‐seq results. Numbers of up‐ and down‐regulated SS were shown on the plot.
- D
Quantification (the changes of present splicing inclusion, dPSI) of differentially regulated alternative 3′SS exons and non‐DE exons in NRPB2 Y732F +/+ nrpb2‐2 −/− compared to NRPB2 WT +/+ nrpb2‐2 −/−. dPSI > 0 and dPSI < 0 suggest upstream and downstream shift of alternative 5′SS, respectively. **** denotes P‐value < 0.0001 by Wilcoxon signed‐rank test. The solid horizontal lines and box limits represent median, lower and upper quartiles of data values in each group. The upper and lower whiskers extend to the largest or smallest value, respectively, no further than 1.5*IQR from the relevant quartile.
- E
Quantification (the changes of present splicing inclusion, dPSI) of differentially regulated alternative 5′SS exons and non‐DE exons in NRPB2 Y732F +/+ nrpb2‐2 −/− compared to NRPB2 WT +/+ nrpb2‐2 −/−. dPSI > 0 and dPSI < 0 suggest downstream and upstream shift of alternative 5′SS, respectively. ** denotes P‐value < 0.01 by Wilcoxon signed‐rank test. The solid horizontal lines and box limits represent median, lower and upper quartiles of data values in each group. The upper and lower whiskers extend to the largest or smallest value, respectively, no further than 1.5*IQR from the relevant quartile.
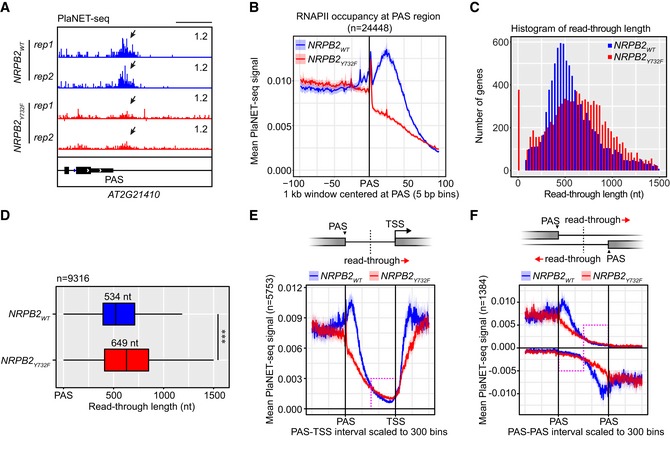
- A
plaNET‐seq signal of RNAPII at 3′ end of AT2G21410 in NRPB2 WT +/+ nrpb2‐2 −/− (NRPB2 WT, blue) and NRPB2 Y732F +/+ nrpb2‐2 −/− (NRPB2 Y732F , red). Arrows indicate the RNAPII signal peaks at PAS‐stalling region.
- B
Metagene profile of plaNET‐seq mean signal of RNAPII in a 1 kb window centered at PAS (n = 24,448) in NRPB2 WT +/+ nrpb2‐2 −/− (NRPB2 WT, blue) and NRPB2 Y732F +/+ nrpb2‐2 −/− (NRPB2 Y732F , red). The significance of differences of plaNET‐seq signal in the region from PAS to +100 bins between NRPB2 WT and NRPB2 Y732F was assessed by two‐sided Mann–Whitney U‐test, P = 1.53e‐06.
- C
Histogram of transcriptional read‐through length (nt) from PAS of protein‐coding gene (plaNET‐seq FPKM > 5, n = 9,316) in NRPB2 WT +/+ nrpb2‐2 −/− (NRPB2 WT, blue) and NRPB2 Y732F +/+ nrpb2‐2 −/− (NRPB2 Y732F , red).
- D
Box plot shows the RNAPII transcriptional read‐through length from PAS of protein‐coding genes (plaNET‐seq, FPKM > 5, n = 9,316) called based on statistical model (see Materials and Methods) in NRPB2 WT +/+ nrpb2‐2 −/− (NRPB2 WT, blue) and NRPB2 Y732F +/+ nrpb2‐2 −/− (NRPB2 Y732F , red). Medians of read‐through length in NRPB2 WT and NRPB2 Y732F mutant are 534 and 649 nt. Two‐sided Mann–Whitney U‐test: *** denotes P = 9.9e‐62. The solid horizontal lines and box limits represent median, lower and upper quartiles of data values in each group. The upper and lower whiskers extend to the largest or smallest value, respectively, no further than 1.5*IQR from the relevant quartile.
- E
Metagene plot of RNAPII signal by plaNET‐seq anchored at both PAS of upstream genes and TSS of downstream genes for tandemly oriented genes (n = 5,753) in NRPB2 WT +/+ nrpb2‐2 −/− (NRPB2 WT, blue) and NRPB2 Y732F +/+ nrpb2‐2 −/− (NRPB2 Y732F , red). Red arrow denotes the direction of transcriptional read‐through. Pink dashed line rectangle indicates the region corresponding to the second half of PAS‐TSS gaps along 5′–3′ direction.
- F
Metagene plot of RNAPII signal by plaNET‐seq anchored at PASs of both upstream genes and downstream genes for gene pairs located in “tail‐to‐tail” orientation (n = 1,384) in NRPB2 WT +/+ nrpb2‐2 −/− (NRPB2 WT, blue) and NRPB2 Y732F +/+ nrpb2‐2 −/− (NRPB2 Y732F , red). Red arrows denote the directions of transcriptional read‐through from both PASs. Pink dashed line rectangles indicate the region corresponding to the second half of PAS‐TSS gaps along 5′–3′ direction.
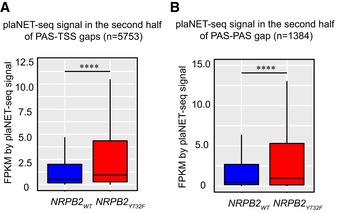
- A
Box plot showing the comparison of plaNET‐seq signal of NRPB2 WT (blue) and NRPB2 Y732F (red) in the region corresponding to the second half of PAS‐TSS gaps (n = 5,753) between tandemly oriented genes. Mann–Whitney test, **** denotes P = 1.70e‐43. The solid horizontal lines and box limits represent median, lower and upper quartiles of data values in each group. The upper and lower whiskers extend to the largest or smallest value, respectively, no further than 1.5*IQR from the relevant quartile.
- B
Box plot showing the comparison of plaNET‐seq signal of NRPB2 WT (blue) and NRPB2 Y732F (red) in the region corresponding to the second half of PAS‐PAS gaps (n = 1,384) between genes located in “tail‐to‐tail” orientation. Mann–Whitney test, **** denotes P = 7.10e‐14. The solid horizontal lines and box limits represent median, lower and upper quartiles of data values in each group. The upper and lower whiskers extend to the largest or smallest value, respectively, no further than 1.5*IQR from the relevant quartile.
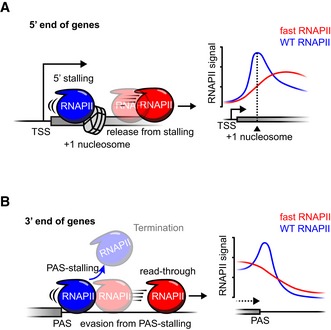
- A
A schematic illustrating the effect of transcription speed on RNAPII stalling at promoter‐proximal regions. Accelerated RNAPII is prone to move out of stalling regions (centered at the position of the +1 nucleosome) at 5′ end of genes, resulting in reduced promoter‐proximal stalling peaks in RNAPII profile by plaNET‐seq.
- B
A schematic illustration showing that accelerated RNAPII tends to evade from RNAPII stalling near gene poly‐(A) sites (PAS). This leads to less efficient transcription termination and extended transcription read‐through, reflected by the absence of RNAPII signal peaks downstream of PAS and elevated signal downstream of PAS‐stalling region by plaNET‐seq.
Similar articles
-
Native elongation transcript sequencing reveals temperature dependent dynamics of nascent RNAPII transcription in Arabidopsis.Nucleic Acids Res. 2020 Mar 18;48(5):2332-2347. doi: 10.1093/nar/gkz1189. Nucleic Acids Res. 2020. PMID: 31863587 Free PMC article.
-
Abundance and distribution of RNA polymerase II in Arabidopsis interphase nuclei.J Exp Bot. 2015 Mar;66(6):1687-98. doi: 10.1093/jxb/erv091. Epub 2015 Mar 4. J Exp Bot. 2015. PMID: 25740920 Free PMC article.
-
Transcription-driven chromatin repression of Intragenic transcription start sites.PLoS Genet. 2019 Feb 1;15(2):e1007969. doi: 10.1371/journal.pgen.1007969. eCollection 2019 Feb. PLoS Genet. 2019. PMID: 30707695 Free PMC article.
-
A G(enomic)P(ositioning)S(ystem) for Plant RNAPII Transcription.Trends Plant Sci. 2020 Aug;25(8):744-764. doi: 10.1016/j.tplants.2020.03.005. Epub 2020 Apr 11. Trends Plant Sci. 2020. PMID: 32673579 Review.
-
Emerging roles for RNA polymerase II CTD in Arabidopsis.Trends Plant Sci. 2013 Nov;18(11):633-43. doi: 10.1016/j.tplants.2013.07.001. Epub 2013 Jul 30. Trends Plant Sci. 2013. PMID: 23910452 Review.
Cited by
-
RNA Polymerase II Activity Control of Gene Expression and Involvement in Disease.J Mol Biol. 2025 Jan 1;437(1):168770. doi: 10.1016/j.jmb.2024.168770. Epub 2024 Aug 28. J Mol Biol. 2025. PMID: 39214283 Free PMC article. Review.
-
Unique and contrasting effects of light and temperature cues on plant transcriptional programs.Transcription. 2020 Jun-Aug;11(3-4):134-159. doi: 10.1080/21541264.2020.1820299. Epub 2020 Oct 4. Transcription. 2020. PMID: 33016207 Free PMC article. Review.
-
Cotranscriptional RNA processing and modification in plants.Plant Cell. 2023 May 29;35(6):1654-1670. doi: 10.1093/plcell/koac309. Plant Cell. 2023. PMID: 36259932 Free PMC article. Review.
-
Unique features of transcription termination and initiation at closely spaced tandem human genes.Mol Syst Biol. 2022 Apr;18(4):e10682. doi: 10.15252/msb.202110682. Mol Syst Biol. 2022. PMID: 35362230 Free PMC article.
-
First Come, First Served: Sui Generis Features of the First Intron.Plants (Basel). 2020 Jul 19;9(7):911. doi: 10.3390/plants9070911. Plants (Basel). 2020. PMID: 32707681 Free PMC article. Review.
References
Publication types
MeSH terms
Substances
Associated data
- Actions
Grants and funding
LinkOut - more resources
Full Text Sources
Molecular Biology Databases
