Review
. 2020 Feb 27;18(1):21.
doi: 10.1186/s12915-020-0753-2.

X-ray computed tomography in life sciences

Affiliations
Review

X-ray computed tomography in life sciences

Shelley D Rawson et al. BMC Biol. .

Abstract

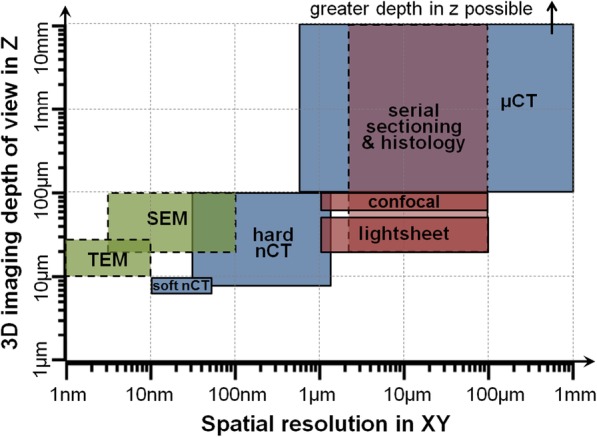
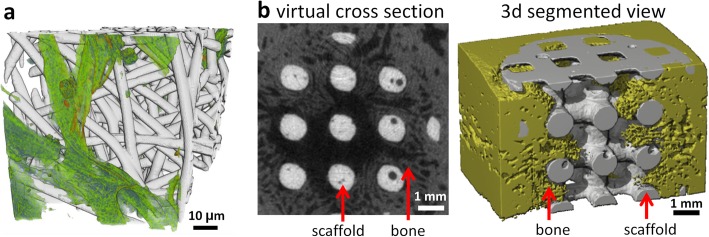
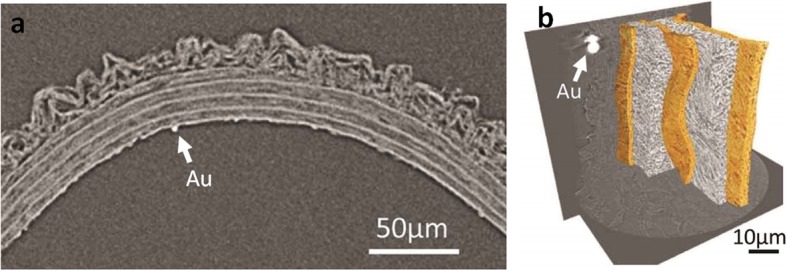
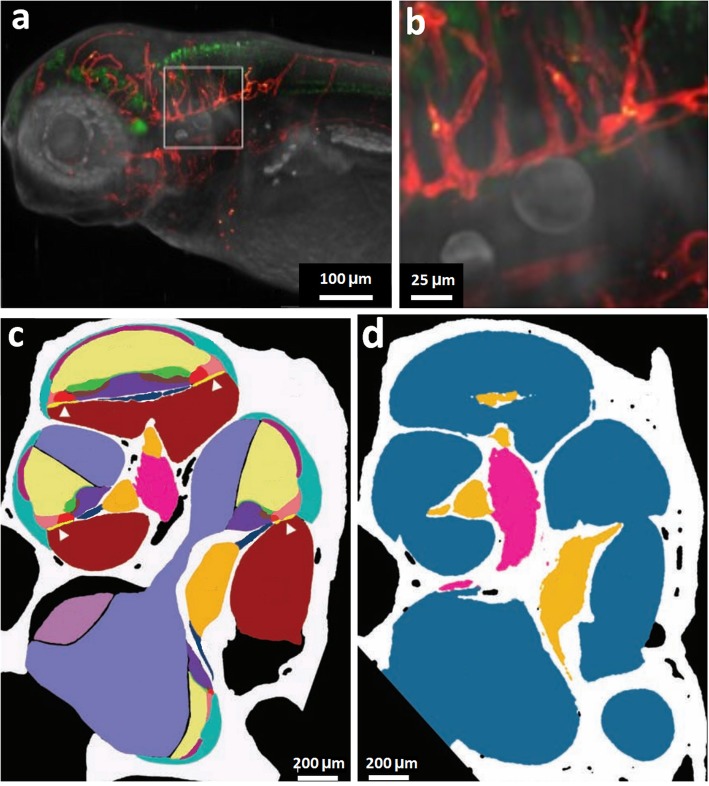
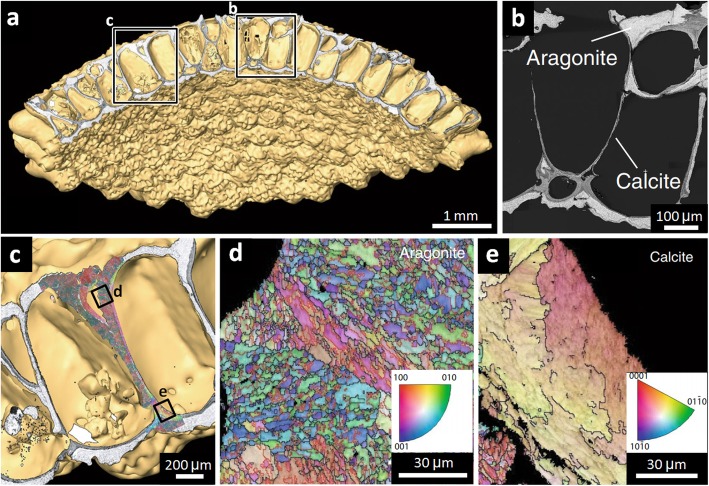
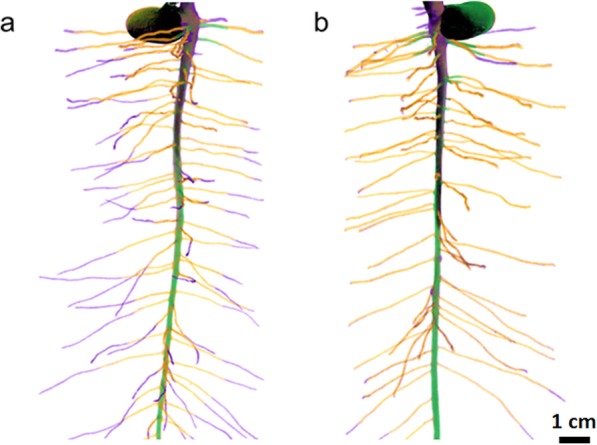
Recent developments within micro-computed tomography (μCT) imaging have combined to extend our capacity to image tissue in three (3D) and four (4D) dimensions at micron and sub-micron spatial resolutions, opening the way for virtual histology, live cell imaging, subcellular imaging and correlative microscopy. Pivotal to this has been the development of methods to extend the contrast achievable for soft tissue. Herein, we review the new capabilities within the field of life sciences imaging, and consider how future developments in this field could further benefit the life sciences community.

Keywords: 3D histology; 3D imaging; Correlative microscopy; Elemental mapping; Lightsheet; Phase contrast; Quantitative tomography; Time-lapse tomography; Water window; X-ray computed tomography.


Conflict of interest statement

The authors declare that they have no competing interests.

Figures

Fig. 1
Fig. 1
3D imaging techniques for life sciences applications, shown according to their spatial resolution (in XY) and the full depth (in Z) of the volume that can be imaged (accumulated over many serial sections for destructive methods). Blue = CT techniques, green = electron microscopy techniques, pink = light microscopy techniques. Solid line = non-invasive, dashed line = destructive. TEM serial section transmission electron microscopy, SEM serial section scanning electron microscopy, Soft nCT soft nano-computed tomography, Hard nCT hard nano-computed tomography, μCT micro-computed tomography. Data from [–5]
Fig. 2
Fig. 2
μCT imaging of Biomphalaria glabrata snail shell. a First use of μCT imaging, at a voxel (3D pixel) size of 12 μm, reproduced with permission from [6]. b Synchrotron μCT imaging showing the latero-frontal view of a 4-week-old snail at a voxel size of 6.2 μm with a virtual section in the median plane. Image in b reproduced from [7], Marxen JC, Prymark O, Beckmann F, Neues F, Epple M. Embryonic shell formation in the snail Biomphalaria glabrata: A comparison between scanning electron microscopy (SEM) and synchrotron radiation micro computer tomography (SRμCT). Journal of Molluscan Studies. 200,874(1);19–26, by permission of Oxford University Press
Fig. 3
Fig. 3
Optimising X-ray contrast. a A comparison of conventional attenuation (absorption) contrast and phase contrast radiographs of a rat, reproduced with permission from [27]. b CT section of an alligator head before and after 2 weeks of iodine staining, reproduced with permission from [28]. In a the conventional radiograph reveals the bone structure but not the soft tissue, whereas under grating-based phase contrast the soft tissues, including trachea and lungs, are well defined, the bones less so; in b only the bones are clear in the unstained sample, whereas staining reveals the soft tissues
Fig. 4
Fig. 4
Emerging techniques for enhancing contrast in soft tissues. a Gold nanoparticle labelling; 3D segmented image showing clusters of gold nanoparticle labelled cells within a mouse (cells are yellow, circled with red dotted line) [59]. b Water window imaging showing a soft nCT section through a diploid yeast cell, the reconstructed CT volume alongside 3D representations of individual organelles and the composite image overlaying all organelles, reproduced with permission from [60]. c Correlative water window imaging with cryo-fluorescent microscopy; reconstructed soft X-ray tomograph of a mouse lymphoblastoid cell and overlaid cryo-fluorescence, soft X-ray tomograph alone and an expanded 3D segmented view of a mitochondrion and endoplasmic reticulum from within the cell [61]. d Dual energy CT; feline skin double stained with phosphotungstic acid, which preferentially stains collagen and other connective tissue (corium), and iodine potassium iodide, which stains adipose tissue (subcutaneous fat), imaged at (left) 40 kV and (middle) 80 kV, the former being more sensitive to PTA, (right) decomposition of the two contributions (right) to show adipose (yellow) and collagenous (pink) tissues, reproduced with permission from [62] Image in a reprinted from [59], Nanomedicine, 10(8), Astolfo A, Qie F, Kibleur A, Hao X, Menk RH, Arfelli F, et al. A simple way to track single gold-loaded alginate microcapsules using x-ray CT in small animal longitudinal studies, p.1821–8, 2014, with permission from Elsevier. Image in c reproduced with permission from [61], Journal of Cell Science: Elgass KD, Smith EA, LeGros MA, Larabell CA, Ryan MT. J Cell Sci, 2015;128(15):2795–804
Fig. 5
Fig. 5
Imaging of cells and tissues on biomaterial scaffolds. a Segmented 3D nCT reconstruction of human fibroblast cells (green) on a poly (lactide-co-glycolide) (PLGA) fibre scaffold (grey), reproduced with permission from [22]. b Virtual cross-section (left) alongside a 3D segmented μCT reconstruction (right) showing bone in-growth on a hydroxyapatite scaffold after 6 weeks implantation within a critical size defect of a Yucatan minipig mandible [77] Image in b reprinted from [77], Biomaterials, 28(15), van Lenthe GH, Hagenmuller H, Bohner M, Hollister SJ, Meinel L, Muller R. Nondestructive micro-computed tomography for biological imaging and quantification of scaffold-bone interaction in vivo, p.2479–90, 2007, with permission from Elsevier
Fig. 6
Fig. 6
Gold fiducial marker (Au) in a rat aorta, allowing co-registry of multi-scale CT imaging, reproduced with permission from [34]. a Virtual cross-section through μCT data at a spatial resolution of 0.7 μm. b Segmented reconstruction of nCT data at 150 nm spatial resolution
Fig. 7
Fig. 7
LSFM with complementary μCT and visible light tomography. a, b Zebrafish (lateral view) imaged using correlative LSF and visible light tomography, showing a head of the zebrafish and b larger view to show detail. Red = vasculature, green = nervous system [89]. c, d Cross-section through the segmented reconstruction of the midmodiolar section of the mouse right ear, imaged using c LSFM and d μCT. From the LSFM data, 15 tissue types can be identified: bone (white), spiral ligament (turquoise), saccule (pale purple), stria vascularis (dark purple), tectorial membrane (green), scala media (cream), basilar membrane (yellow with white arrowhead), Rosenthal’s canal (orange), Claudius cells (pale pink), modiolus (bright pink), organ of Corti (bright red), scala tympani (dark red), scala vestibuli (pale blue), spiral limbus (mid-blue), osseous spiral lamina (dark blue). From the μCT data, four tissue types can be identified: bone (white), cochlea scalae and vestibular labyrinth (blue), Rosenthal’s canal (orange) and modiolus (pink) [90] Images in a and b reproduced with permission from [89], Development: Bassi A, Schmid B, Huisken J, Development, 2015, 142(5):1016–20. Images in c and d reproduced with permission from [90]
Fig. 8
Fig. 8
Correlative microscopy of the anoteropora latirostris (saltwater invertebrate) colony, reproduced with permission from [95]. a CT of the colony. b Backscattered electron imaging showing aragonite and calcite regions. c Electron backscatter diffraction overlaid onto CT volume data. d, e High-resolution electron backscatter diffraction data, showing crystallographic grain structure in the d aragonite and e calcite regions
Fig. 9
Fig. 9
Time-lapse imaging of a fava bean root showing impaired growth with increased imaging rate, reproduced with permission from [99]. a Imaged every 2 days. b Imaged every 4 days. Colour represents number of days after planting: black = 4, green = 8, orange = 12 and purple = 16

Similar articles

Cited by

References

    1. Smith D, Starborg T. Serial block face scanning electron microscopy in cell biology: applications and technology. Tissue Cell. 2018;57:111–122. doi: 10.1016/j.tice.2018.08.011. - DOI - PubMed
    1. Shearer T, Bradley RS, Hidalgo-Bastida LA, Sherratt MJ, Cartmell SH. Three-dimensional visualisation of soft biological structures by X-ray computed micro-tomography. J Cell Sci. 2016;129(13):2483–2492. doi: 10.1242/jcs.179077. - DOI - PubMed
    1. Burnett TL, Kelley R, Winiarski B, Contreras L, Daly M, Gholinia A, et al. Large volume serial section tomography by Xe plasma FIB dual beam microscopy. Ultramicroscopy. 2016;161:119–129. doi: 10.1016/j.ultramic.2015.11.001. - DOI - PubMed
    1. McDermott G, Le Gros MA, Knoechel CG, Uchida M, Larabell CA. Soft X-ray tomography and cryogenic light microscopy: the cool combination in cellular imaging. Trends Cell Biol. 2009;19(11):587–595. doi: 10.1016/j.tcb.2009.08.005. - DOI - PMC - PubMed
    1. Truong TV, Supatto W, Koos DS, Choi JM, Fraser SE. Deep and fast live imaging with two-photon scanned light-sheet microscopy. Nat Methods. 2011;8(9):757–760. doi: 10.1038/nmeth.1652. - DOI - PubMed

Publication types