. 2020 Apr 9;17(2):026023.
doi: 10.1088/1741-2552/ab7a4f.

Signal recovery from stimulation artifacts in intracranial recordings with dictionary learning

Affiliations

Signal recovery from stimulation artifacts in intracranial recordings with dictionary learning

D J Caldwell et al. J Neural Eng. .

Abstract

Objective: Electrical stimulation of the human brain is commonly used for eliciting and inhibiting neural activity for clinical diagnostics, modifying abnormal neural circuit function for therapeutics, and interrogating cortical connectivity. However, recording electrical signals with concurrent stimulation results in dominant electrical artifacts that mask the neural signals of interest. Here we develop a method to reproducibly and robustly recover neural activity during concurrent stimulation. We concentrate on signal recovery across an array of electrodes without channel-wise fine-tuning of the algorithm. Our goal includes signal recovery with trains of stimulation pulses, since repeated, high-frequency pulses are often required to induce desired effects in both therapeutic and research domains. We have made all of our code and data publicly available.

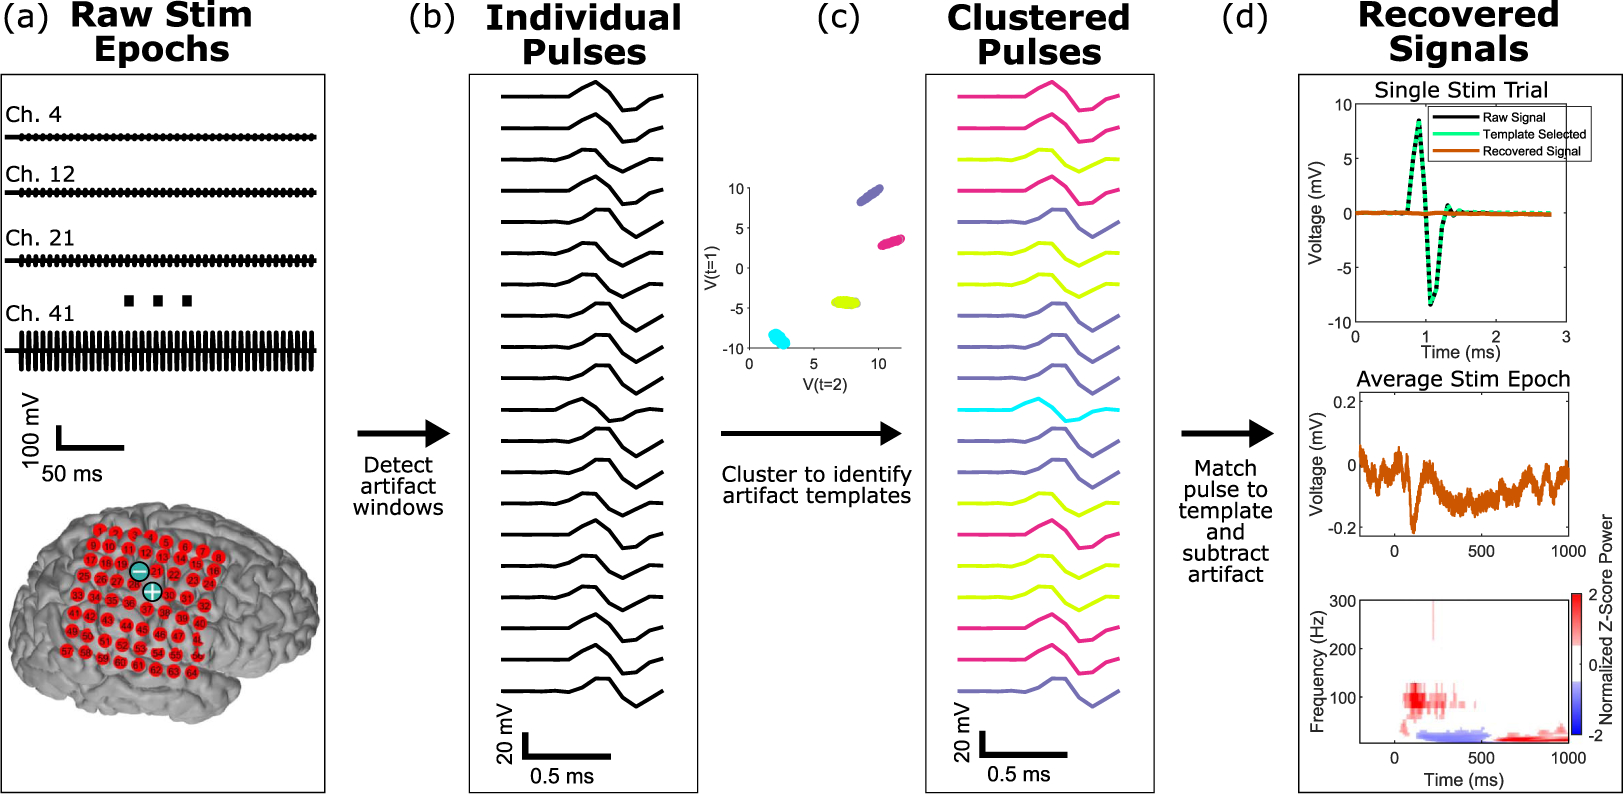
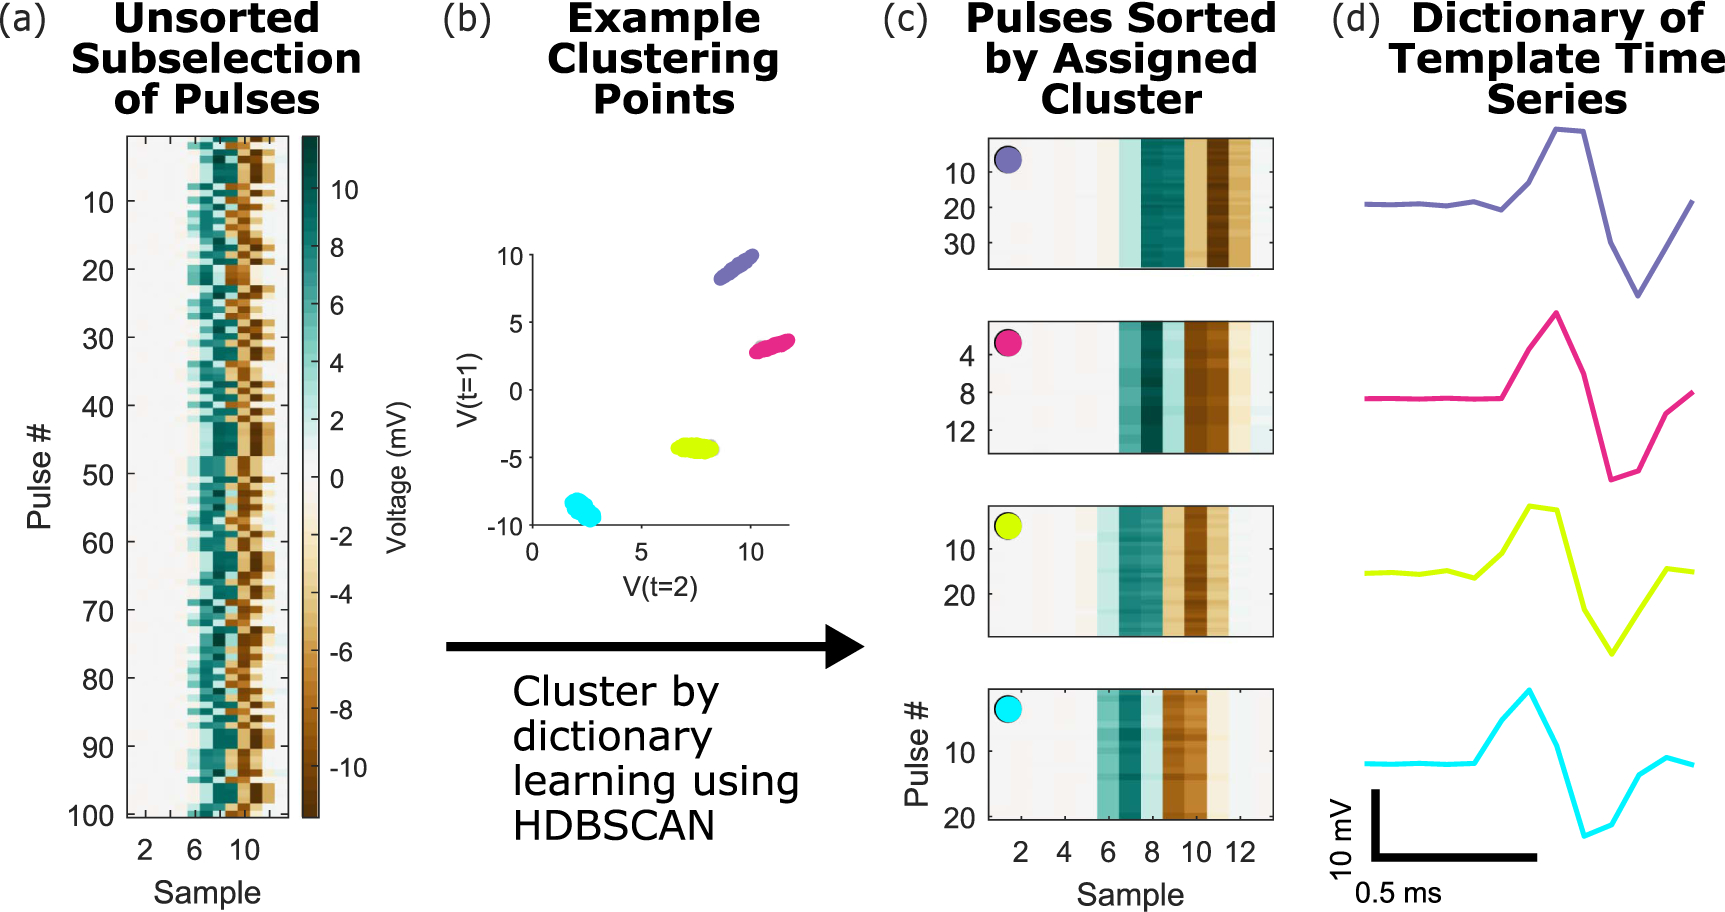
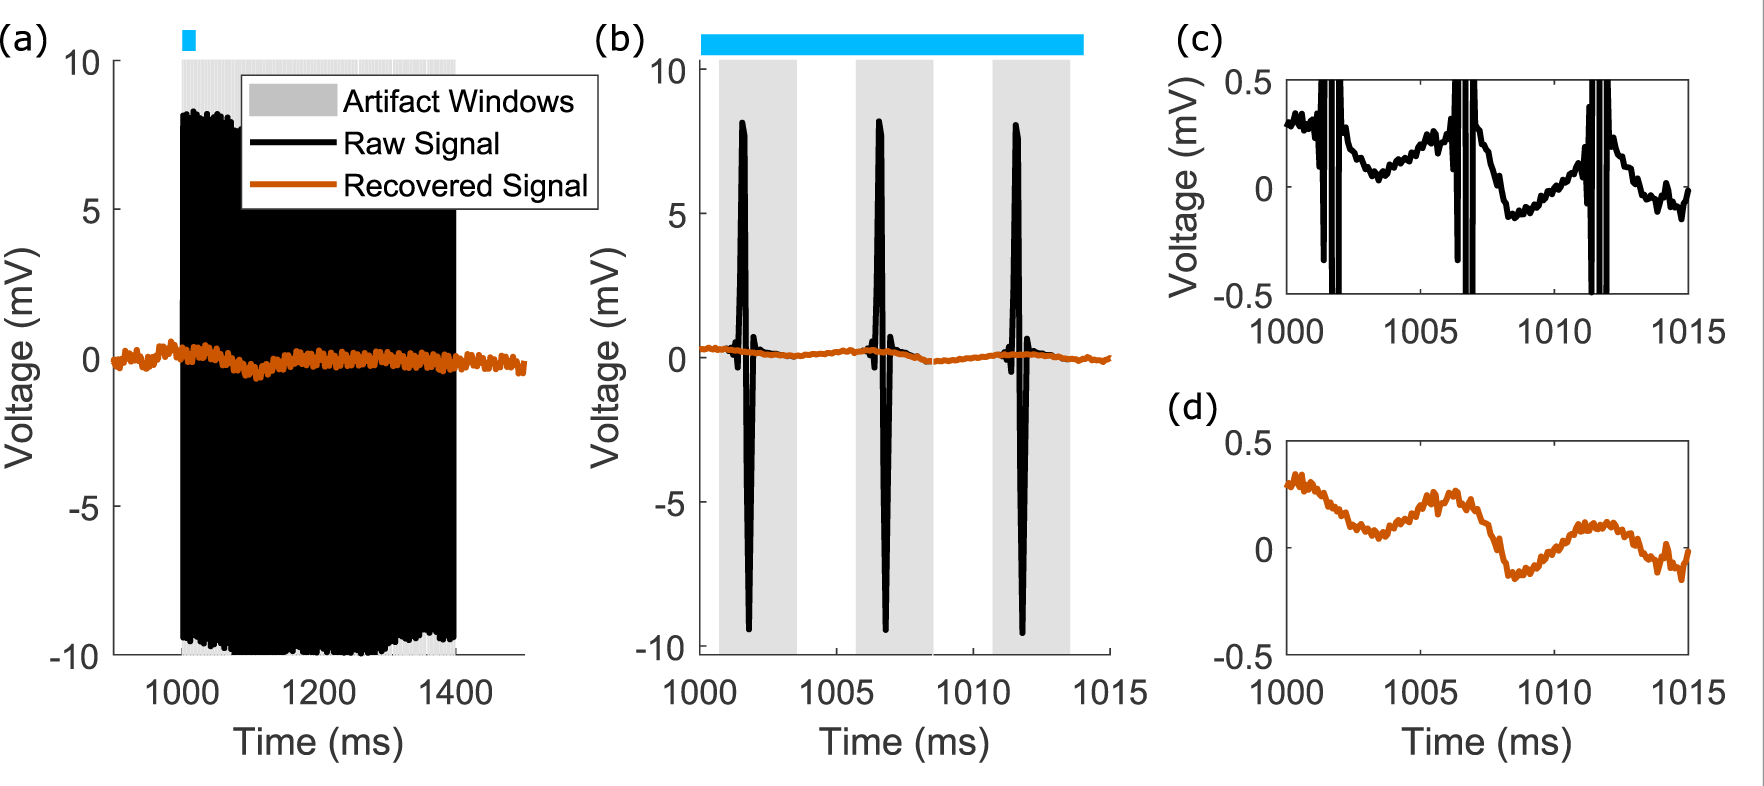
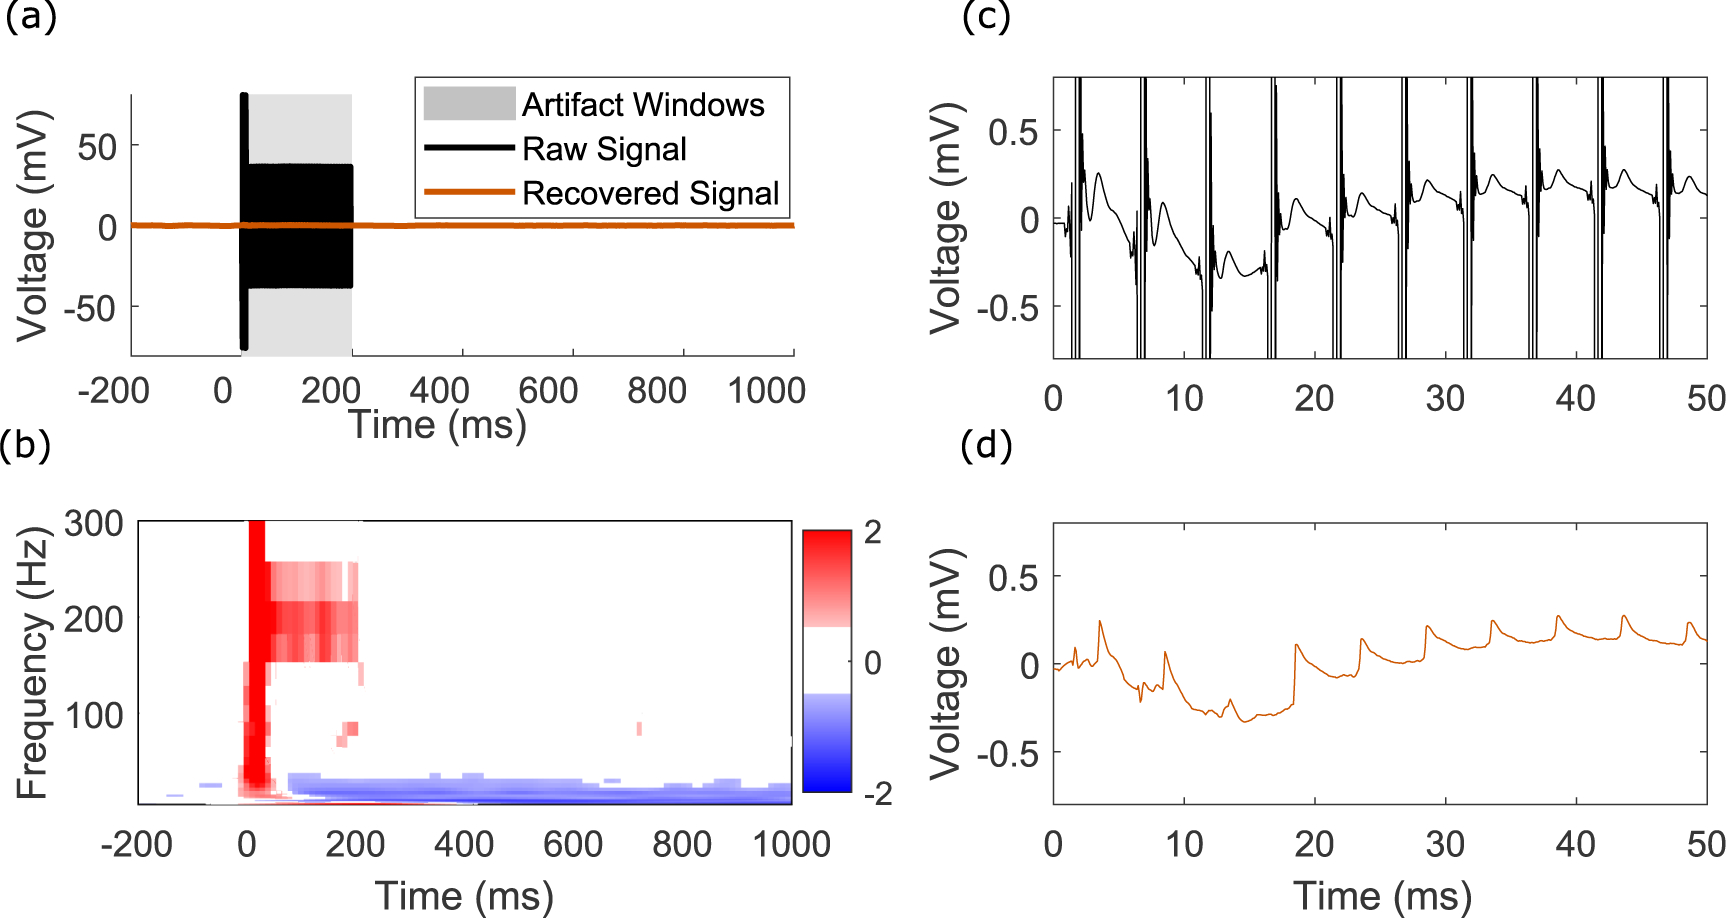
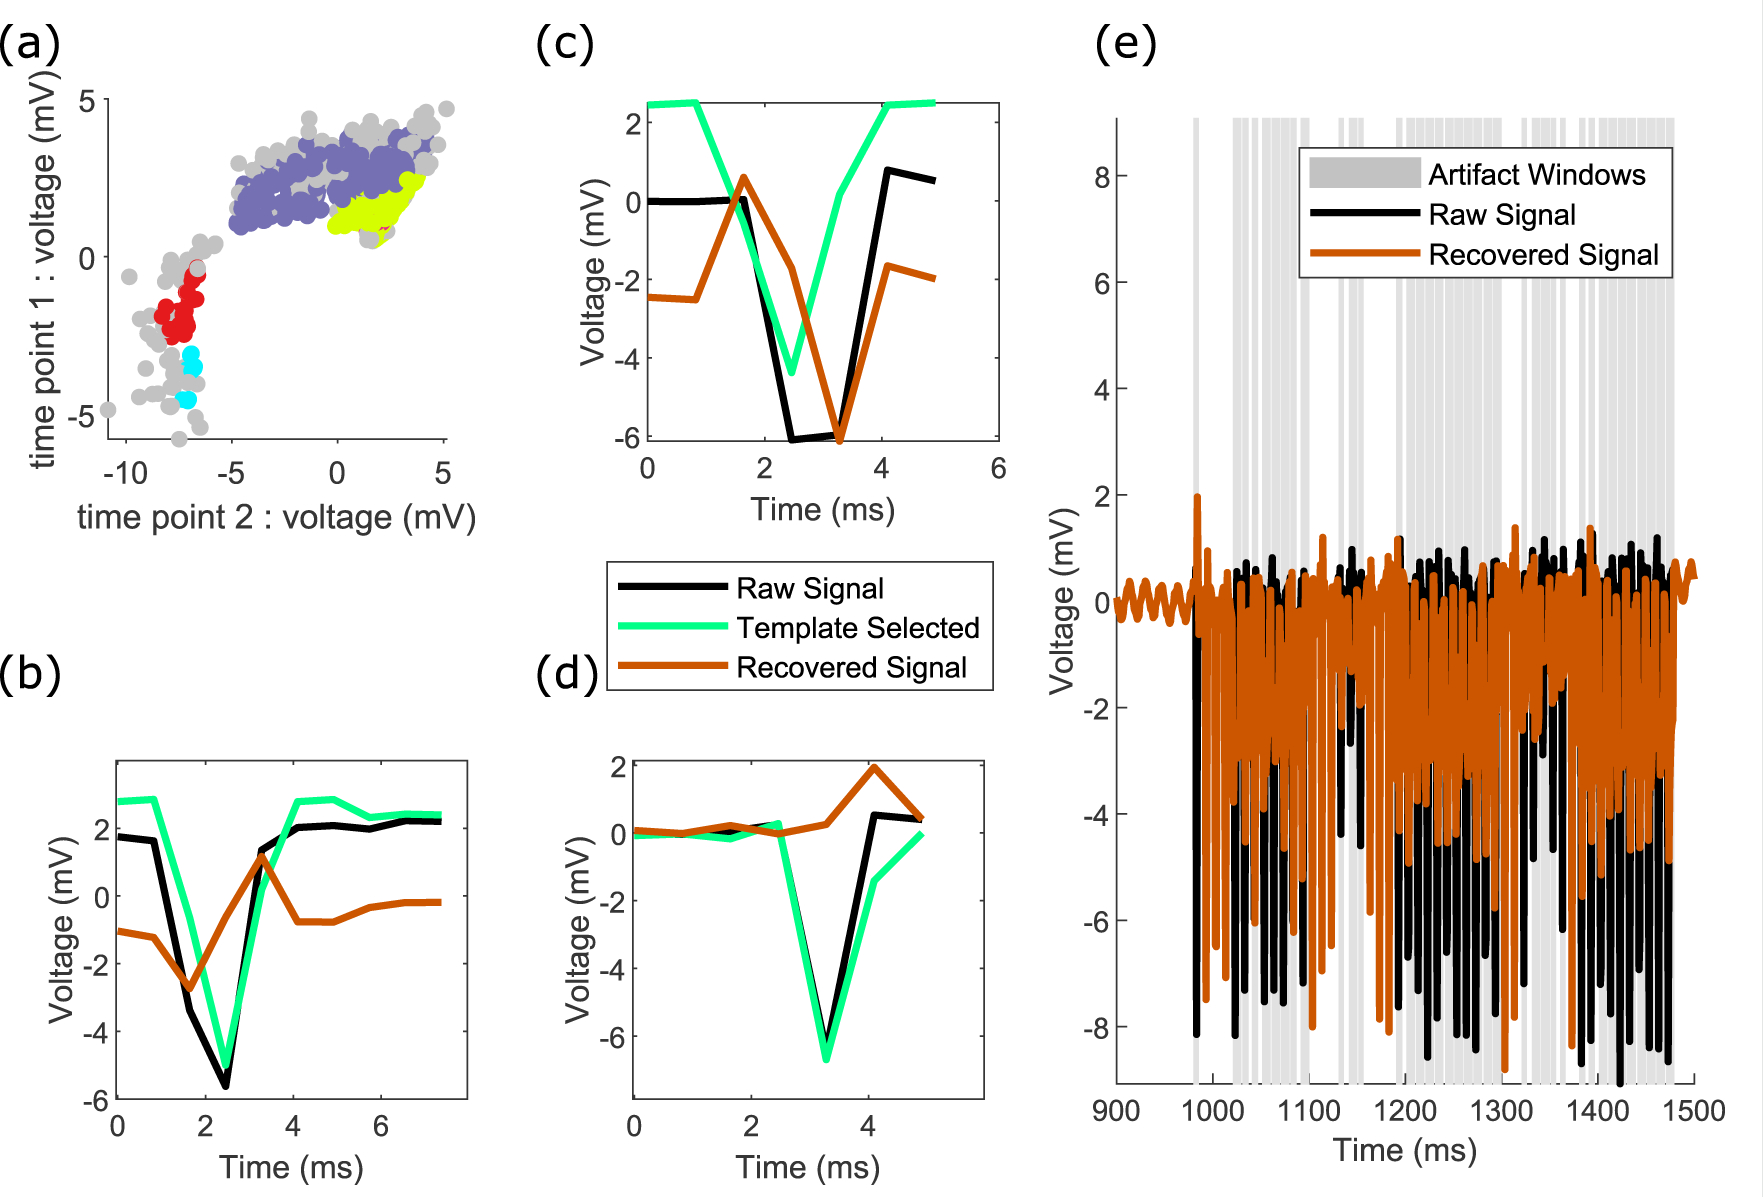
Approach: We developed an algorithm that automatically detects templates of artifacts across many channels of recording, creating a dictionary of learned templates using unsupervised clustering. The artifact template that best matches each individual artifact pulse is subtracted to recover the underlying activity. To assess the success of our method, we focus on whether it extracts physiologically interpretable signals from real recordings.

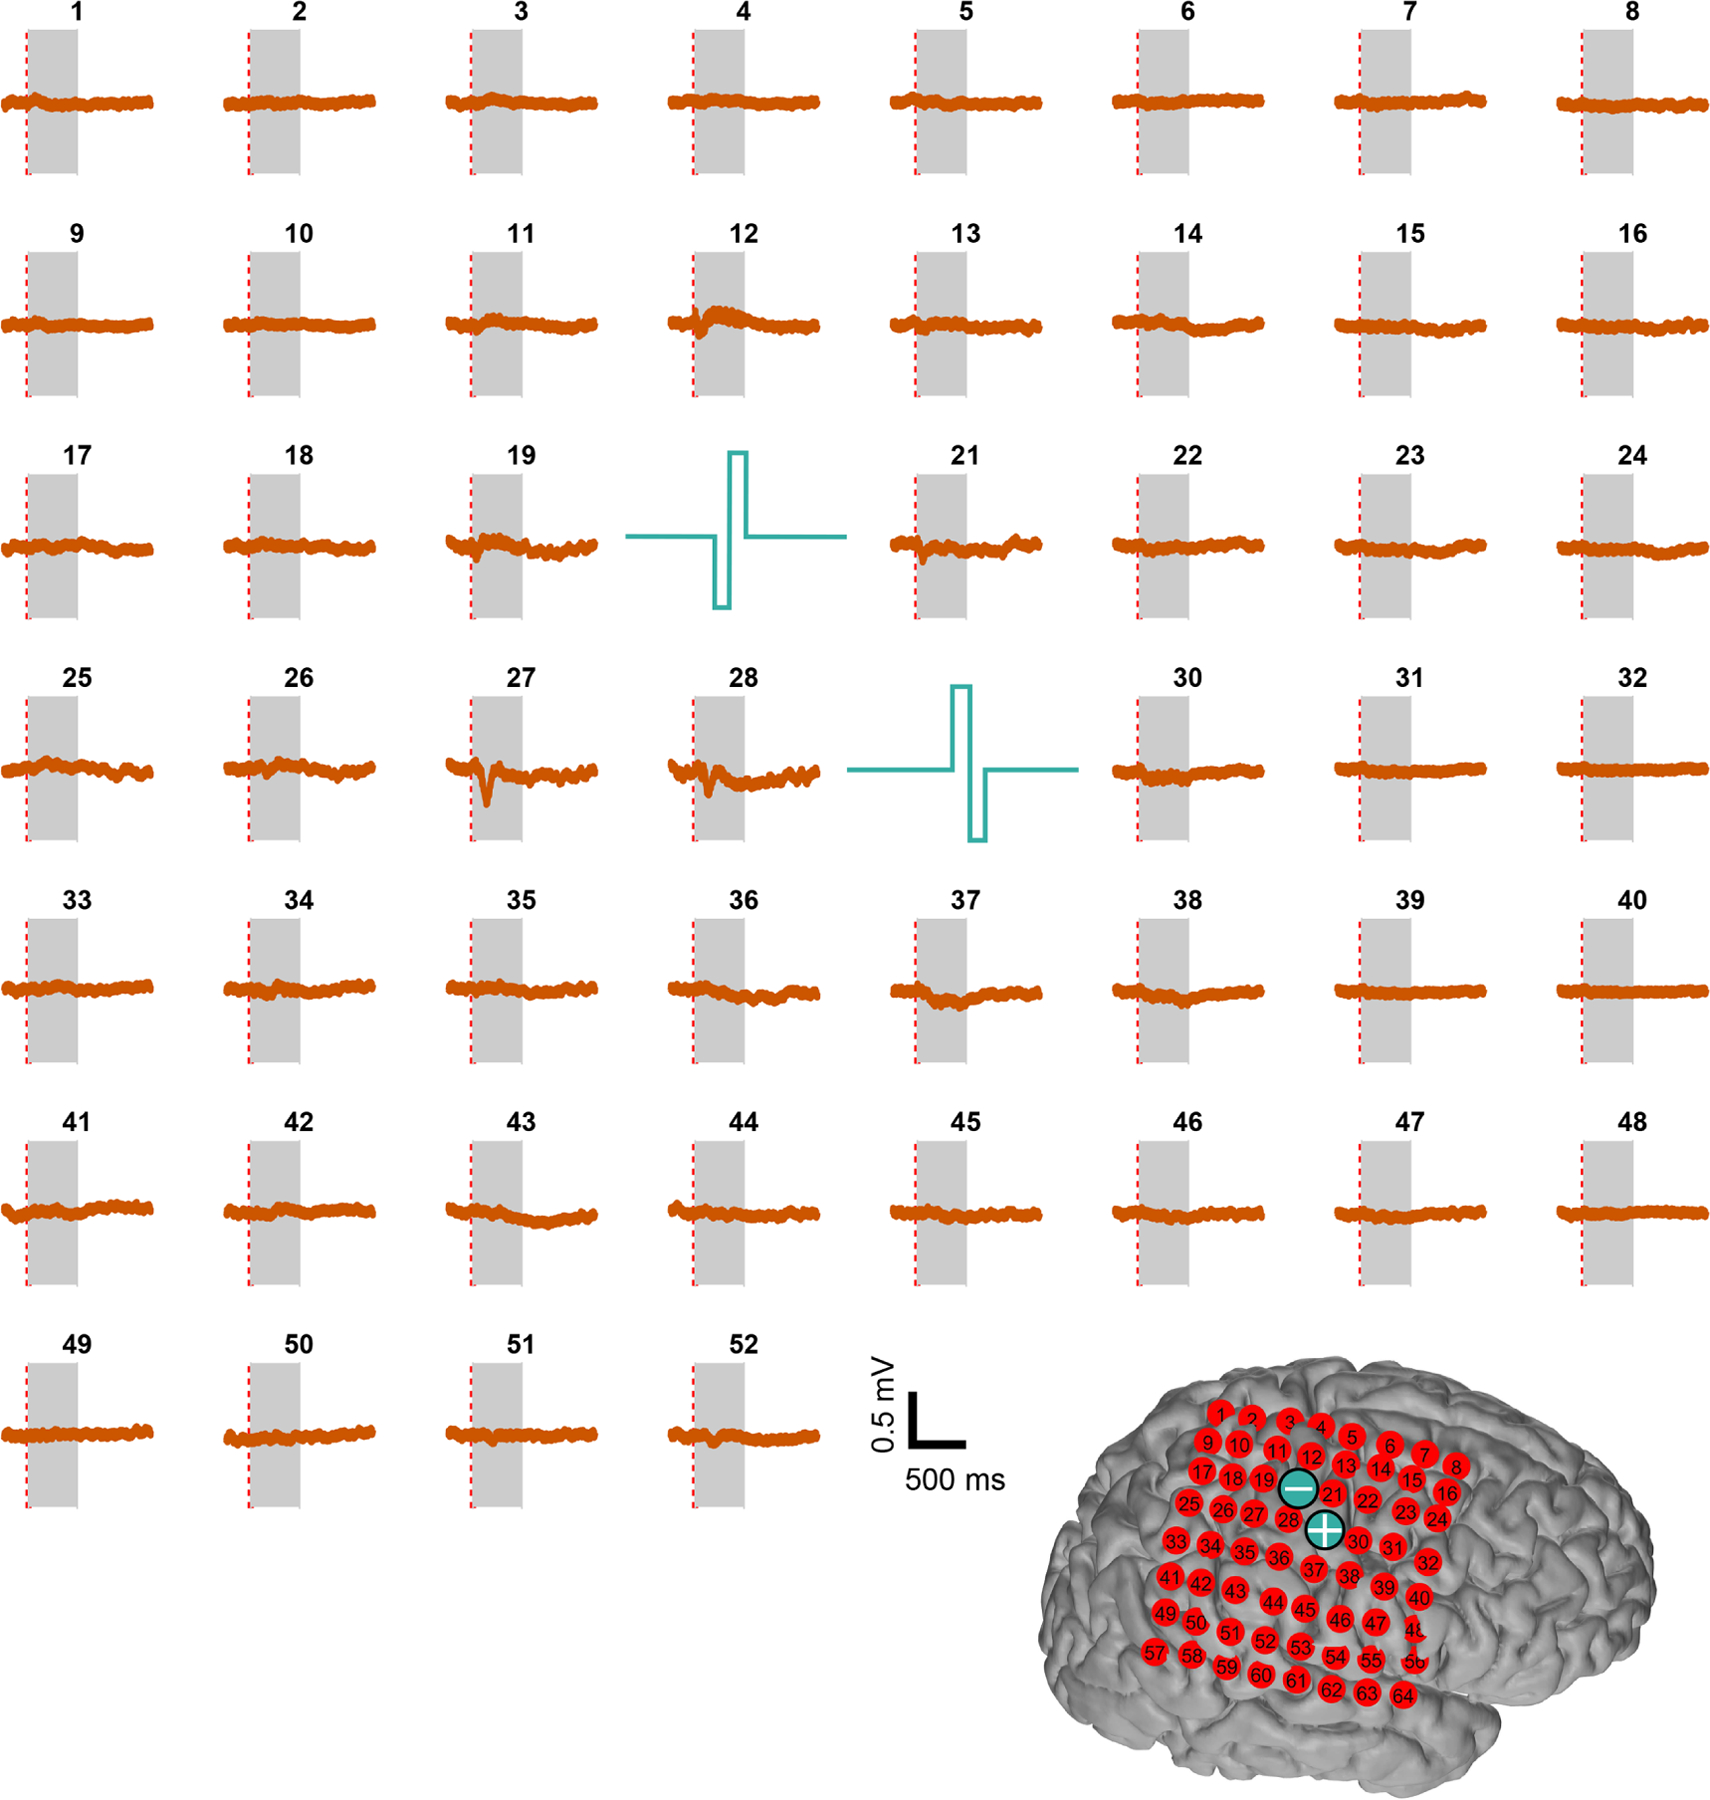
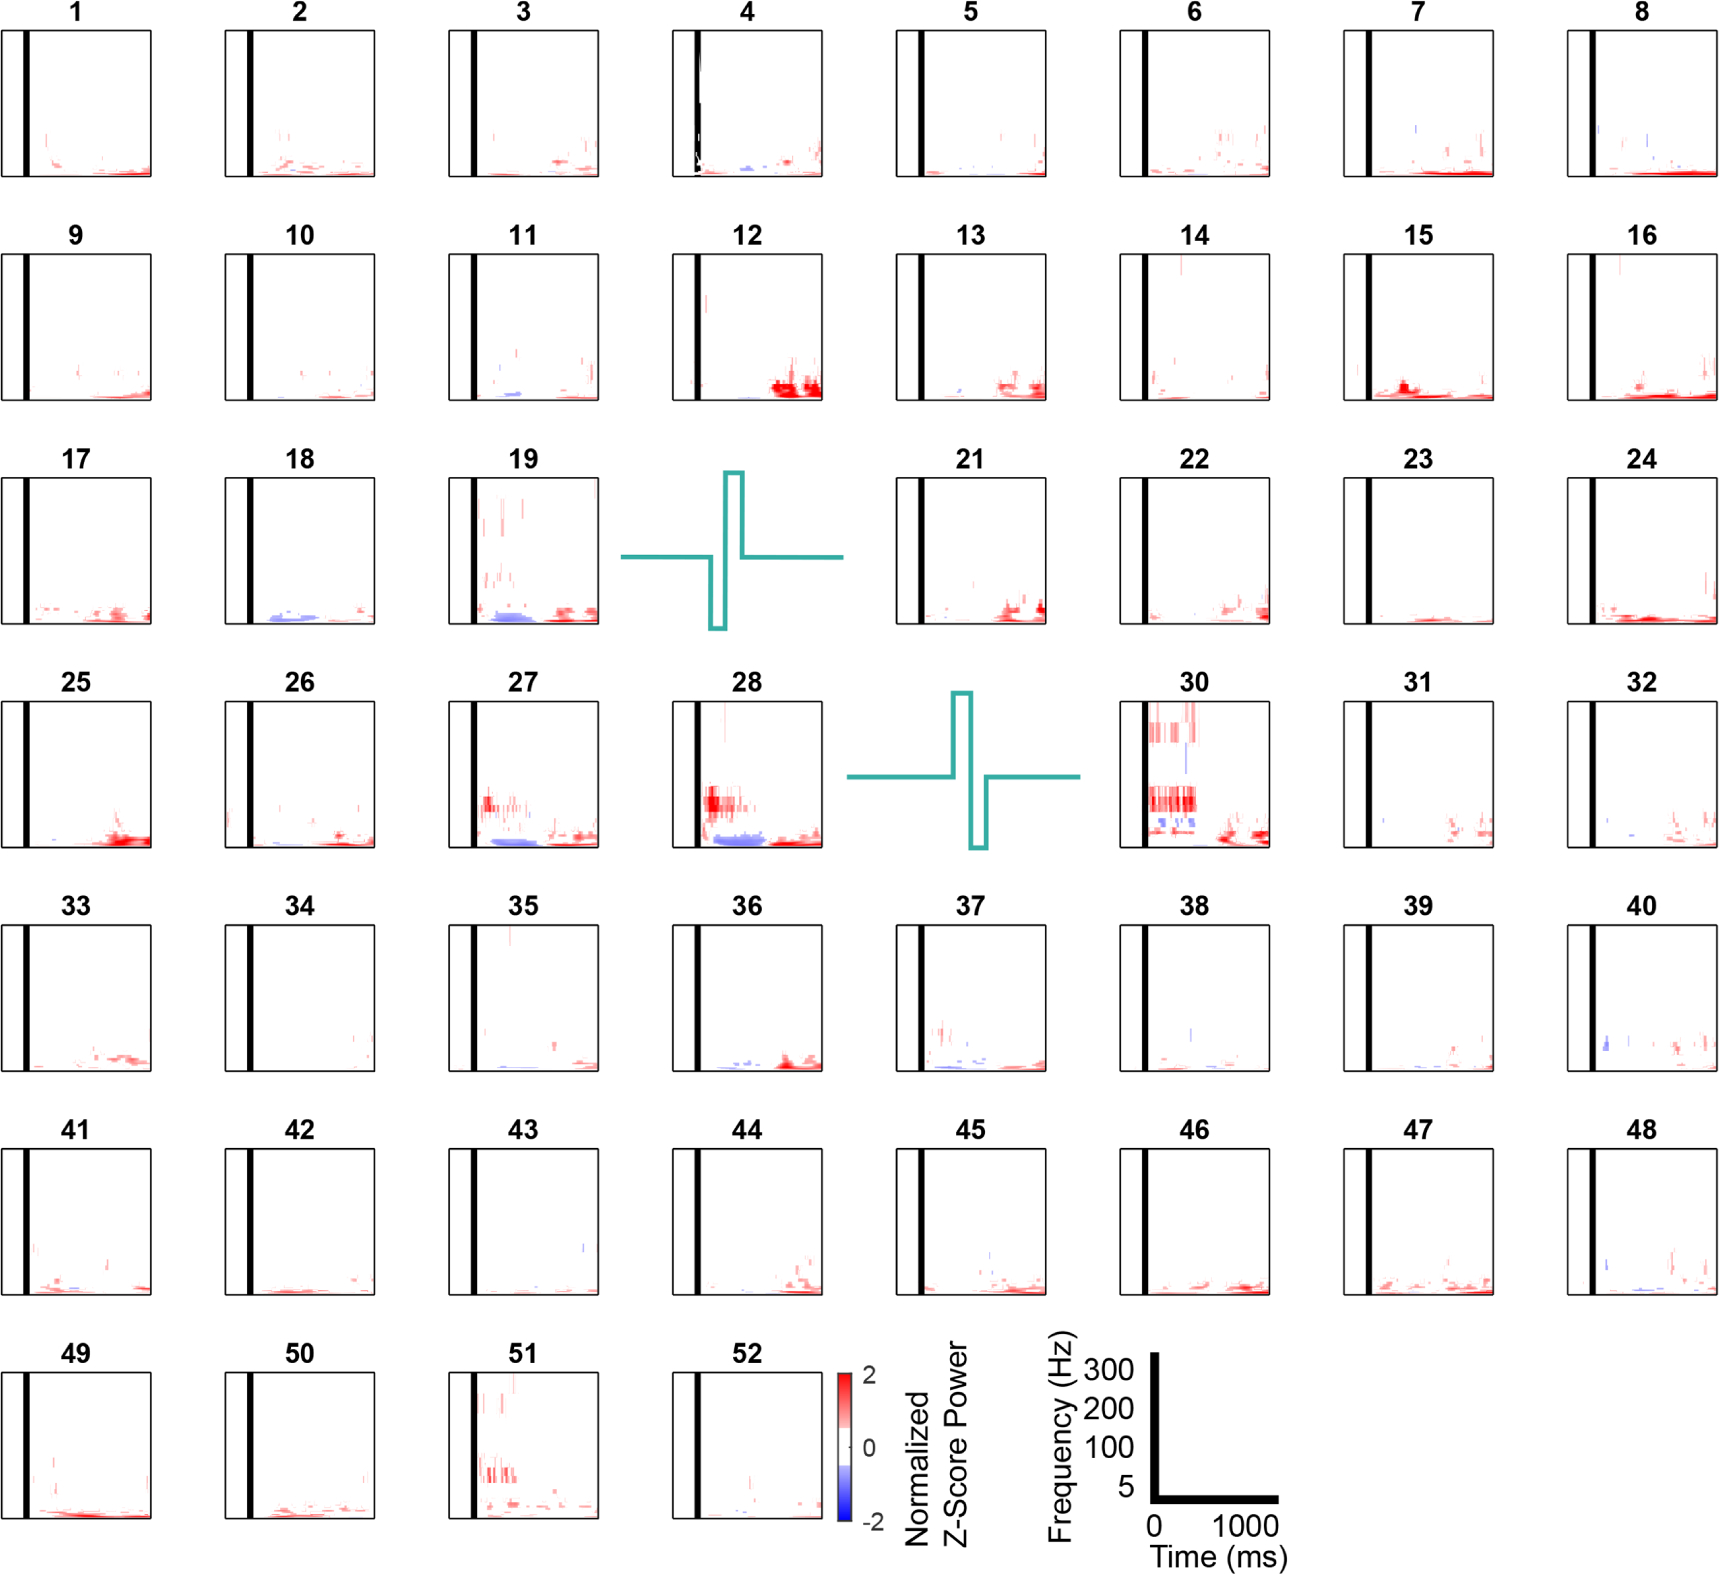
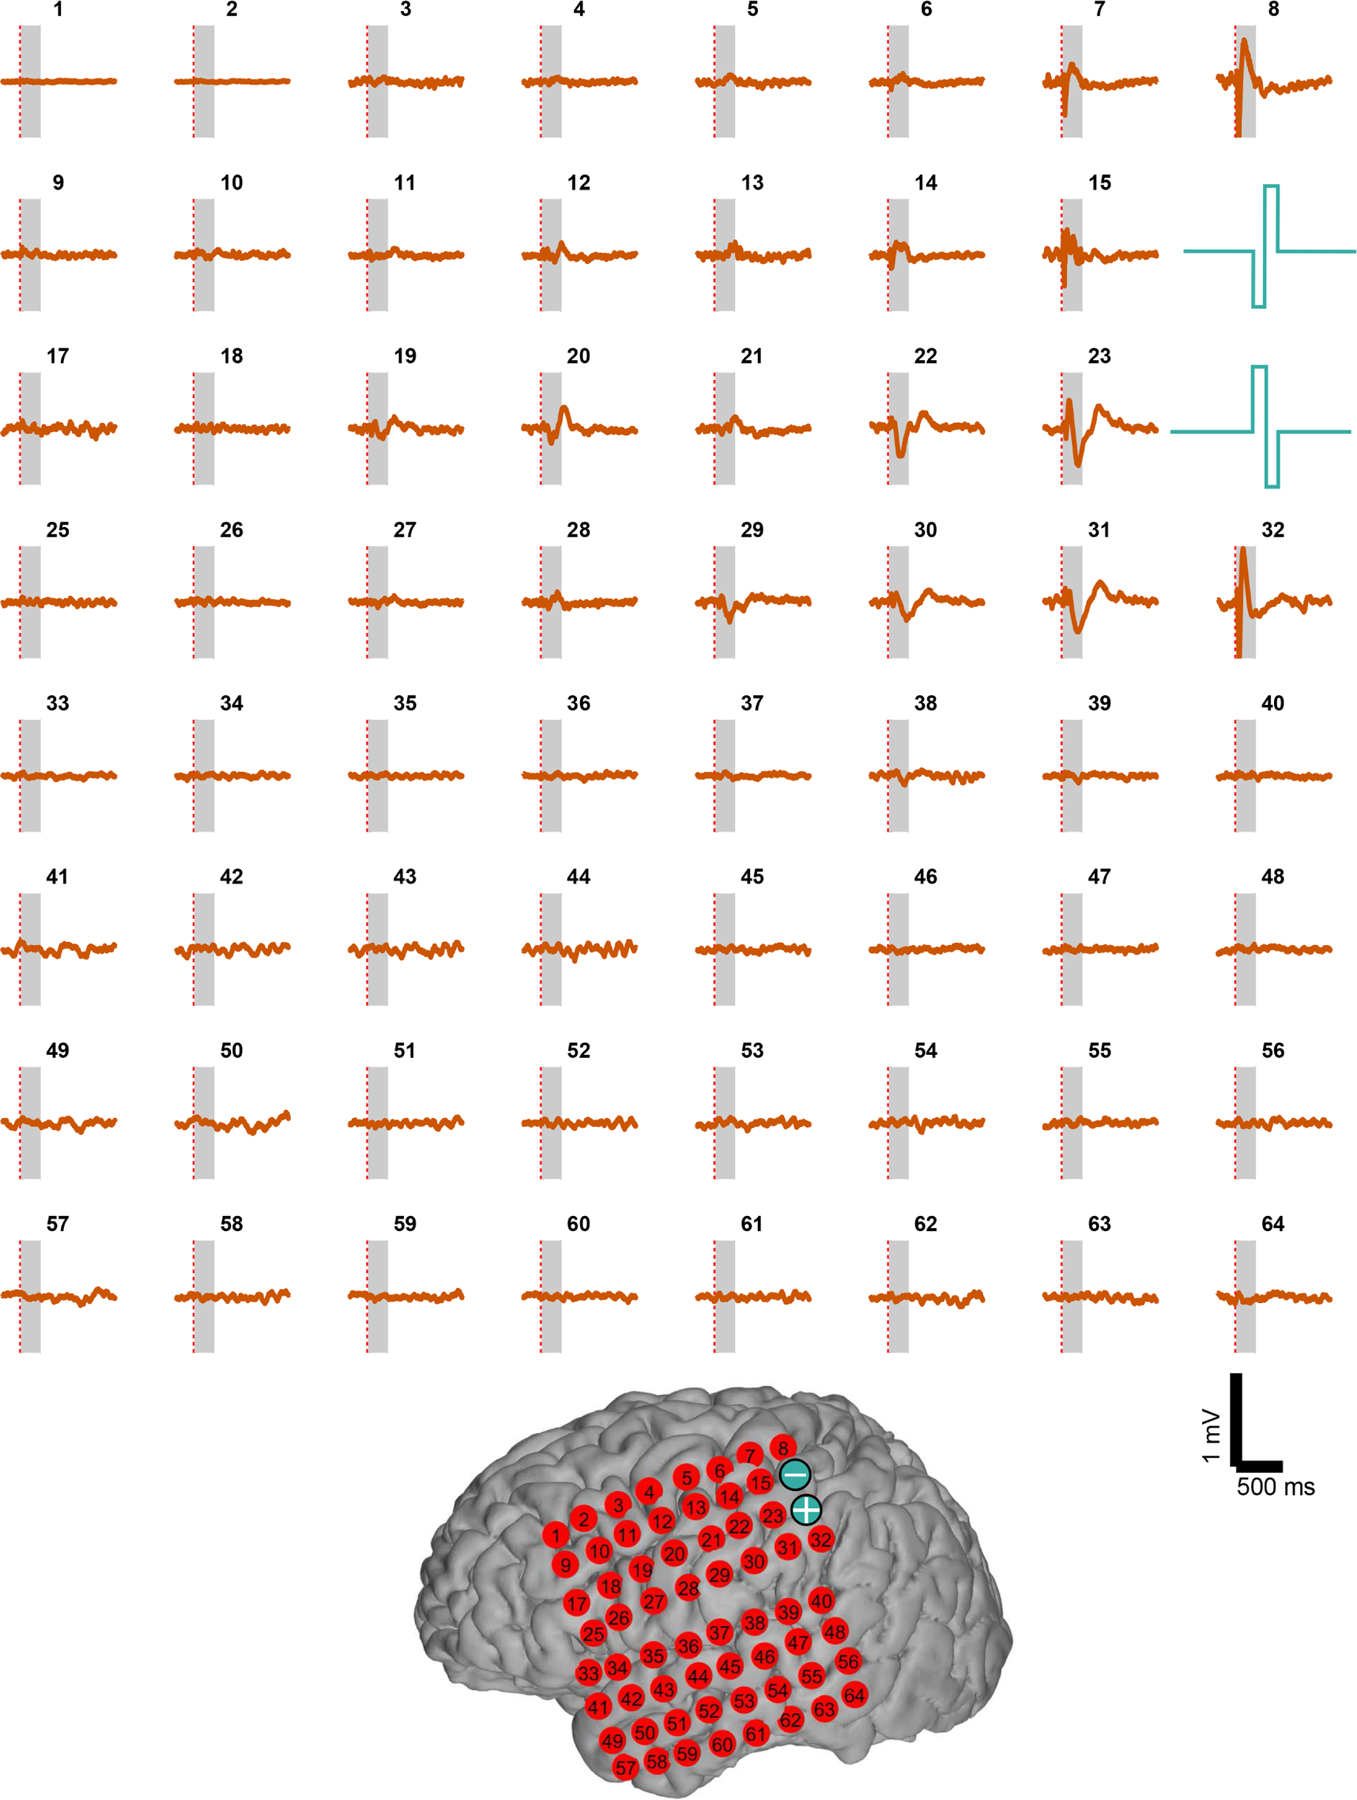
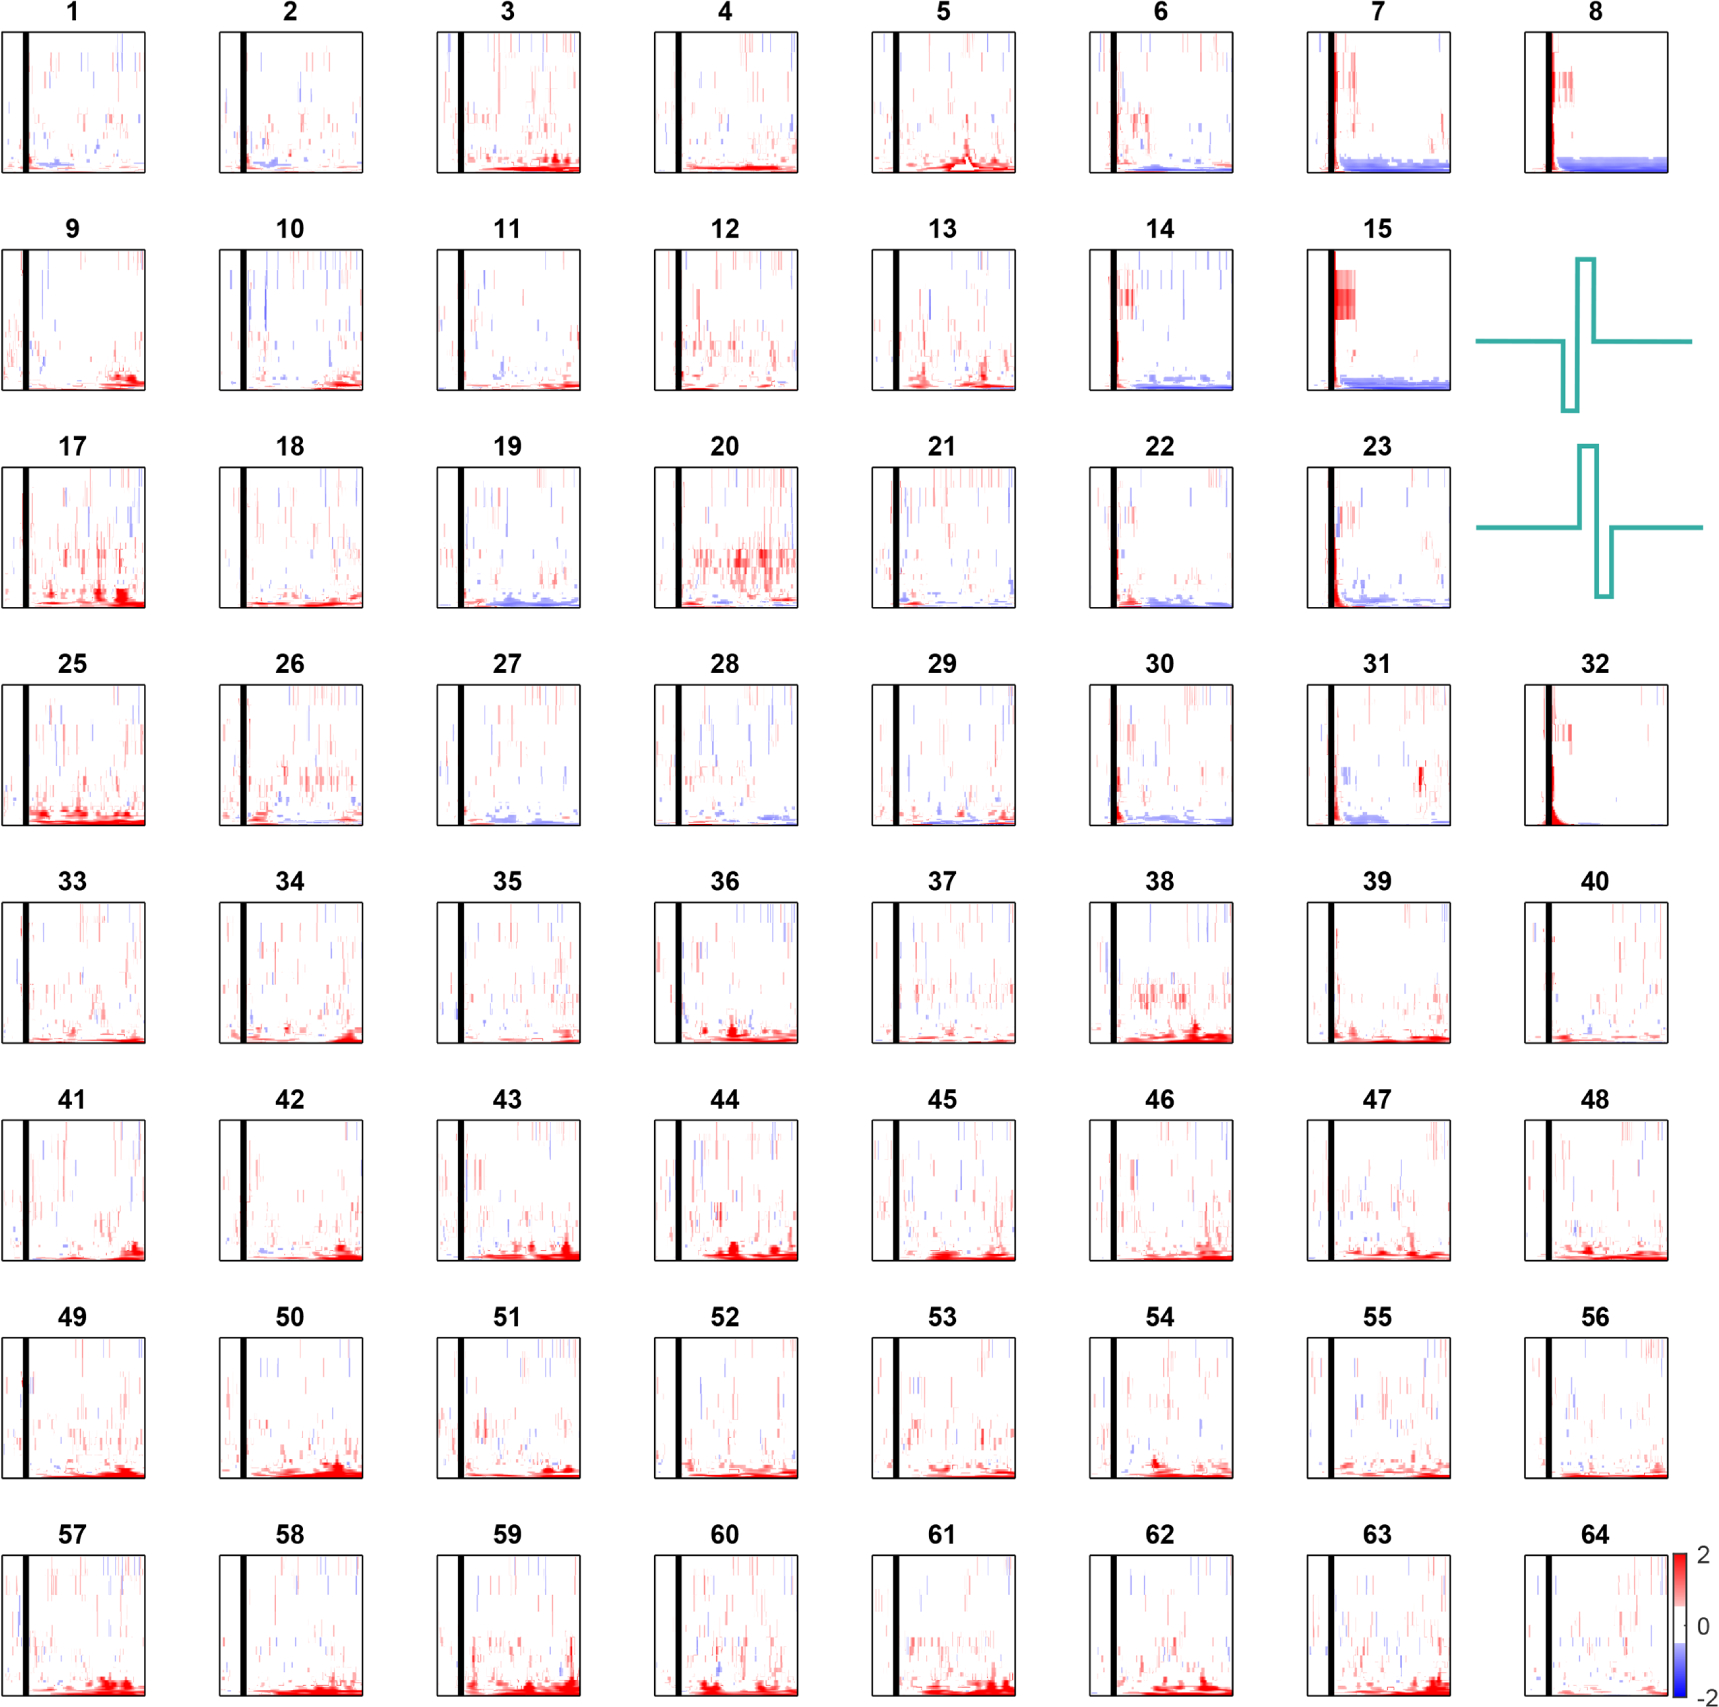
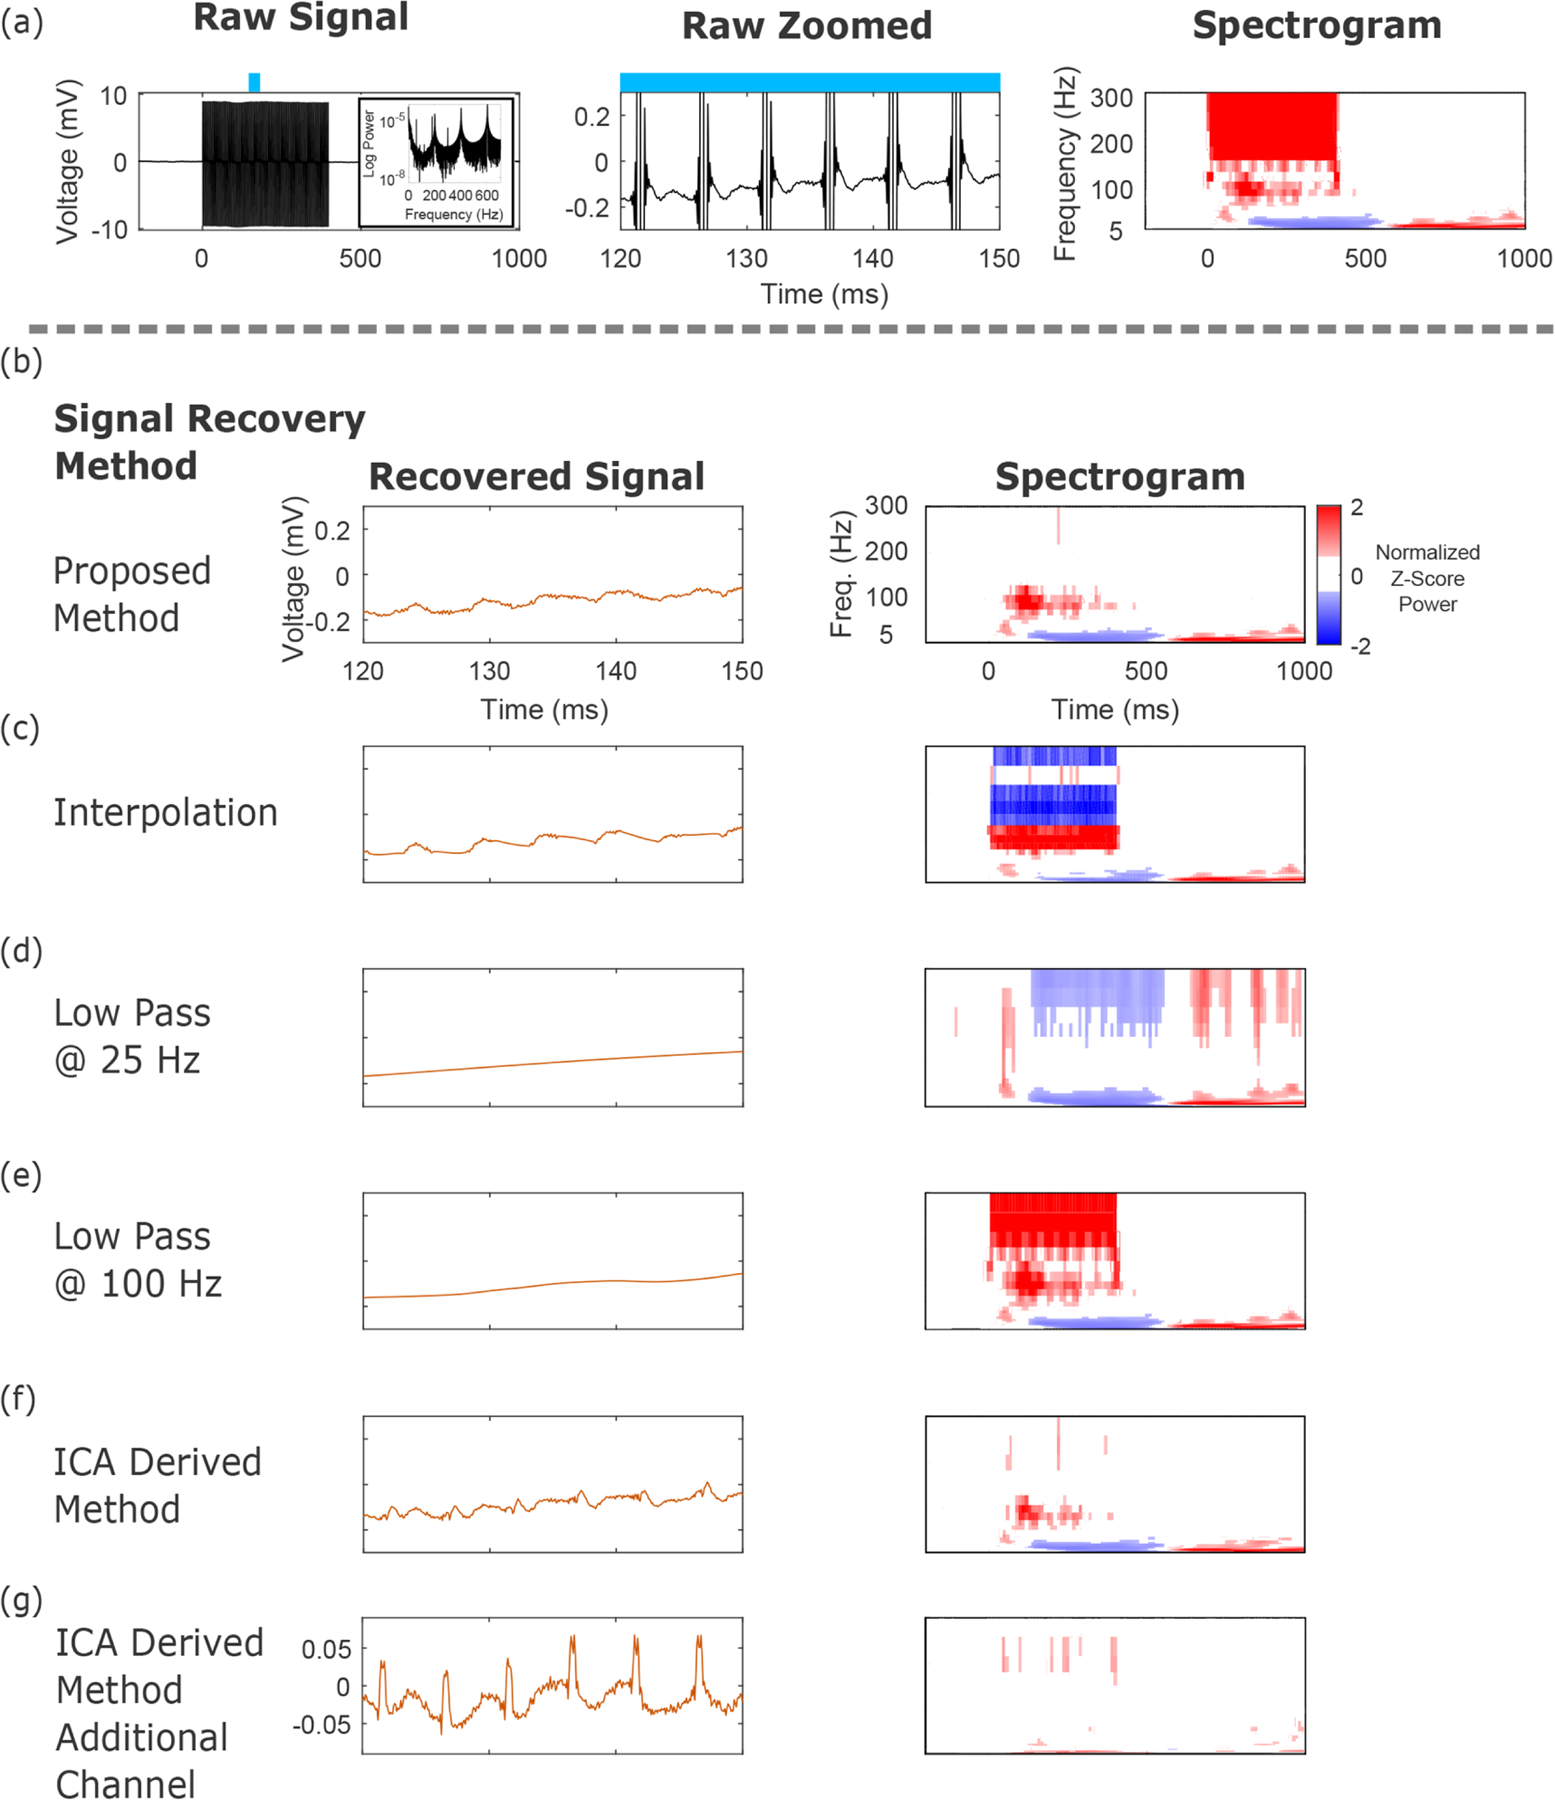
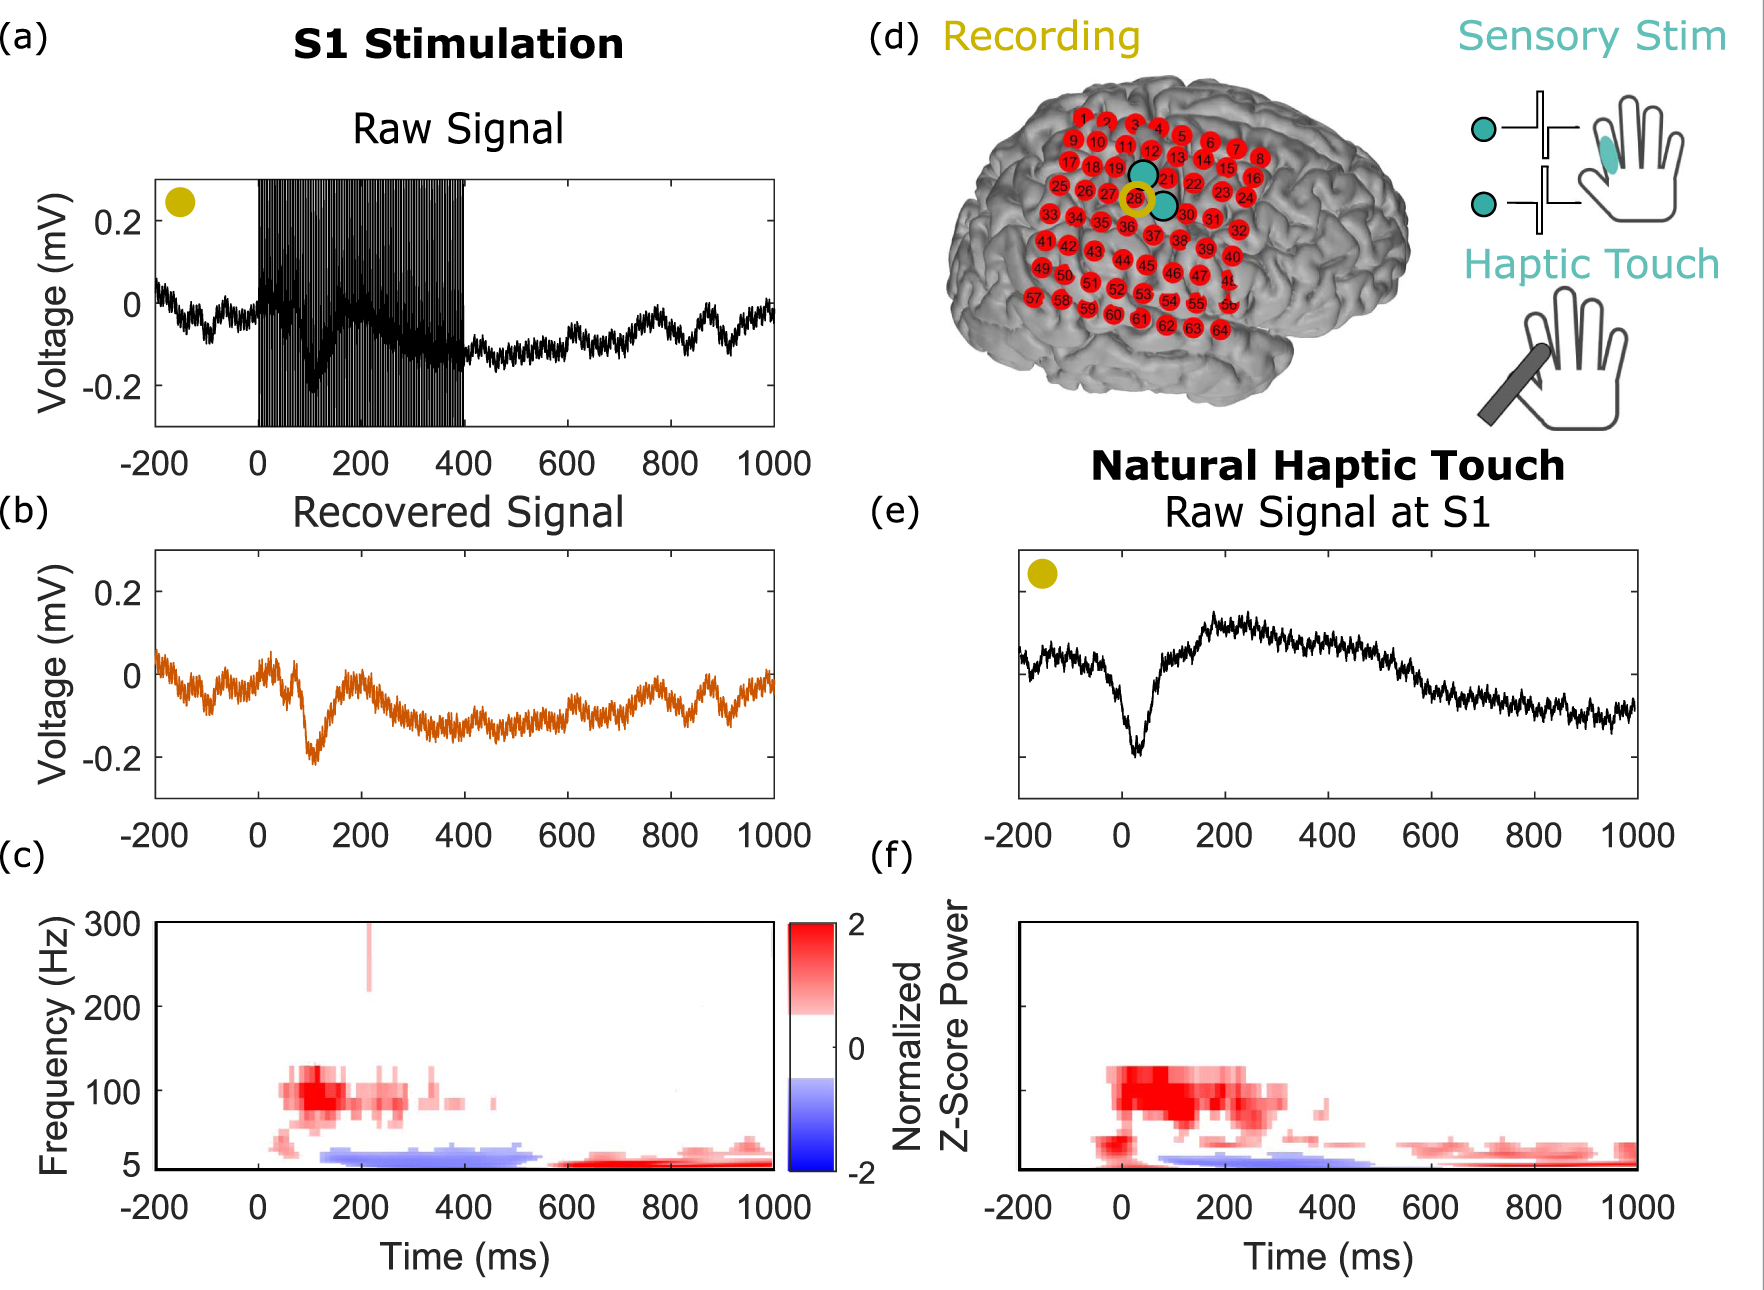
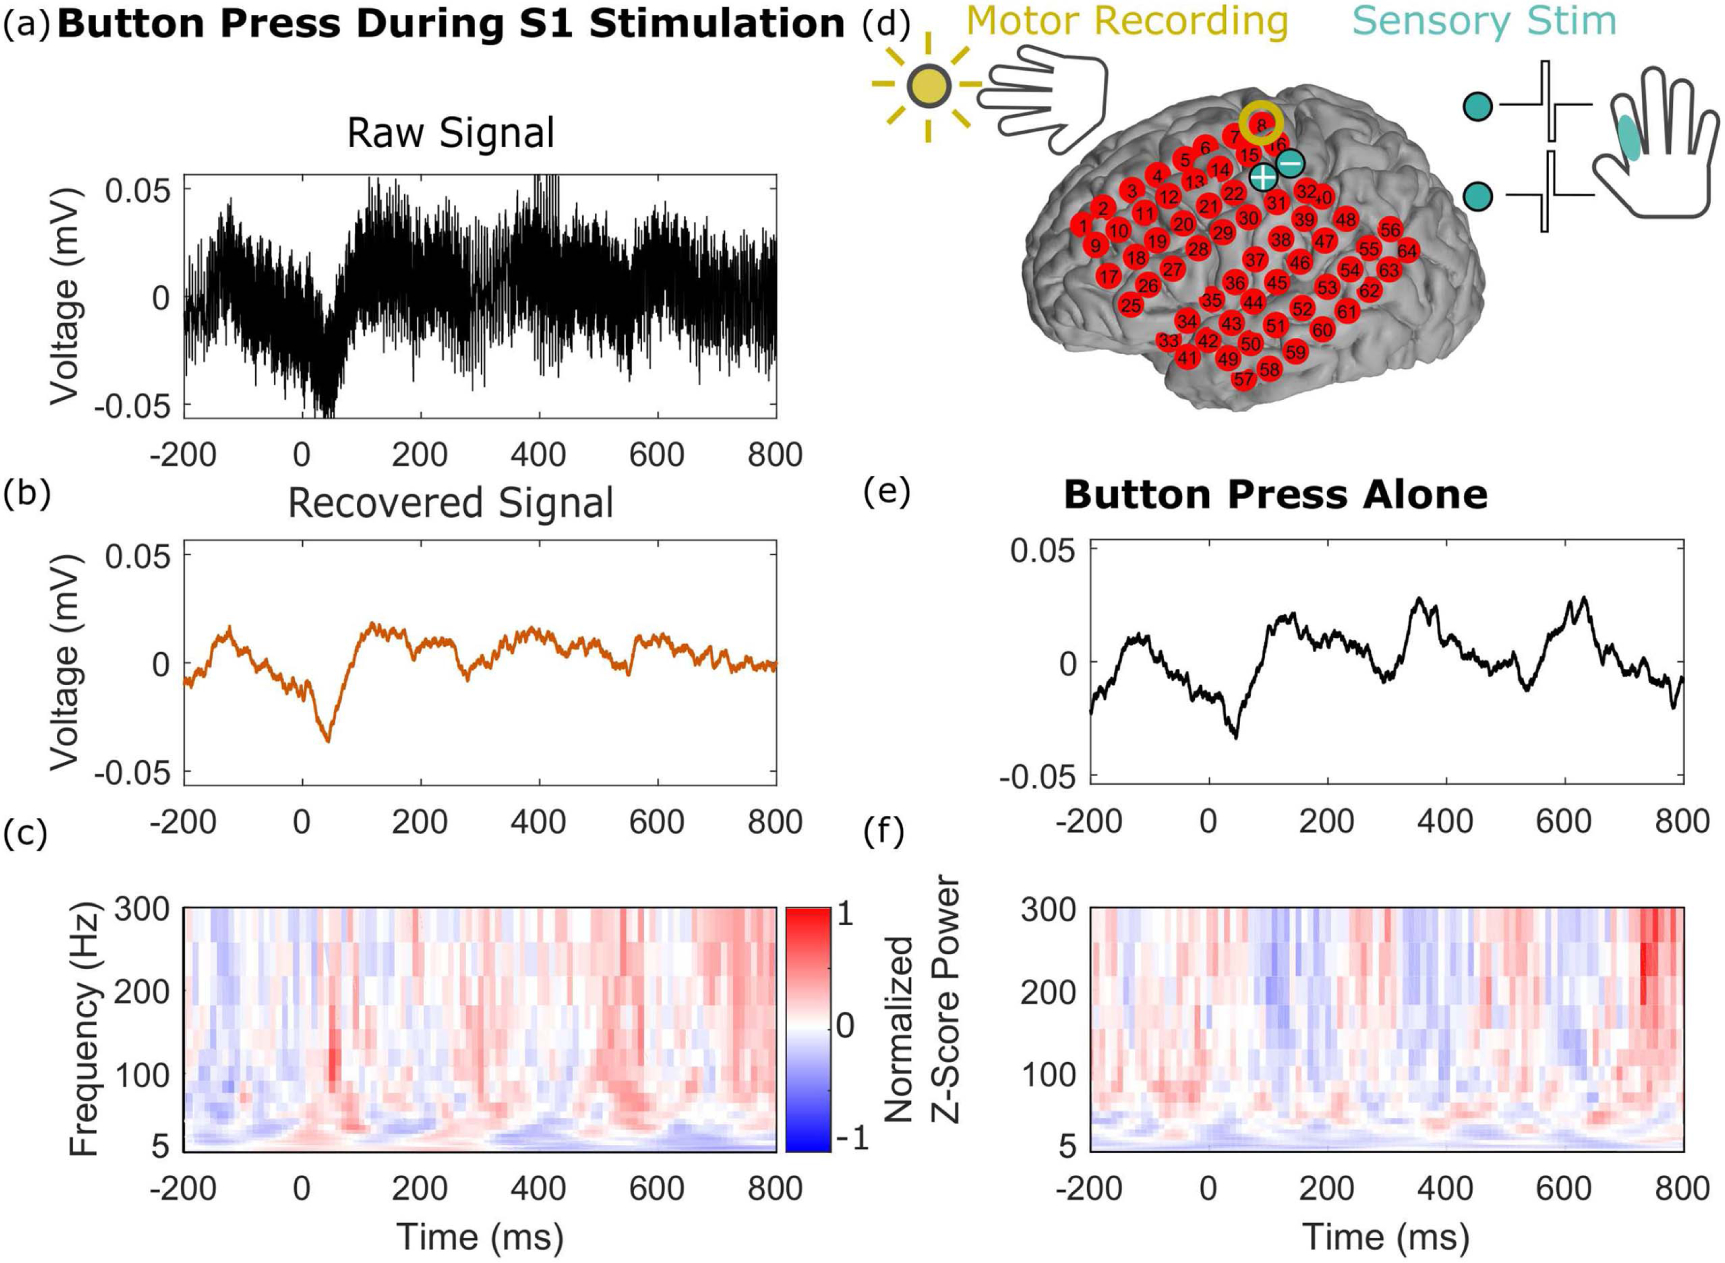
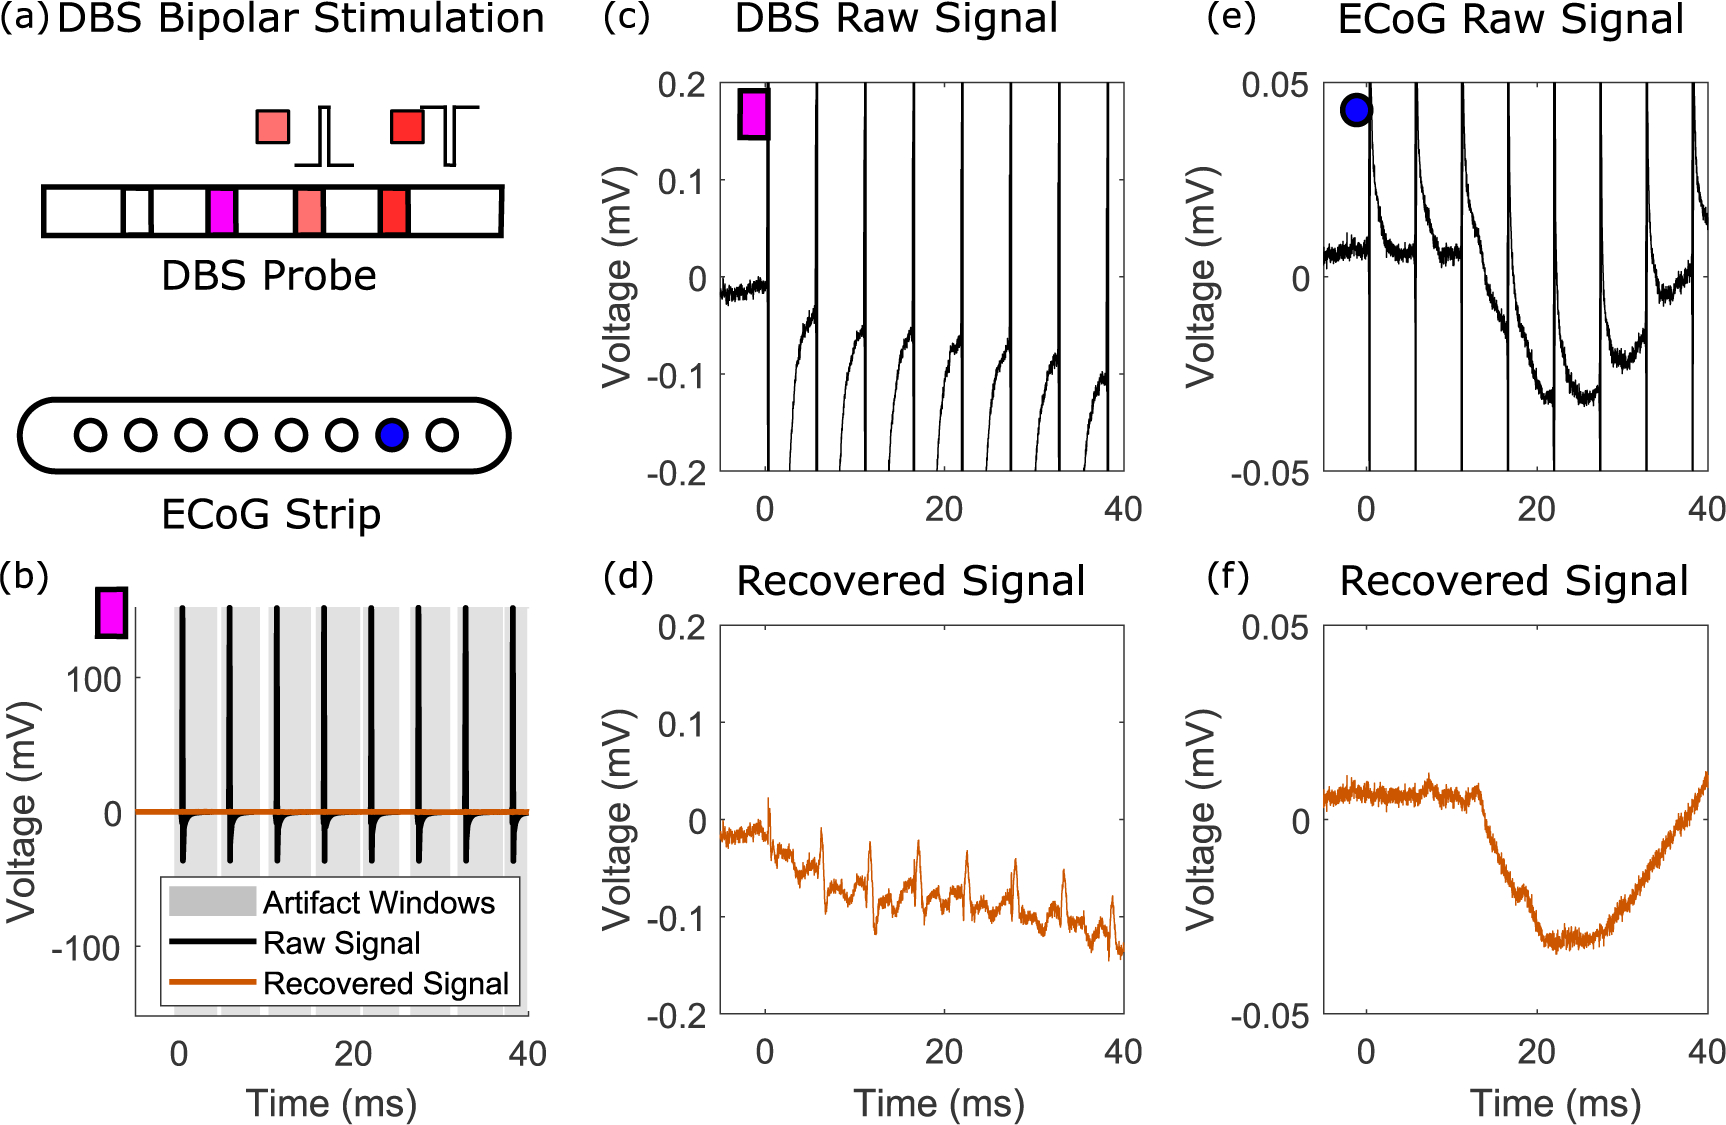
Main results: We demonstrate our signal recovery approach on invasive electrophysiologic recordings from human subjects during stimulation. We show the recovery of meaningful neural signatures in both electrocorticographic (ECoG) arrays and deep brain stimulation (DBS) recordings. In addition, we compared cortical responses induced by the stimulation of primary somatosensory (S1) by natural peripheral touch, as well as motor cortex activity with and without concurrent S1 stimulation.

Significance: Our work will enable future advances in neural engineering with simultaneous stimulation and recording.


Figures

Figure A1.
Figure A1.
Average time-series responses following processing across cortex. Gray window highlights stimulation time period, example data file 1. Turquoise bipolar waveforms indicate the stimulation channels. (Lower right inset) Cortical reconstruction for this subject, where the sites of electrical stimulation are indicated by ⊕ and ⊖ signs.
Figure A2.
Figure A2.
Average time-frequency responses following processing across cortex for example data file 1. Black bar indicates the beginning of the stimulation window. Turquoise bipolar waveforms indicate the stimulation channels.
Figure A3.
Figure A3.
Average time-series responses following processing across cortex. Gray window highlights stimulation time period, example data file 2. Turquoise bipolar waveforms indicate the stimulation channels. (Lower inset) Cortical reconstruction for this subject, where the sites of electrical stimulation are indicated by ⊕ and ⊖ signs.
Figure A4.
Figure A4.
Average time-frequency responses following processing across cortex for example data file 2. Black bar indicates the beginning of the stimulation window. Turquoise bipolar waveforms indicate the stimulation channels. The x,y, and colorbar scales are the same as for figure A2.
Figure 1.
Figure 1.
Schematic overview of our method for signal recovery with stimulation artifacts. (a) Raw stimulation signal epochs (time × channel × epoch) are recorded across an array of electrodes, as shown on a cortical reconstruction of one patient. The two electrode locations indicated by blue ⊕ and ⊖ signs were the sites of the electrical stimulation. These are the input for our algorithm. (b) Individual pulses are identified and extracted within each of these stimulation epoch time periods across all the channels in the array. A small random subset are visualized here. (c) An unsupervised hierarchical density-based clustering technique (HDBSCAN) is used to cluster the individual pulses. Each pulse is colored by the artifact template to which it clustered.(d) Signals are recovered by subtraction of the closest artifact template for each pulse. Subsequent analyses can then be performed directly on the output signals, which are the same size as the input data.
Figure 2.
Figure 2.
Clustering, dictionary learning, and template matching. (a) The input to clustering is a matrix of mean-subtracted raw voltages following artifact onset and offset detection, shown here as a heatmap for a small subset of trials, with the subset of data points within the artifact window used for clustering shown. The sampling rate for this data is 12 207 Hz. (b) Example voltages at two time features used for clustering, which are input into an HDBSCAN clustering algorithm. (c) The voltage data sorted by matched templates, color coded to match the clusters in panel (b). (d) The four extracted artifact template clusters for the raw traces in panel (a).
Figure 3.
Figure 3.
Comparisons between artifact rejection with our dictionary learning method and alternative methods as illustrated with a single channel. (a) Average raw stimulation signal across trials, from concurrent stimulation and recording. The broad spectral nature of these artifacts reveals significant overlap between spectral features of interest and the stimulation frequency. The time-frequency plot illustrates the broad spectral nature of the stimulation artifacts during the train of stimulation pulses, as well as onset and offset artifacts. (b) Signal recovery by our method has leveraged the data to account for variable artifacts in the raw voltage and timing across different channels. Our approach captures both time-series and time-frequency information (here shown averaged across all trials) well. (c) Piece-wise cubic spline interpolation locally reduces the time-domain artifact, but the time-frequency plot illustrates how large, undesirable signals have been introduced, highlighting how similar time-series traces can have significantly different spectral content. (d) Low pass filtering at 25 Hz with a 4th order acausal Butterworth filter eliminates the high frequency artifact at 200 Hz, but flattens the time-series signal and eliminates the 100 Hz activity recovered in panel (b). (e) Low pass filtering at 100 Hz fails to eliminate the high frequency artifact at 200 Hz, and flattens the time-series signal. (f) An ICA derived method that selectively removes components with a dominant 200 Hz spectral component removes the 200 Hz artifact, but also attenuates the time-varying spectral information in panel (b). (g) The same ICA derived method results in incomplete signal separation on other channels within the array, leaving large residual artifacts.
Figure 4.
Figure 4.
Details of the raw and recovered time-series signals. (a) The raw (black) and recovered (orange) time-series data for one epoch, with gray windows indicating the artifact windows. The channel highlighted is channel 28 in figures A1–A2. The blue bar indicates the period of time shown as zoomed in time in panel (b). (b) Zoomed-in region of panel (a), highlighting the onset and offset for each individual artifact, and the recovered signal. (c) and (d) Corresponding raw and recovered signals at a smaller voltage scale for panel (b), highlighting the preservation of signal outside of the artifact window. Signal recovery within the artifact window has no obvious discontinuities.
Figure 5.
Figure 5.
Signal recovery shows meaningful neural activity after artifact subtraction in a comparison of electrical stimulation with peripheral haptic touch. We compared responses at an electrode (yellow circle) that showed robust responses to both haptic and direct S1 stimulation. The site of the touch was matched to where the stimulation sensation was localized on the hand, as illustrated in (d). (a) The raw time-series trace, averaged over all stimulation epochs, aligned on stimulation train onset at time t = 0 ms, showing prominent stimulation artifacts (a train of pulses at 200 Hz applied for 400 ms). (b) The average of the recovered signal. (c) The time-frequency plot of the signal in panel (b). (d) The experimental paradigm. (e) and (f) The mean time-series and time-frequency plots of the haptic touch experiment aligned on touch onset, which occurs at time t = 0 ms. The small delay seen between the neural signals and t = 0, where touch onset is marked to occur, is due to previously published latencies resulting from custom electronic touch probes comprised of force-sensitive resistors (Caldwell et al 2019, Collins et al 2017).
Figure 6.
Figure 6.
Signals recovered during a self-paced button pressing task with and without concurrent stimulation are comparable. We analyzed responses at one electrode (yellow circle in panel (d)) in motor cortex. (a) Average raw time-series trace during S1 stimulation (200 Hz trains at turquoise electrodes in (d)), zero aligned to time of button presses. (b) and (c) The average recovered signal, shown as time-series and time-frequency plots. (d) The experimental paradigm, where the subject perform a self-timed button pressing task and received electrical stimulation in S1 of the same hand on some of the trials. (e) and (f) The average time-series and time-frequency plots of the stimulation-free conditions.
Figure 7.
Figure 7.
Recovery of signals from non-uniform stimulation trains and recovery of rapid evoked potentials. (a) Overlaid raw and processed signal for channel 15 for a single stimulation train epoch in figures A3–A4, highlighting two initial high amplitude pulses, followed by a train of lower amplitude pulses. Average epoched template subtraction would fail to recover the correct signal here. (b) Time-frequency plot of the recovered signal, highlighting the representation of the reproducible rapid evoked potentials in the time-frequency domain. The units are normalized Z-Score power as in other figures. (c) Zoomed-in average raw signal highlighting rapid evoked potentials following each stimulation pulse. (d) Recovered average signal highlighting the preservation of these early evoked potentials.
Figure 8.
Figure 8.
Recovery of early evoked potentials on DBS electrodes. (a) Bipolar, monophasic stimulation through DBS electrodes, with concurrent recording on the other channels. The example DBS and ECoG recordings are show by the purple rectangle and blue circle. (b) Raw and recovered example epoch, with the artifact windows highlighted. (c) Raw average signal on a DBS channel within the same probe as the stimulation electrodes. (d) Recovered average signal after template matching on the corresponding signal shown in (c), illustrating an early evoked potential. (e) Raw average signal on an ECoG electrode during stimulation through the DBS electrodes. (f) Recovered signal corresponding to (e).
Figure 9.
Figure 9.
An illustration of failure to recover signal where the S1 stimulation data had been acquired at a lower sampling rate (1221 Hz) (Collins et al 2017). Partly due to the lower sampling rate, there were a number of failure modes as described below. (a) The density-based clustering method did not produce distinct clusters (compare to figure 2). Gray points represent individual trials which were classified as outliers and were not part of a cluster. (b) The template selected was not an ideal match and was imperfectly scaled. (c) The wrong template was selected. (d) The end of the template was not accurately calculated. (e) The result of these mismatches was unsuccessful separation of neural signal from the stimulation artifacts, shown here for an example epoch. We define unsuccessful signal recovery here as residual artifacts on the scale of the original signal, as well as no additional insight on the underlying neural activity.

References

    1. Aghabozorgi S, Seyed Shirkhorshidi A and Ying Wah T 2015. Time-series clustering—A decade review Inf. Sys 53 16–38
    1. Al-ani T, Cazettes F, Palfi S and Lefaucheur JP 2011. Automatic removal of high-amplitude stimulus artefact from neuronal signal recorded in the subthalamic nucleus J. Neurosci. Methods 198 135–46 - PubMed
    1. Alagapan S, Shin HW, Fröhlich F and Wu H-t 2018. Diffusion geometry approach to efficiently remove electrical stimulation artifacts in intracranial electroencephalography J. Neural Eng 16 036010. - PubMed
    1. Allen DP, Stegemöller EL, Zadikoff C, Rosenow JM and MacKinnon CD 2010. Suppression of deep brain stimulation artifacts from the electroencephalogram by frequency-domain Hampel filtering Clin. Neurophysiol.121 1227–32 - PMC - PubMed
    1. Ashkan K, Rogers P, Bergman H and Ughratdar I 2017. Insights into the mechanisms of deep brain stimulation Nat. Rev. Neurol 13 548–54 - PubMed

Publication types