. 2020 Jan 12;10(5):2095-2114.
doi: 10.7150/thno.30736. eCollection 2020.

Anti-CDCP1 immuno-conjugates for detection and inhibition of ovarian cancer

Affiliations

Anti-CDCP1 immuno-conjugates for detection and inhibition of ovarian cancer

Brittney S Harrington et al. Theranostics. .

Abstract

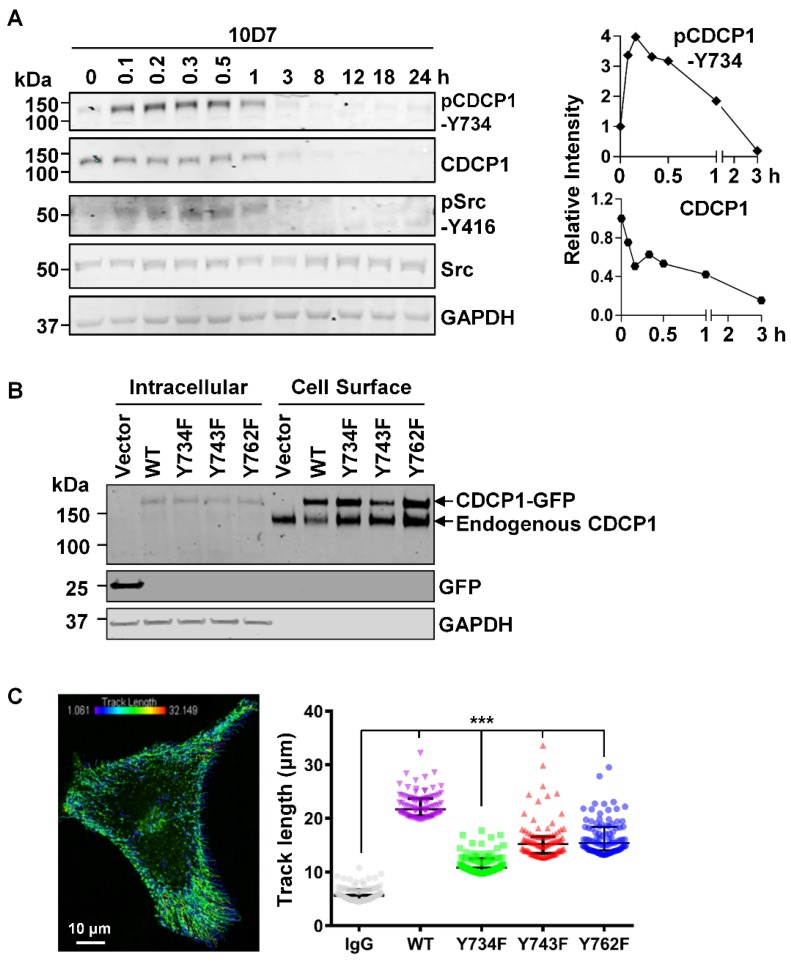
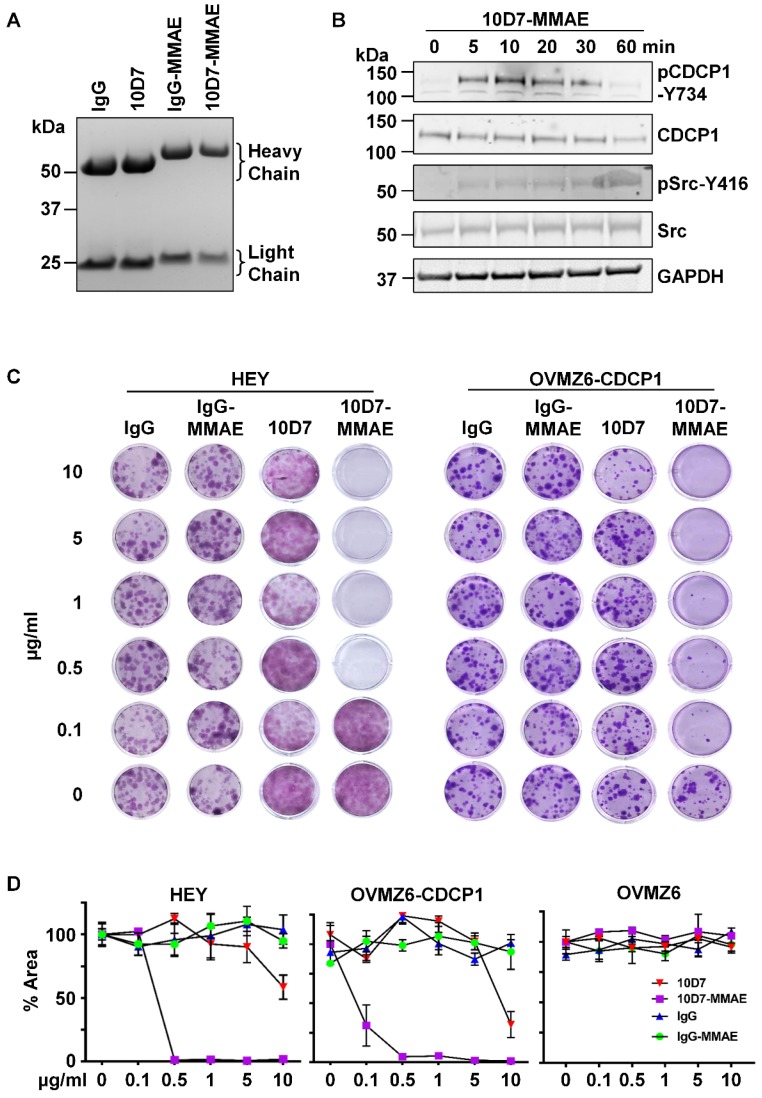
CUB-domain containing protein 1 (CDCP1) is a cancer associated cell surface protein that amplifies pro-tumorigenic signalling by other receptors including EGFR and HER2. Its potential as a cancer target is supported by studies showing that anti-CDCP1 antibodies inhibit cell migration and survival in vitro, and tumor growth and metastasis in vivo. Here we characterize two anti-CDCP1 antibodies, focusing on immuno-conjugates of one of these as a tool to detect and inhibit ovarian cancer. Methods: A panel of ovarian cancer cell lines was examined for cell surface expression of CDCP1 and loss of expression induced by anti-CDCP1 antibodies 10D7 and 41-2 using flow cytometry and Western blot analysis. Surface plasmon resonance analysis and examination of truncation mutants was used to analyse the binding properties of the antibodies for CDCP1. Live-cell spinning-disk confocal microscopy of GFP-tagged CDCP1 was used to track internalization and intracellular trafficking of CDCP1/antibody complexes. In vivo, zirconium 89-labelled 10D7 was detected by positron-emission tomography imaging, of an ovarian cancer patient-derived xenograft grown intraperitoneally in mice. The efficacy of cytotoxin-conjugated 10D7 was examined against ovarian cancer cells in vitro and in vivo. Results: Our data indicate that each antibody binds with high affinity to the extracellular domain of CDCP1 causing rapid internalization of the receptor/antibody complex and degradation of CDCP1 via processes mediated by the kinase Src. Highlighting the potential clinical utility of CDCP1, positron-emission tomography imaging, using zirconium 89-labelled 10D7, was able to detect subcutaneous and intraperitoneal xenograft ovarian cancers in mice, including small (diameter <3 mm) tumor deposits of an ovarian cancer patient-derived xenograft grown intraperitoneally in mice. Furthermore, cytotoxin-conjugated 10D7 was effective at inhibiting growth of CDCP1-expressing ovarian cancer cells in vitro and in vivo. Conclusions: These data demonstrate that CDCP1 internalizing antibodies have potential for killing and detection of CDCP1 expressing ovarian cancer cells.

Keywords: CDCP1; antibody; immuno-conjugate; ovarian cancer.


Conflict of interest statement

Competing Interests: The authors have declared that no competing interest exists.

Figures

Figure 1
Figure 1
Antibody-induced loss of CDCP1 from the cell surface. (A) Western blot analysis of lysates from the indicated cell lines using two mouse monoclonal anti-CDCP1 antibodies, 10D7 and 41-2 (1 µg/ml), a commercial rabbit polyclonal anti-CDCP1 antibody, 4115 (1:2,000 dilution), and an anti-GAPDH antibody (1:10,000). (B) Flow cytometry analysis of the indicated cell lines for plasma membrane localized CDCP1 using 10D7 and 41-2. Fixed cells were stained with the respective anti-CDCP1 antibody followed by an APC-conjugated anti-mouse IgG, then analysed by flow cytometry. Data are displayed graphically as MFI values corrected for background signal determined from cells stained with only the APC-conjugated anti-mouse IgG. 10D7 and 41-2 identified the same proportion of CDCP1 expressing cells as: HEY 89%; CAOV3 93%; SKOV3 99%; OVTOKO 86%; OVZM6 0%; OVMZ6-CDCP1 75%. (C, D) Flow cytometry analysis of HEY (c) and OVMZ6-CDCP1 (d) cells treated for 30 minutes at 37°C with 10D7, 41-2 or control IgG1κ (5µg/ml). Treated cells were fixed and plasma membrane localized CDCP1 detected using fluorescently tagged anti-CDCP1 antibody CD318-PE. Background signal was assessed by staining treated cells with fluorescently tagged control IgG (IgG-PE). Data are displayed as MFI values. All data are mean ± SEM from three independent experiments. ***P<0.001.
Figure 2
Figure 2
Degradation of CDCP1 induced by internalizing mAbs 41-2 and 10D7. (A) Western blot analysis, using anti-CDCP1 antibody 4115 (1:2,000) and an anti-GAPDH antibody (1:10,000), of lysates from HEY cells treated with isotype matched control IgG (left), 10D7 (middle) or 41-2 (right) for the indicated times. (B) Graph of fluorescence versus time from HeLa and HeLa-CDCP1 cells treated with 10D7pH (5µg/ml) (left), and graph of fluorescence signal from six EOC cell lines following treatment with 10D7pH or 41-2pH (5µg/ml) for 8 hours (right). RFU, relative fluorescence units. (C) Impact of lysosomal (left) and proteasomal (right) inhibition on antibody-induced degradation of CDCP1. Top panel, Anti-CDCP1 (1:2,000) and -GAPDH (1:10,000) Western blot analysis of HEY cells treated with 10D7 in the presence or absence of the lysosomal inhibitor chloroquine (CLQ; 50 µM), or the proteasomal inhibitor MG132 (20 µM) for the indicated times. Bottom panel, Graph of the ratio of CDCP1 to GAPDH signal generated from Western blot analyses of lysates from three independent assays assessing the effect of CLQ and MG132 on 10D7-induced degradation of CDCP1. All data represent mean ± SEM from three independent experiments. *P<0.05.
Figure 3
Figure 3
10D7 and 41-2 bind with high affinity to the ECD of CDCP1. (A) Schematic representation of full length CDCP1 (CDCP1FL) and progressively shorter carboxyl terminal truncations (CDCP1-T358, -S416, -K554, -D665). CUB domains are colored green. (B) 10D7 and 41-2 (1 µg/ml) Western blot analysis of conditioned media from OVMZ6 cells transiently transfected with a control vector of constructs encoding CDCP1-T358, -S416, -K554, or -D665. (C) Flow cytometry analysis of HEY cells incubated with: (i) 10D7-QDot625 for 1 h, unlabelled 41-2 for 1 h then 10D7-QDot625 for 1 h, or concurrently with 10D7-QDot625 and 41-2 for 1 h; or (ii) CD318-PE for 1 h, unlabelled 10D7 or 41-2 for 1 h then CD318-PE for 1 h, or concurrently with 10D7 or 41-2 and CD318-PE for 1 h. (D) Schematic of CDCP1 showing the regions to which antibodies 10D7, 41-2, CD318 and 4115 bind. (E) Top panels, Sensorgrams of CDCP1-ECD (concentration range 1.56 to 50 nM) binding to immobilized 10D7 (left) and 41-2 (right) depicting association (increasing signal) and dissociation (reducing signal) over time. Bottom panel, Table of kinetic parameters. ka, association rate; kd, dissociation rate; KD, affinity constant.
Figure 4
Figure 4
10D7-induces cell surface rapid clustering and lysosomal trafficking of CDCP1. (A) Live-cell confocal microscopy images of HEY-CDCP1GFP cells treated with 10D7pH (5µg/ ml). Internalization of CDCP1GFP and 10D7pH was observed at 1 frame per second for 600 s. Insets highlight green punctate CDCP1GFP positive cellular structures at 30 s, and white cellular structures at 600s that are positive for both CDCP1GFP and 10D7pH. (B) Graph of complex formation between IgGpH and CDCP1GFP determined as the percentage of IgGpH signal coincident with CDCP1GFP signal using ImageJ software analysis. (C) Images of the plasma membrane and proximal cytoplasmic region of HEY-CDCP1GFP cells indicating 10D7-induced clustering of CDCP1. In untreated cells CDCP1GFP is located diffusely on the cell surface. In treated cells, arrowheads highlight rapid 10D7-induced clustering of CDCP1GFP and its internalization. (D) Left panel, Overlay of CDCP1GFP (green) and 10D7pH (magenta) signals in HEY-CDCP1GFP cells after 20 minutes of treatment showing co-localization of within endosomal-like structures. Middle panel, Black and white image of CDCP1GFP signal. Right panel, Black and white image of 10D7pH signal. (E) Live-cell confocal microscopy images of HEY-CDCP1GFP cells treated with IgG7pH (5µg/ ml). No internalization of CDCP1GFP was observed within 300 s of treatment with IgG7pH.
Figure 5
Figure 5
CDCP1 is tyrosine phosphorylated during 10D7-induced internalization and degradation. (A) Lysates from HEY cells treated with 10D7 (5µg/ml) for the indicated times were examined by Western blot analysis for CDCP1, p-CDCP1-Y734, Src, p-Src-Y416, and GAPDH. Antibody dilution was 1:2,000 except the anti-GAPDH antibody which was 1:10,000. The graphs display CDCP1 and p-CDCP1-Y734 levels determined by densitometric analysis with data representing mean ± SEM from three independent experiments. (B) Anti-CDCP1 (1:2,000), -GFP (1:2,000) and -GAPDH (1:10,000) Western blot analysis of fractions collected by cell surface biotinylation of HEY cells expressing CDCP1GFP, CDCP1GFP-Y734F, -Y743F or -Y762F. (C) Analysis of semi-automated computer tracking of CDCP1GFP and CDCP1GFP-Y734F, -Y743F and -Y762F in response to 10D7. Left, representative image of CDCP1GFP tracks that internalized in response to 10D7pH in HEY cells. The image is an overlay onto cells of color-coded tracks (violet, tracks that moved the shortest distance; red, the tracks that moved the greatest distance). Right, Graph of distance moved over 5 min by CDCP1GFP and CDCP1GFP-Y734F, -Y743F and -Y762F in response to 10D7 (5 µg/ml). Data are median and range from the 100 tracks with the highest velocity in each experimental group from three independent experiments. ***P<0.001.
Figure 6
Figure 6
The Src inhibitor dasatinib blocks 10D7-induced phosphorylation and internalization of CDCP1. (A) HEY cells, treated for 2 h with dasatinib (200 nM), were incubated with 10D7 (5µg/ ml) for the indicated times. Lysates were examined by Western blot analysis for CDCP1 (1:2,000), pCDCP1-Y734 (1:2,000) and GAPDH (1:10,000). (B) Live-cell confocal microscopy images, acquired at the indicated time points after antibody treatment, of HEY-CDCP1GFP cells pre-treated with dasatinib (200 nM), then incubated with 10D7pH. Lower panels, 10D7pH signal. Middle panels, CDCP1GFP signal. Upper panels, overlay of 10D7pH and CDCP1GFP signals. (C) Graph of distance moved over 5 min by CDCP1GFP in response to 10D7 in the presence and absence of dasatinib. Data are median and range from the 100 tracks with the highest velocity in each experimental group from three independent experiments. ***P<0.001.
Figure 7
Figure 7
PET-CT imaging of an EOC PDX. (A) Clear cell EOC PDX PH250. Left, hematoxylin and eosin stained section highlighting clear cell features at 40X with 10X magnification (inset). Right, Anti-CDCP1 immunohistochemistry (antibody 4115) highlighting strong CDCP1 expression by malignant cells with accentuation of signal on the plasma membrane at 40X and 10X magnification (inset). (B) Comparison of CDCP1 expression by HEY cells and PDX PH250 cells. Left, Anti-CDCP1 (antibody 4115; 1:2,000) and GAPDH (1:10,000) Western blot analysis of lysates from HEY cells, a HEY cell xenograft, and a PH250 PDX tumor. Right, Cell surface CDCP1 receptor number determined by flow cytometry of single cell suspensions of HEY cells and PDX PH250 cells. Receptor numbers per cell are indicated above the flow cytometry peaks. (C) Representative PET images of mice carrying subcutaneous PH250 PDX tumors on both flanks. 89Zr-10D7 and 89Zr-IgG1κ were injected intravenously three weeks after tumor cell inoculation, and imaging performed 144 h later. White arrowhead, tumor nodules. Yellow arrow, 89Zr-IgG1κ signal accumulated in the spleen. (D) Quantitative bio-distribution analysis of 89Zr-10D7 and 89Zr-IgG1κ 144 h post injection (n = 4). 10D7 accumulates in tumors to a significantly higher degree than IgG1κ which accumulates in the spleen and liver. ***, P<0.001.
Figure 8
Figure 8
10D7-MMAE selectively inhibits colony formation of CDCP1 expressing but not non-expressing EOC cells. (A) Commassie stained gel of IgG and 10D7, and purified products from reactions of IgG and 10D7 with MMAE. (B) HEY cells were treated with 10D7-MMAE (5 µg/ml) for the indicated times and lysates examined by Western blot analysis for CDCP1, p-CDCP1-Y734, Src, p-Src-Y416 and GAPDH. Antibody dilution was 1:2,000 except the anti-GAPDH antibody which was 1:10,000. (C) Representative images of crystal violet stained colonies formed from HEY and OVMZ6-CDCP1 cells after treatment with the indicated concentrations of IgG, IgG-MMAE, 10D7 or 10D7-MMAE. (D) Graph of crystal violet staining, as a percentage of area (% Area), of colonies formed by HEY, OVMZ6-CDCP1 and OVMZ6 cells after treatment with increasing concentrations of IgG, IgG-MMAE, 10D7 or 10D7-MMAE. Data represent means ± SEM from three independent experiments. ***, P<0.001.
Figure 9
Figure 9
10D7-MMAE reduces tumor burden and increases survival of mice carrying intraperitoneal HEY cell xenografts. (A) After 18 days of HEY cell growth (Day 0 in panel c), tumor burden was assessed in four randomly selected mice by PET-CT imaging using. 89Zr-10D7 was injected intravenously, and imaging performed 144 h later. Left, anterior-posterior view. Right, Lateral view. (B) Bioluminescence imaging. Immediately after PET-CT imaging the remaining mice were administered a single treatment of vehicle, MMAE, 10D7 or 10D7-MMAE. Bioluminsecence imaging was performed 7, 14, 21, 24 and 32 days later. Images from day 24 are shown. (C) Change in tumor burden quantified by bioluminescent imaging. (D) Kaplan-Meier survival analysis. Red arrow, day treatments administered.

References

    1. Kurosawa G, Sugiura M, Hattori Y, Tsuda H, Kurosawa Y. Classification of 27 tumor-associated antigens by histochemical analysis of 36 freshly resected lung cancer tissues. Int J Mol Sci; 2016. p. 17. pii: E1862. - PMC - PubMed
    1. Uekita T, Fujii S, Miyazawa Y, Hashiguchi A, Abe H, Sakamoto M. et al. Suppression of autophagy by CUB domain-containing protein 1 signaling is essential for anchorage-independent survival of lung cancer cells. Cancer Sci. 2013;104:865–70. - PMC - PubMed
    1. Razorenova OV, Finger EC, Colavitti R, Chernikova SB, Boiko AD, Chan CK. et al. VHL loss in renal cell carcinoma leads to up-regulation of CUB domain-containing protein 1 to stimulate PKCδ-driven migration. Proc Natl Acad Sci U S A. 2011;108:1931–6. - PMC - PubMed
    1. Miyazawa Y, Uekita T, Hiraoka N, Fujii S, Kosuge T, Kanai Y. et al. CUB domain-containing protein 1, a prognostic factor for human pancreatic cancers, promotes cell migration and extracellular matrix degradation. Cancer Res. 2010;70:5136–46. - PubMed
    1. Nakashima K, Uekita T, Yano S, Kikuchi JI, Nakanishi R, Sakamoto N. et al. Novel small molecule inhibiting CDCP1-PKCδ pathway reduces tumor metastasis and proliferation. Cancer Sci. 2017;108:1049–57. - PMC - PubMed

Publication types

MeSH terms