. 2020 Jan 16;10(5):2358-2373.
doi: 10.7150/thno.40397. eCollection 2020.

IKKε phosphorylates kindlin-2 to induce invadopodia formation and promote colorectal cancer metastasis

Affiliations

IKKε phosphorylates kindlin-2 to induce invadopodia formation and promote colorectal cancer metastasis

Ge Liu et al. Theranostics. .

Abstract

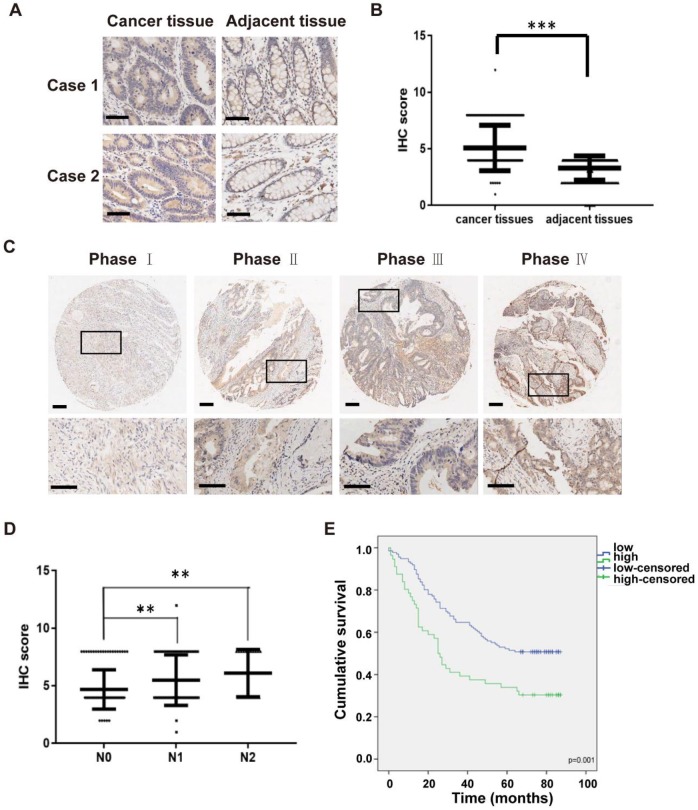
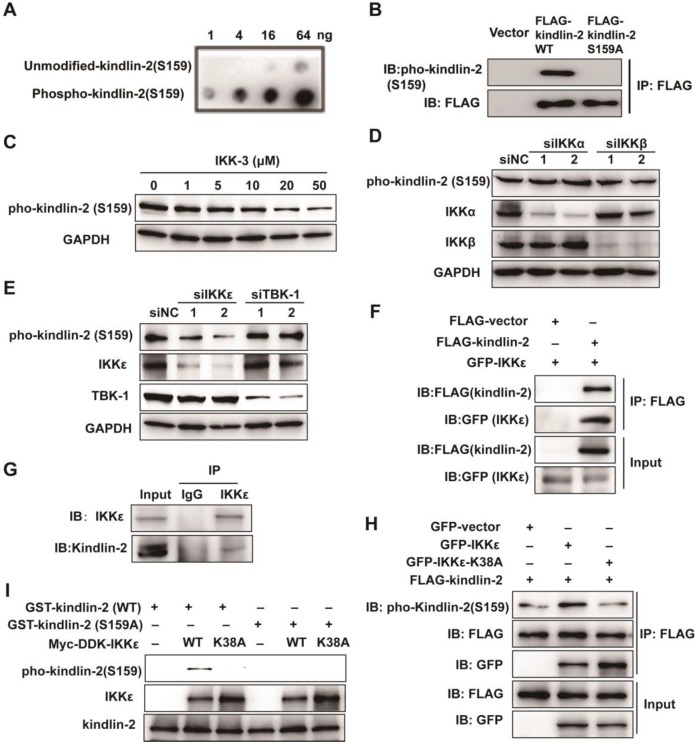
Invadopodia formation is a key driver of cancer metastasis. The noncanonical IkB-related kinase IKKε has been implicated in cancer metastasis, but its roles in invadopodia formation and colorectal cancer (CRC) metastasis are unclear. Methods: Immunofluorescence, gelatin-degradation assay, wound healing assay and transwell invasion assay were used to determine the influence of IKKε over-expression, knockdown and pharmacological inhibition on invadopodia formation and the migratory and invasive capacity of CRC cells in vitro. Effects of IKKε knockdown or pharmacological inhibition on CRC metastasis were examined in mice. Immunohistochemistry staining was used to detect expression levels of IKKε in CRC patient tissues, and its association with prognosis in CRC patients was also analyzed. Immunoprecipitation, western blotting and in vitro kinase assay were constructed to investigate the molecular mechanisms. Results: IKKε co-localizes with F-actin and the invadopodia marker Tks5 at the gelatin-degrading sites of CRC cells. Genetic over-expression/knockdown or pharmacological inhibition of IKKε altered invadopodia formation and the migratory and invasive capacity of CRC cells in vitro. In vivo, knockdown or pharmacological inhibition of IKKε significantly suppressed metastasis of CRC cells in mice. IKKε knockdown also inhibited invadopodia formation in vivo. Clinical investigation of tumor specimens from 191 patients with CRC revealed that high IKKε expression correlates with metastasis and poor prognosis of CRC. Mechanistically, IKKε directly binds to and phosphorylates kindlin-2 at serine 159; this effect mediates the IKKε-induced invadopodia formation and promotion of CRC metastasis. Conclusions: We identify IKKε as a novel regulator of invadopodia formation and a unique mechanism by which IKKε promotes the metastasis of CRC. Our study suggests that IKKε is a potential target to suppress CRC metastasis.

Keywords: Colorectal cancer; IKKε; Invadopodia; Kindlin-2 phosphorylation; Metastasis.


Conflict of interest statement

Competing Interests: The authors have declared that no competing interest exists.

Figures

Figure 1
Figure 1
IKKε induces invadopodia formation and ECM degradation. (A) Tks5 and F-actin co-localization in HCT116 cells stably transfected with non-targeting shRNA or shRNA targeting IKKε (left). Inset shows magnified image of invadopodia in the box. Quantification of percentage of cells with invadopodia (right). (B) Gelatin degradation in HCT116 cells stably transfected with non-targeting shRNA or shRNA targeting IKKε (left). Quantification of the area of degraded gelatin per cell (right). (C) Tks5 and F-actin co-localization in HCT116 cells treated with DMSO or Amlexanox (100 μM) (left). Inset shows magnified image of invadopodia in the box. Quantification of percentage of cells with invadopodia (right). (D) Gelatin degradation in HCT116 cells treated with DMSO or Amlexanox (100 μM) (left). Quantification of the area of degraded gelatin per cell (right). (E) Tks5 and F-actin co-localization in SW480 cells stably transfected with vector, wild-type IKKε (WT) or mutant IKKε (K38A) (left). Inset shows magnified image of invadopodia in the box. Quantification of percentage of cells with invadopodia (right). (F) Gelatin degradation in SW480 cells stably transfected with vector, wild-type IKKε (WT) or mutant IKKε (K38A) (left). Quantification of the area of degraded gelatin per cell (right). All data represent the means±S.D. of three independent experiments (N>200 cells/sample, *P<0.05, **P< 0.01, and ***P < 0.001).
Figure 2
Figure 2
IKKε co-localizes with F-actin and Tks5 in active invadopodia. (A) F-actin (red), Tks5 (purple) and IKKε (blue) co-localization and gelatin (green) degradation in HCT116 cells. Inset highlight area of gelatin degradation where F-actin, Tks5 and IKKε are co-localized in the box. (B) Z-stack acquisition was performed and orthogonal views of the x-z plane and y-z plane are presented. Black arrows indicate areas of gelatin degradation where IKKε, Tks5 and F-actin co-localize. Scale bar, 10μm.
Figure 3
Figure 3
IKKε promotes the migratory and invasive ability of colorectal cancer cells. (A, B) Wound healing assay (A) and Transwell invasion (B) assays for SW480 cells stably transfected with vector, wild-type IKKε (WT) or mutant IKKε (K38A) (left). (A) The wound closure rate was determined as a percentage of the original wound area (right). (B) The relative invasive ability was normalized to vector (right). (C, D) Wound healing (C) and Transwell invasion (D) assay for HCT116 cells stably transfected with non-targeting shRNA or shRNA targeting IKKε (left). (C) The wound closure rate was determined as a percentage of the original wound area (right). (D) The relative invasive ability was normalized to shNC (right). (E, F) Wound healing (E) and Transwell invasion (F) assay for HCT116 cells treated with Amlexanox at the indicated concentrations (left). (E) The wound closure rate was determined as a percentage of the original wound area (right). Am. 50: amlexanox 50 μM; Am. 100: amlexanox 100 μM. (F)The relative invasive ability was normalized to DMSO (right). Am. 50: amlexanox 50 μM; Am. 100: amlexanox 100 μM. The cell number was counted in five randomly captured images for each sample. All data represent the means±S.D. of three independent experiments (**P< 0.01, and ***P < 0.001).
Figure 4
Figure 4
IKKε knockdown or inhibition suppressed colorectal cancer cells metastasis and invadopodia formation in vivo.(A) H&E staining of the cecum derived from mice orthotopically microinjected with HCT116 cells stably expressing shNC or shIKKε. Scale bar, 50 μm. (B) Immunofluorescent analysis of Tks5 and cortactin co-localization in cecum tumor sections from shNC and shIKKε mice (left). Quantification of cells with invadopodia (right). Scale bars represent 200 μm. (N>300 cells/sample, **P<0.01,). (C) The gross view of tumor nodules established in liver and the bioluminescence images of liver from mice orthotopic microinjected with HCT116 cells stably expressing shNC or shIKKε (left). Yellow arrowheads indicate tumor nodules in the liver. Quantitative analysis of photon flux in shNC (n=4) and shIKKε (n=4) mice (*P<0.05) (right). (D) H&E staining of the liver derived from mice which were orthotopic microinjected with HCT116 cells stably expressing shNC or shIKKε (left). Scale bar, 500 μm (left) and 50 μm (middle). Images for IHC staining of CK18 in in metastatic sites in liver (right) Scale bar, 50 μm. (E) Bioluminescence images of shNC and shIKKε mice (left). Quantitative analysis of photon flux in shNC (n=6) and shIKKε (n=8) mice (***P<0.001) (right). (F) Bioluminescence images of lungs, liver and kidneys isolated from shNC and shIKKε mice (left). Quantification of photon flux in lungs, livers and kidneys isolated from shNC (n=6) and shIKKε (n=8) mice (***P <0.001) (right). (G) H&E staining sections of the lung and kidney sections from shNC and shIKKε mice (left). Scale bar, 500 μm. Images for IHC staining of CK18 and EpCAM in metastatic sites in lung and kidney (middle and right). Scale bar, 50 μm. (H) Bioluminescence images of vehicle-treated or amlexanox-treated mice (left). Quantitative analysis of photon flux in vehicle-treated (n=6) and amlexanox-treated (50 mg/kg, n=8) mice (***P <0.001) (right). (I) Bioluminescence images of lungs, liver and kidneys isolated from vehicle-treated or amlexanox-treated mice (left). Quantification of photon flux in lungs, livers and kidneys isolated from vehicle-treated (n=6) and amlexanox-treated (n=8) mice (*P<0.05) (right). (J) H&E staining sections of the lung and kidney sections from vehicle-treated or amlexanox-treated mice (left). Scale bar, 500 μm. Images for IHC staining of CK18 and EpCAM in in metastatic sites in lung and kidney (middle and right). Scale bar, 50 μm.
Figure 5
Figure 5
High IKKε expression correlates with metastasis and poor prognosis in human colorectal cancer. (A) Immunohistochemical staining for IKKε expression in human colorectal cancer tissues and paired adjacent tissues. Scale bar, 200 μm. (B) IKKε protein levels in 161 paired human colorectal cancer tissues and the adjacent normal tissues, measured by immunohistochemical analysis (***P <0.001). (C) Immunohistochemical staining for IKKε expression in human colorectal cancer tissue. Scale bar, 200 μm (top) and 100 μm (bottom). (D) IKKε protein levels in cancer tissues according to lymph node metastasis. (N classification) (**P<0.01). (E) Kaplan-Meier analysis of overall survival in a set of 191 colorectal cancer patients according to IKKε expression (log-rank test, p=0.001).
Figure 6
Figure 6
IKKε directly phosphorylates kindlin-2 at S159. (A) Slot blot analysis of the anti-phospho-kindlin-2-S159 antibody. The antibody was probed against an un-modified kindlin-2 peptide and phosphorylated peptides. (B) HCT116 cells were transfected with the indicated plasmids and whole cell extracts were immunoprecipitated (IP) with FLAG-conjugated M2 beads and then analyzed by immunoblotting (IB). (C)HCT116 cells were treated with the inhibitor IKK-3 at the indicated concentration for 24h and analyzed by immunoblotting. (D and E) HCT116 cells were transfected with the indicated siRNAs targeting IKKα, IKKβ, IKKε or TBK1. Cell lysates were analyzed by immunoblotting. (F) HCT116 cells were transfected with FLAG-tagged kindlin-2 and GFP-tagged IKKε for 48 h. Total cell lysates were immunoprecipitated using FLAG-conjugated M2 beads and analyzed by immunoblotting. (G) IKKε was immunoprecipitated using anti-IKKε antibody or the control antibody IgG from lysates of HCT116 cells. (H) HCT116 cells were transfected with the indicated plasmids and the whole cell extracts were prepared and analyzed by Co-IP assay flowed by immunoblotting with the indicated antibodies. (I) GST-tagged wild-type kindlin-2 or kindlin-2 (S159A) were incubated without IKKε (-), or with purified wild-type IKKε (WT) or mutant IKKε (K38A) in kinase buffer and resolved by SDS-PAGE, followed by immunoblotting analysis with the indicated antibodies.
Figure 7
Figure 7
IKKε-induced invadopodia formation depends on kindlin-2 S159 phosphorylation. (A) HCT116 cells were transfected with GFP-tagged IKKε and stained with antibodies against kindlin-2, Tks5 and F-actin (phalloidin). Confocal images were acquired to visualize the localization of IKKε, kindlin-2, Tks5 and F-actin. White arrowhead point to the co-localization of IKKε, kindlin-2, Tks5 and F-actin. Scale bar, 10 μm. (B) Co-localization of Tks5 and F-actin in HCT116 cells with kindlin-2 knockout and rescue with wild-type IKKε, wild-type kindlin-2, phosphor-null mutant kindlin-2 (S159A) and phosphor-mimetic mutant (S159D) kindlin-2 (left). Inset shows magnified image of invadopodia in the box. Quantification of cells with invadopodia (right). (C) Gelatin degradation in HCT116 cells with kindlin-2 knockout and rescue with wild-type IKKε, wild-type kindlin-2, phosphor-null mutant kindlin-2 (S159A) and phosphor-mimetic mutant (S159D) kindlin-2 (left). The area of degraded gelatin per cell (right). All data represent the means ± S.D. (N>400 cells/sample, *P<0.05, **P< 0.01, and ***P < 0.001).
Figure 8
Figure 8
Phosphorylated kindlin-2 (S159) levels positively correlate with IKKε expression in colorectal cancer tissues. (A) Immunohistochemical staining for phosphor-kindlin-2-S159 in human colorectal cancer tissues and paired adjacent normal tissues. Scale bar, 200 μm. (B) Phosphor-kindlin-2-S159 protein levels in 161 paired human colorectal cancer tissues and adjacent normal tissues as measured by immunohistochemical analysis. The data represent the means ± S.D. (***P < 0.001). (C) Representative images of paraffin tissue sections stained with IKKε and phosphorylated kindlin-2 (S159) antibody. Scale bar, 200 μm. (D) Correlation analyses of IKKε and phosphorylated kindin-2 (S159) protein levels in human colorectal cancer specimens.

Similar articles

Cited by

References

    1. Bray F, Ferlay J, Soerjomataram I, Siegel RL, Torre LA, Jemal A. Global cancer statistics 2018: GLOBOCAN estimates of incidence and mortality worldwide for 36 cancers in 185 countries. CA Cancer J Clin. 2018;68:394–424. - PubMed
    1. Chiang AC, Massague J. Molecular basis of metastasis. N Engl J Med. 2008;359:2814–23. - PMC - PubMed
    1. Eddy RJ, Weidmann MD, Sharma VP, Condeelis JS. Tumor Cell Invadopodia: Invasive Protrusions that Orchestrate Metastasis. Trends Cell Biol. 2017;27:595–607. - PMC - PubMed
    1. Murphy DA, Courtneidge SA. The 'ins' and 'outs' of podosomes and invadopodia: characteristics, formation and function. Nat Rev Mol Cell Biol. 2011;12:413–26. - PMC - PubMed
    1. Yamaguchi H. Pathological roles of invadopodia in cancer invasion and metastasis. Eur J Cell Biol. 2012;91:902–7. - PubMed

Publication types

MeSH terms