

Construction and Comprehensive Analyses of a Competing Endogenous RNA Network in Tumor-Node-Metastasis Stage I Hepatocellular Carcinoma
- PMID: 32104698
- PMCID: PMC7036093
- DOI: 10.1155/2020/5831064
Construction and Comprehensive Analyses of a Competing Endogenous RNA Network in Tumor-Node-Metastasis Stage I Hepatocellular Carcinoma
Abstract
Background: Long noncoding RNAs (lncRNAs) can function as competing endogenous RNAs (ceRNAs) and interact with microRNAs (miRNAs) to regulate target gene expression, which can greatly influence tumor development and progression. Different tumor-node-metastasis (TNM) stages of hepatocellular carcinoma (HCC) defined by the American Joint Committee on Cancer (AJCC) have different clinical results. Our purpose was to comprehensively analyze differentially expressed (DE) lncRNAs, miRNAs, and mRNAs in stage I HCC and identify prognosis-associated RNAs.
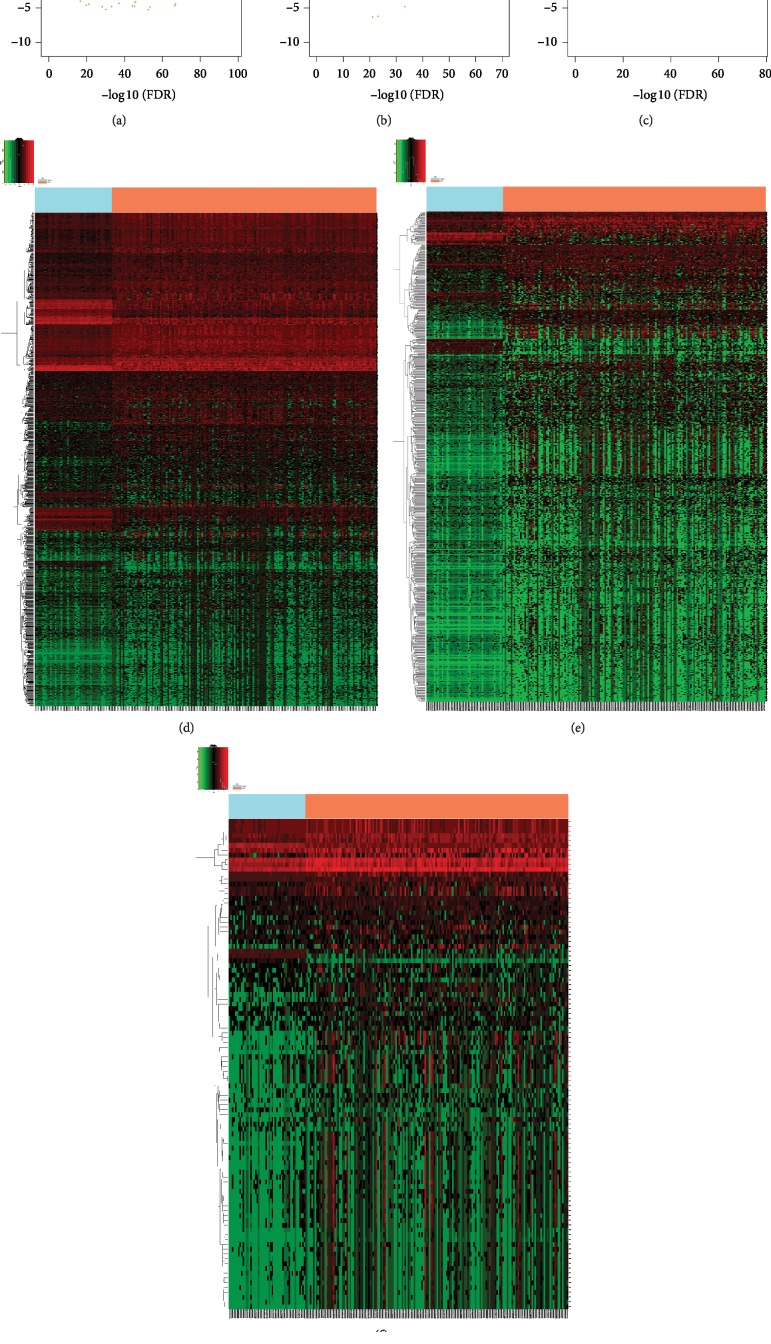
Methods: RNA-seq data were obtained from The Cancer Genome Atlas (TCGA) database. A stage I HCC-associated miRNA-lncRNA-mRNA network was constructed. Next, Gene Ontology (GO) and Kyoto Encyclopedia of Genes and Genomes (KEGG) enrichment pathway analyses of ceRNA-associated DEmRNAs were performed using Database for Annotation, Visualization, and Integrated Discovery (DAVID) 6.8 and Clusterprofile in the R package. The protein-protein interaction (PPI) network of the above mRNAs was then constructed using STRING. Finally, the association between lncRNAs and mRNAs in the ceRNA network and prognosis of patients was further analyzed. Linear regression analysis of the above lncRNAs and mRNAs associated with overall survival was performed.
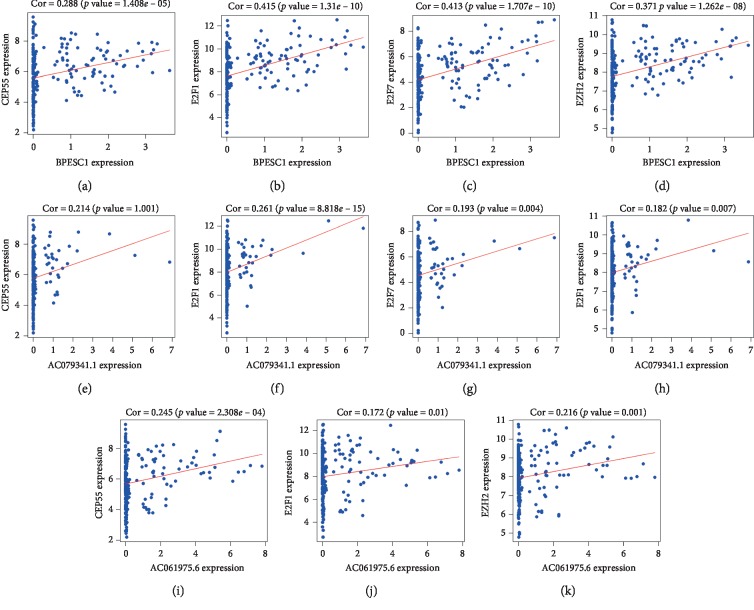
Results: After a comparison between HCC and adjacent nontumor tissues, 778 lncRNAs, 1608 mRNAs, and 102 miRNAs that were abnormally expressed were identified. The ceRNA network was composed of 56 DElncRNAs, 14 DEmiRNAs, and 30 DEmRNAs. Functional analysis results showed that 30 DEmRNAs were enriched in 14 GO biological process categories and 6 KEGG categories (false discovery rate (FDR) < 0.05). A PPI network was composed of 22 nodes and 58 edges. We detected 4 DElncRNAs (BPESC1, AC061975.6, AC079341.1, and CLLU1) and 6 DEmRNAs (CEP55, E2F1, E2F7, EZH2, G6PD, and SLC7A11) that had significant influences on the overall survival (OS) of stage I HCC patients (P < 0.05). lncRNA BPESC1 was positively correlated with mRNA CEP55 via miR-424, and lncRNA AC061975.6 was positively correlated with mRNA E2F1 via miR-519d.
Conclusion: Our study identified novel lncRNAs and mRNAs that were associated with the progression and prognosis of stage I HCC and further investigated the regulatory mechanism of lncRNA-mediated ceRNAs in the development of stage I HCC.
Copyright © 2020 Xuefeng Gu et al.
Conflict of interest statement
There are no conflicts of interest regarding the publication of this paper.
Figures


Similar articles
-
Construction of a ceRNA network and a genomic-clinicopathologic nomogram to predict survival for HBV-related HCC.Hum Cell. 2021 Nov;34(6):1830-1842. doi: 10.1007/s13577-021-00607-y. Epub 2021 Sep 6. Hum Cell. 2021. PMID: 34487338
-
Screening Prognosis-Related lncRNAs Based on WGCNA to Establish a New Risk Score for Predicting Prognosis in Patients with Hepatocellular Carcinoma.J Immunol Res. 2021 Aug 14;2021:5518908. doi: 10.1155/2021/5518908. eCollection 2021. J Immunol Res. 2021. PMID: 34426790 Free PMC article.
-
Genome-Wide Analysis of Prognostic lncRNAs, miRNAs, and mRNAs Forming a Competing Endogenous RNA Network in Hepatocellular Carcinoma.Cell Physiol Biochem. 2018;48(5):1953-1967. doi: 10.1159/000492519. Epub 2018 Aug 9. Cell Physiol Biochem. 2018. PMID: 30092571
-
Reconstruction and Analysis of the Differentially Expressed IncRNA-miRNA-mRNA Network Based on Competitive Endogenous RNA in Hepatocellular Carcinoma.Crit Rev Eukaryot Gene Expr. 2019;29(6):539-549. doi: 10.1615/CritRevEukaryotGeneExpr.2019028740. Crit Rev Eukaryot Gene Expr. 2019. PMID: 32422009 Review.
-
Identification of MFI2-AS1, a Novel Pivotal lncRNA for Prognosis of Stage III/IV Colorectal Cancer.Dig Dis Sci. 2020 Dec;65(12):3538-3550. doi: 10.1007/s10620-020-06064-1. Epub 2020 Jan 20. Dig Dis Sci. 2020. PMID: 31960204 Review.
Cited by
-
Identification of Biomarkers to Construct a Competing Endogenous RNA Network and Establishment of a Genomic-Clinicopathologic Nomogram to Predict Survival for Children with Rhabdoid Tumors of the Kidney.Biomed Res Int. 2020 Aug 26;2020:5843874. doi: 10.1155/2020/5843874. eCollection 2020. Biomed Res Int. 2020. PMID: 32908900 Free PMC article.
-
The effects of gut microbiota colonizing on the porcine hypothalamus revealed by whole transcriptome analysis.Front Microbiol. 2022 Oct 13;13:970470. doi: 10.3389/fmicb.2022.970470. eCollection 2022. Front Microbiol. 2022. PMID: 36312924 Free PMC article.
-
Cuproptosis-related ceRNA axis triggers cell proliferation and cell cycle through CBX2 in lung adenocarcinoma.BMC Pulm Med. 2024 Feb 14;24(1):85. doi: 10.1186/s12890-024-02887-0. BMC Pulm Med. 2024. PMID: 38355480 Free PMC article.
-
Identification of Prognostic Biomarkers and Correlation With Immune Infiltrates in Hepatocellular Carcinoma Based on a Competing Endogenous RNA Network.Front Genet. 2021 May 20;12:591623. doi: 10.3389/fgene.2021.591623. eCollection 2021. Front Genet. 2021. PMID: 34093635 Free PMC article.
-
Construction and systematic evaluation of a machine learning-based cuproptosis-related lncRNA score signature to predict the response to immunotherapy in hepatocellular carcinoma.Front Immunol. 2023 Jan 25;14:1097075. doi: 10.3389/fimmu.2023.1097075. eCollection 2023. Front Immunol. 2023. PMID: 36761763 Free PMC article.
References
MeSH terms
Substances
LinkOut - more resources
Full Text Sources
Medical
Miscellaneous
