. 2020 Sep 1;69(5):973-986.
doi: 10.1093/sysbio/syaa016.

A Multitype Birth-Death Model for Bayesian Inference of Lineage-Specific Birth and Death Rates

Affiliations

A Multitype Birth-Death Model for Bayesian Inference of Lineage-Specific Birth and Death Rates

Joëlle Barido-Sottani et al. Syst Biol. .

Abstract

Heterogeneous populations can lead to important differences in birth and death rates across a phylogeny. Taking this heterogeneity into account is necessary to obtain accurate estimates of the underlying population dynamics. We present a new multitype birth-death model (MTBD) that can estimate lineage-specific birth and death rates. This corresponds to estimating lineage-dependent speciation and extinction rates for species phylogenies, and lineage-dependent transmission and recovery rates for pathogen transmission trees. In contrast with previous models, we do not presume to know the trait driving the rate differences, nor do we prohibit the same rates from appearing in different parts of the phylogeny. Using simulated data sets, we show that the MTBD model can reliably infer the presence of multiple evolutionary regimes, their positions in the tree, and the birth and death rates associated with each. We also present a reanalysis of two empirical data sets and compare the results obtained by MTBD and by the existing software BAMM. We compare two implementations of the model, one exact and one approximate (assuming that no rate changes occur in the extinct parts of the tree), and show that the approximation only slightly affects results. The MTBD model is implemented as a package in the Bayesian inference software BEAST 2 and allows joint inference of the phylogeny and the model parameters.[Birth-death; lineage specific rates, multi-type model.].


Figures

Figure 1.
Figure 1.
Visual representation of the MTBD model on a complete tree (left) with sampling events indicated in orange, and on the corresponding reconstructed tree (right). Each type is represented by a color: the ancestral type, in black, starts at the root. The other types, in blue, red, and green, start at change points along the tree. The same type can be present in multiple clades along the tree, such as the blue type in the complete tree.
Figure 2.
Figure 2.
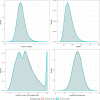
Comparison of the distributions of multiple summary statistics on trees obtained from forward simulation (in green) and MCMC sampling from the prior (in red) under a pure-birth MTBD process.
Figure 3.
Figure 3.
Performance of the birth, death, and type change rates inference on different data sets, measured by the relative error (absolute difference between the estimate and the true value, divided by the true value) and the coverage (proportion of 95% HPDs which contain the true value). All measures are averages over 100 trees, with 200 tips for the data sets with 1 or 2 types and 500 tips for the data set with 5 types. Tip errors are averaged over all tips, while tree errors are averaged over all edges, weighted by the edge lengths.
Figure 4.
Figure 4.
Performance of the type number and coloring inference on different data sets, measured by the VI distance (difference between the true and estimated type partitions of tips) and the difference between true and estimated number of types. Measures are shown for the original true tree, and for the true tree recolored to remove small clades. All measures are averages over 100 trees, with 200 tips for the data sets with 1 or 2 types and 500 tips for the data set with 5 types.
Figure 5.
Figure 5.
Posterior support for pairs of tips being inferred in the same type over different data sets. Measures are shown for the original true tree, and for the true tree recolored to remove small clades. All measures are averages over 100 trees, with 200 tips for the data sets with 1 or 2 types and 500 tips for the data set with 5 types.
Figure 6.
Figure 6.
Kernel density estimation of a bimodal posterior distribution of the birth rate on one tip of the tree, as inferred by the MTBD method.
Figure 7.
Figure 7.
Empirical hummingbirds phylogeny (a, c) and lizards phylogeny (b, d) colored by the median diversification rate inferred by MTBD for each edge. Inferences were run with a prior favoring low values of formula image (a, b) or higher values of formula image (c, d).

References

    1. Beaulieu J.M., O’Meara B.C.. 2016. Detecting hidden diversification shifts in models of trait-dependent speciation and extinction. Syst. Biol. 65: 583–601. - PubMed
    1. Bouckaert R., Heled J., Kühnert D., Vaughan T., Wu C.-H., Xie D., Suchard M. A., Rambaut A., Drummond A. J.. 2014. Beast 2: a software platform for Bayesian evolutionary analysis. PLoS Comput. Biol., 10:1–6. - PMC - PubMed
    1. Felsenstein J. 1981. Evolutionary trees from DNA sequences: a maximum likelihood approach. J. Mol. Evol., 17:368–376. - PubMed
    1. FitzJohn R. G. 2012. Diversitree: comparative phylogenetic analyses of diversification in R. Methods Ecol. Evol., 3:1084–1092.
    1. FitzJohn R. G., Maddison W. P., Otto S. P.. 2009. Estimating trait-dependent speciation and extinction rates from incompletely resolved phylogenies. Syst. Biol., 58:595–611. - PubMed

Publication types