. 2020 Mar 27;23(3):100907.
doi: 10.1016/j.isci.2020.100907. Epub 2020 Feb 13.

Integrin Binding Dynamics Modulate Ligand-Specific Mechanosensing in Mammary Gland Fibroblasts

Affiliations

Integrin Binding Dynamics Modulate Ligand-Specific Mechanosensing in Mammary Gland Fibroblasts

Martina Lerche et al. iScience. .

Erratum in

Abstract

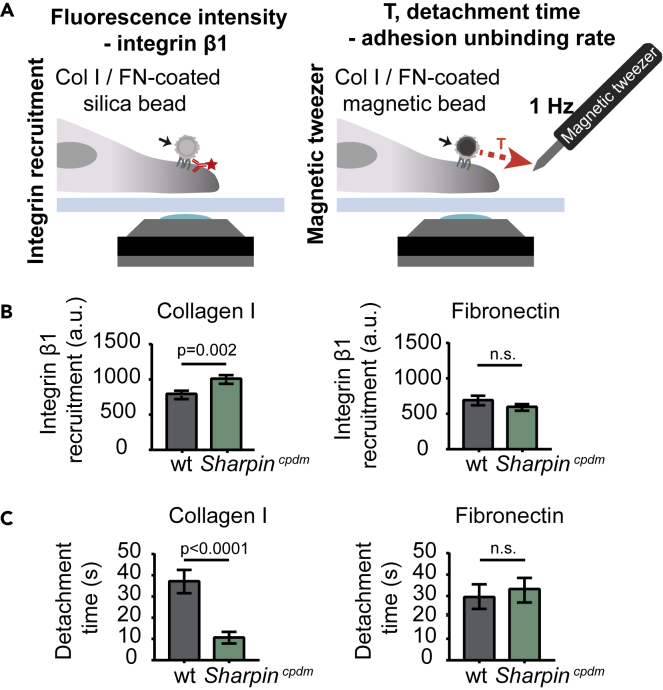
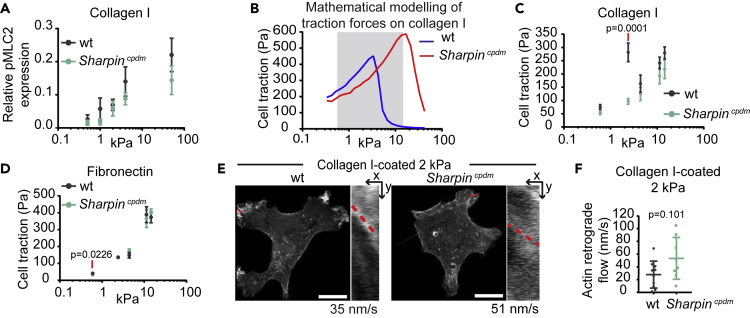
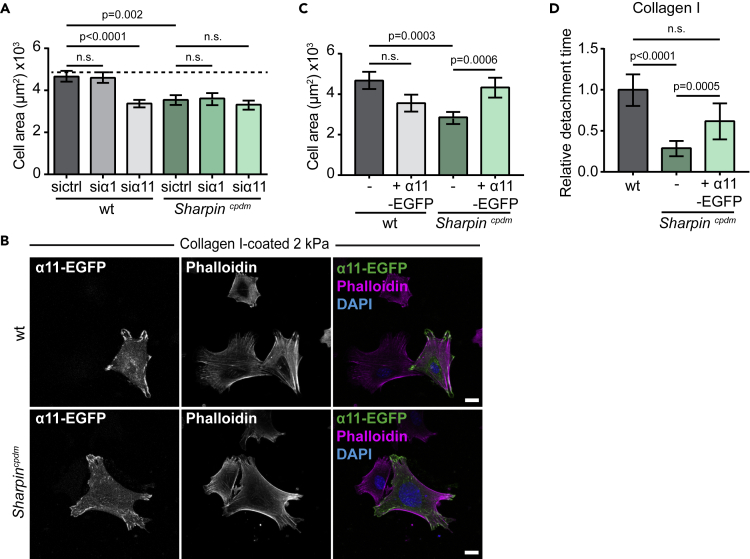
The link between integrin activity regulation and cellular mechanosensing of tissue rigidity, especially on different extracellular matrix ligands, remains poorly understood. Here, we find that primary mouse mammary gland stromal fibroblasts (MSFs) are able to spread efficiently, generate high forces, and display nuclear YAP on soft collagen-coated substrates, resembling the soft mammary gland tissue. We describe that loss of the integrin inhibitor, SHARPIN, impedes MSF spreading specifically on soft type I collagen but not on fibronectin. Through quantitative experiments and computational modeling, we find that SHARPIN-deficient MSFs display faster force-induced unbinding of adhesions from collagen-coated beads. Faster unbinding, in turn, impairs force transmission in these cells, particularly, at the stiffness optimum observed for wild-type cells. Mechanistically, we link the impaired mechanotransduction of SHARPIN-deficient cells on collagen to reduced levels of collagen-binding integrin α11β1. Thus integrin activity regulation and α11β1 play a role in collagen-specific mechanosensing in MSFs.

Keywords: Biological Sciences; Cell Biology; Functional Aspects of Cell Biology.


Conflict of interest statement

Declaration of Interests The authors declare no competing interests.

Figures

None
Graphical abstract
Figure 1
Figure 1
Increased Integrin Activity Correlates with Reduced Spreading of MSFs on Soft Collagen I (A) Quantification of relative integrin β1 activity [active (clone, 9EG7)/total (clone, HMβ1-1)] cell-surface levels (n = 7 independent experiments) in Sharpincpdm compared with wild-type MSFs by flow cytometry. (B) Representative images of wild-type and Sharpincpdm MSFs plated for 3–4 h on 2 kPa fibronectin (upper panel) or collagen I (lower panel)-coated polyacrylamide (PAA) hydrogels and labeled for F-actin (white) and nuclei (blue). Cell edges are outlined with yellow dashed lines. (C) Quantification of cell spreading in wild-type compared with Sharpincpdm MSFs on 0.8, 2, 4, and 13 kPa PAA hydrogels coated with fibronectin (upper panel) or collagen I (lower panel) based on immunofluorescence. Data are pooled from three independent experiments, nwt= 90, 95, 103, 88 and nSharpincpdm= 72, 80, 93, 88 cells (fibronectin, from left to right) and nwt= 64, 105, 91, 109 and nSharpincpdm= 59, 118, 97, 77 cells (collagen I, from left to right). (D) Representative output images of FA analysis for individual cells plated on 2 kPa collagen-I-coated PAA hydrogels (FA, red; cell borders, black). (E and F) Quantification of the number of FA per cell (E) and the length of FA (F) in wild-type compared with Sharpincpdm MSFs plated on collagen-I-coated 0.8, 2, 4, and 13 kPa PAA hydrogels. Data are pooled from three independent experiments, nwt= 64, 94, 73, 83, nSharpincpdm= 59, 97, 73, 56 cells (# Adhesion per cell, from left to right), and nwt= 41, 94, 73, 109 and nSharpincpdm= 42, 98, 74, 73 cells (Adhesion length, from left to right). Mean ± SEM in all graphs. Mann–Whitney U-test; red lines below p values indicate the data points compared. Scale bars: 20 μm. See also Figure S1.
Figure 2
Figure 2
SHARPIN-Deficient MSFs Show Faster Integrin-Collagen Binding Dynamics (A) Schematic representation of the set up for integrin recruitment (left panel) and magnetic tweezer (right panel) experiments. (B) Quantification of integrin β1 recruitment to collagen I (left panel) or fibronectin (right panel)-coated silica beads; nwt = 62 and nSharpincpdm = 51 cells (collagen I) and nwt = 33 and nSharpincpdm = 24 cells (fibronectin) from two independent experiments. (C) Quantification of detachment time of wild-type and Sharpincpdm MSFs from collagen I (left panel) or fibronectin (right panel)-coated magnetic beads; nwt and nSharpincpdm = 34 cells (collagen) and nwt = 29 and nSharpincpdm = 37 cells (fibronectin) from two independent experiments. Mean ± SEM in all graphs. Unpaired t test. Col I, collagen I; FN, fibronectin.
Figure 3
Figure 3
Molecular Clutch Model Predicts the Absence of Traction Peak in SHARPIN-Deficient Cells at Biologically Relevant Rigidities (A) Quantification of relative pMLC2 expression levels in wild-type compared with Sharpincpdm MSFs plated on collagen-I-coated PAA hydrogels with the indicated stiffness; n = 3 independent experiments. (B) Prediction of the traction forces generated by wild-type and Sharpincpdm MSFs on collagen-I-coated PAA hydrogels based on the molecular clutch model. The stiffness range covered in (C) is highlighted. (C) Average forces exerted by wild-type compared with Sharpincpdm MSFs on collagen-I-coated PAA hydrogels with the indicated stiffness measured by traction force microscopy, nwt = 20, 20, 21, 20, 19 and nSharpincpdm = 18, 25, 21, 18, 17 cells (from left to right) from two independent experiments. (D) Average forces exerted by wild-type compared with Sharpincpdm MSFs on fibronectin-coated PAA hydrogels with the indicated stiffness measured by traction force microscopy, nwt= 11, 11, 23, 14, 10 and nSharpincpdm= 10, 13, 23, 11, 10 cells (from left to right) from two independent experiments. (E) Representative images of Lifeact-GFP-transfected wild-type and Sharpincpdm MSFs plated on 2 kPa collagen-I-coated PAA hydrogels. Insets are kymographs showing actin retrograde flow along the red line (time = 125s, imaged every second). The slope of the line was used to calculate the actin retrograde flow rate. (F) Quantification of actin retrograde flow in wild-type compared with Sharpincpdm MSFs, nwt = 10 and nSharpincpdm = 8 cells (1 measurement/cell), from three independent experiments. Mean ± SEM in all graphs. Mann–Whitney U-test, red lines below p values indicate the data points compared. Scale bars: 10 μm. See also Figure S2 and Table S1.
Figure 4
Figure 4
SHARPIN Regulates Integrin α11β1 Protein Levels (A) Analysis of cell-surface expression (median fluorescence) of integrin α1 and α11 in Sharpincpdm relative to wild-type MSFs, nItga1 =6 and nItga11 = 8 from six independent flow cytometry experiments. (B and C) (B) Representative Western blot analysis of integrin α11 protein expression in wild-type and Sharpincpdm MSFs and (C) quantification of the relative integrin α11 expression levels, nwt and nSharpincpdm = 7 from five independent experiments. GAPDH was detected for loading control. (D) Representative images of immunolabelled integrin α11 (green) and total integrin β1 (magenta) in wild-type and Sharpincpdm MSFs plated on 2 kPa collagen-I-coated PAA hydrogels. Nuclei (blue) were co-labeled. (E and F) (E) Representative Western blot analysis of integrin α11 and SHARPIN protein expression in wild-type MSFs silenced with control or SHARPIN-targeting siRNA and (F) quantification of the relative integrin α11 expression levels; n = 5 independent experiments. GAPDH was detected for loading control. (G) Representative images of immunolabelled integrin α11 (green) and the lysosomal marker Lamp1 (magenta) in control-treated (ctrl) or Bafilomycin A1-treated (100 nM, 6h) wild-type and Sharpincpdm MSFs plated on collagen. Region of interest (yellow) shows examples of co-localization (white spots, highlighted with red arrow). (H) Quantification of relative (to wt control) co-localization of integrin α11 and Lamp1 in control-treated or Bafilomycin-A1-treated wild-type and Sharpincpdm MSFs plated on collagen; n = 76, 102, 89, 125 cells (from left to right) pooled from three independent experiments; line under p value indicates which samples are compared with each other. Mean ± SEM in all graphs. (A) Wilcoxon matched-pairs signed rank test. (C, F, and H) Mann-Whitney U-test. Scale bars: 20 μm. See also Figure S3.
Figure 5
Figure 5
Integrin α11β1 Regulates the Spreading of MSFs on Soft Matrices (A) Quantification of the cell area in wild-type and Sharpincpdm MSFs silenced with control, integrin α1, or integrin α11 targeting siRNA and plated on 2 kPa collagen-I-coated PAA hydrogels; n = 94, 91, 93, 82, 88, 90 cells (from left to right) from three independent experiments. (B) Representative images of integrin α11-EGFP-transfected wild-type and Sharpincpdm MSFs plated on 2 kPa collagen-I-coated PAA hydrogels and co-labeled for F-actin (magenta) and nuclei (blue). (C) Quantification of cell area in non-transfected and integrin α11-EGFP-transfected wild-type and Sharpincpdm MSFs plated on 2 kPa collagen-I-coated PAA hydrogels. Data are pooled from two independent experiments; n = 37, 31, 46, 48 cells (from left to right). (D) Quantification of detachment time of wild-type, Sharpincpdm, and integrin α11-EGFP-transfected Sharpincpdm MSFs from collagen-I-coated magnetic beads. Data are pooled from three independent experiments; n = 91, 101, 46 cells (from left to right). Mean ± SEM in all graphs. (A) Unpaired t test. (C and D) Mann-Whitney U-test. Line under p value indicates which samples are compared with each other. Scale bars: 20 μm. See also Figure S3.

References

    1. Abair T.D., Sundaramoorthy M., Chen D., Heino J., Ivaska J., Hudson B.G., Sanders C.R., Pozzi A., Zent R. Cross-talk between integrins alpha1beta1 and alpha2beta1 in renal epithelial cells. Exp. CellRes. 2008;314:3593–3604. - PMC - PubMed
    1. Arjonen A., Alanko J., Veltel S., Ivaska J. Distinct recycling of active and inactive β1 integrins. Traffic. 2012;13:610–625. - PMC - PubMed
    1. Bangasser B.L., Shamsan G.A., Chan C.E., Opoku K.N., Tüzel E., Schlichtmann B.W., Kasim J.A., Fuller B.J., McCullough B.R., Rosenfeld S.S., Odde D.J. Shifting the optimal stiffness for cell migration. Nat. Commun. 2017;8:15313. - PMC - PubMed
    1. Bangasser B.L., Rosenfeld S.S., Odde D.J. Determinants of maximal force transmission in a motor-clutch model of cell traction in a compliant microenvironment. Biophys. J. 2013;105:581–592. - PMC - PubMed
    1. Bansal R., Nakagawa S., Yazdani S., van Baarlen J., Venkatesh A., Koh A.P., Song W., Goossens N., Watanabe H., Beasley M.B. Integrin alpha 11 in the regulation of the myofibroblast phenotype: implications for fibrotic diseases. Exp. Mol. Med. 2017;49:e396. - PMC - PubMed

LinkOut - more resources