. 2020 Apr;580(7802):269-273.
doi: 10.1038/s41586-020-2080-8. Epub 2020 Feb 27.

Mutational signature in colorectal cancer caused by genotoxic pks+ E. coli

Collaborators, Affiliations

Mutational signature in colorectal cancer caused by genotoxic pks+ E. coli

Cayetano Pleguezuelos-Manzano et al. Nature. 2020 Apr.

Abstract

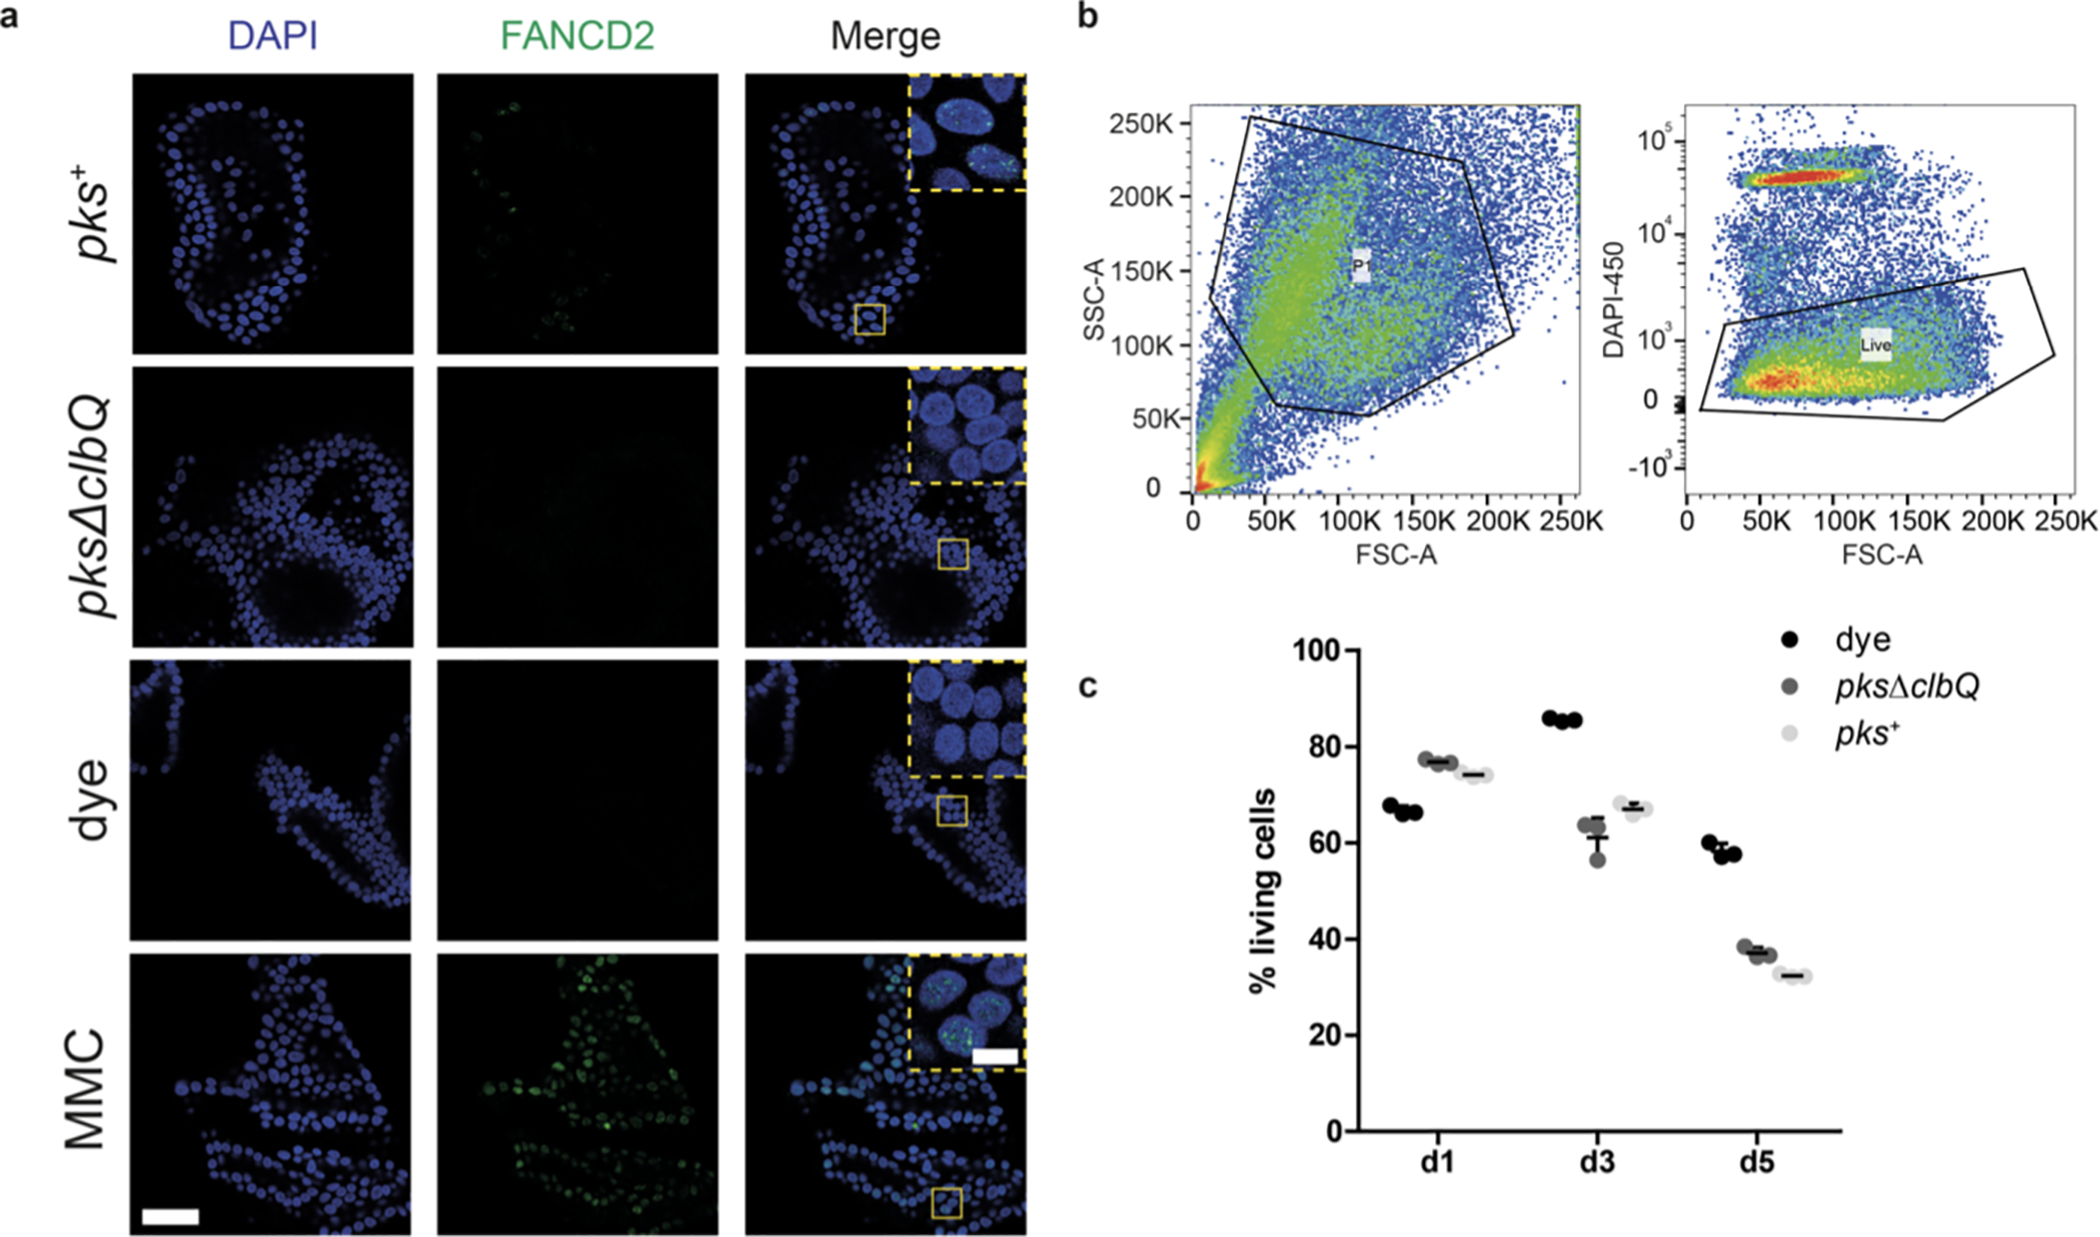
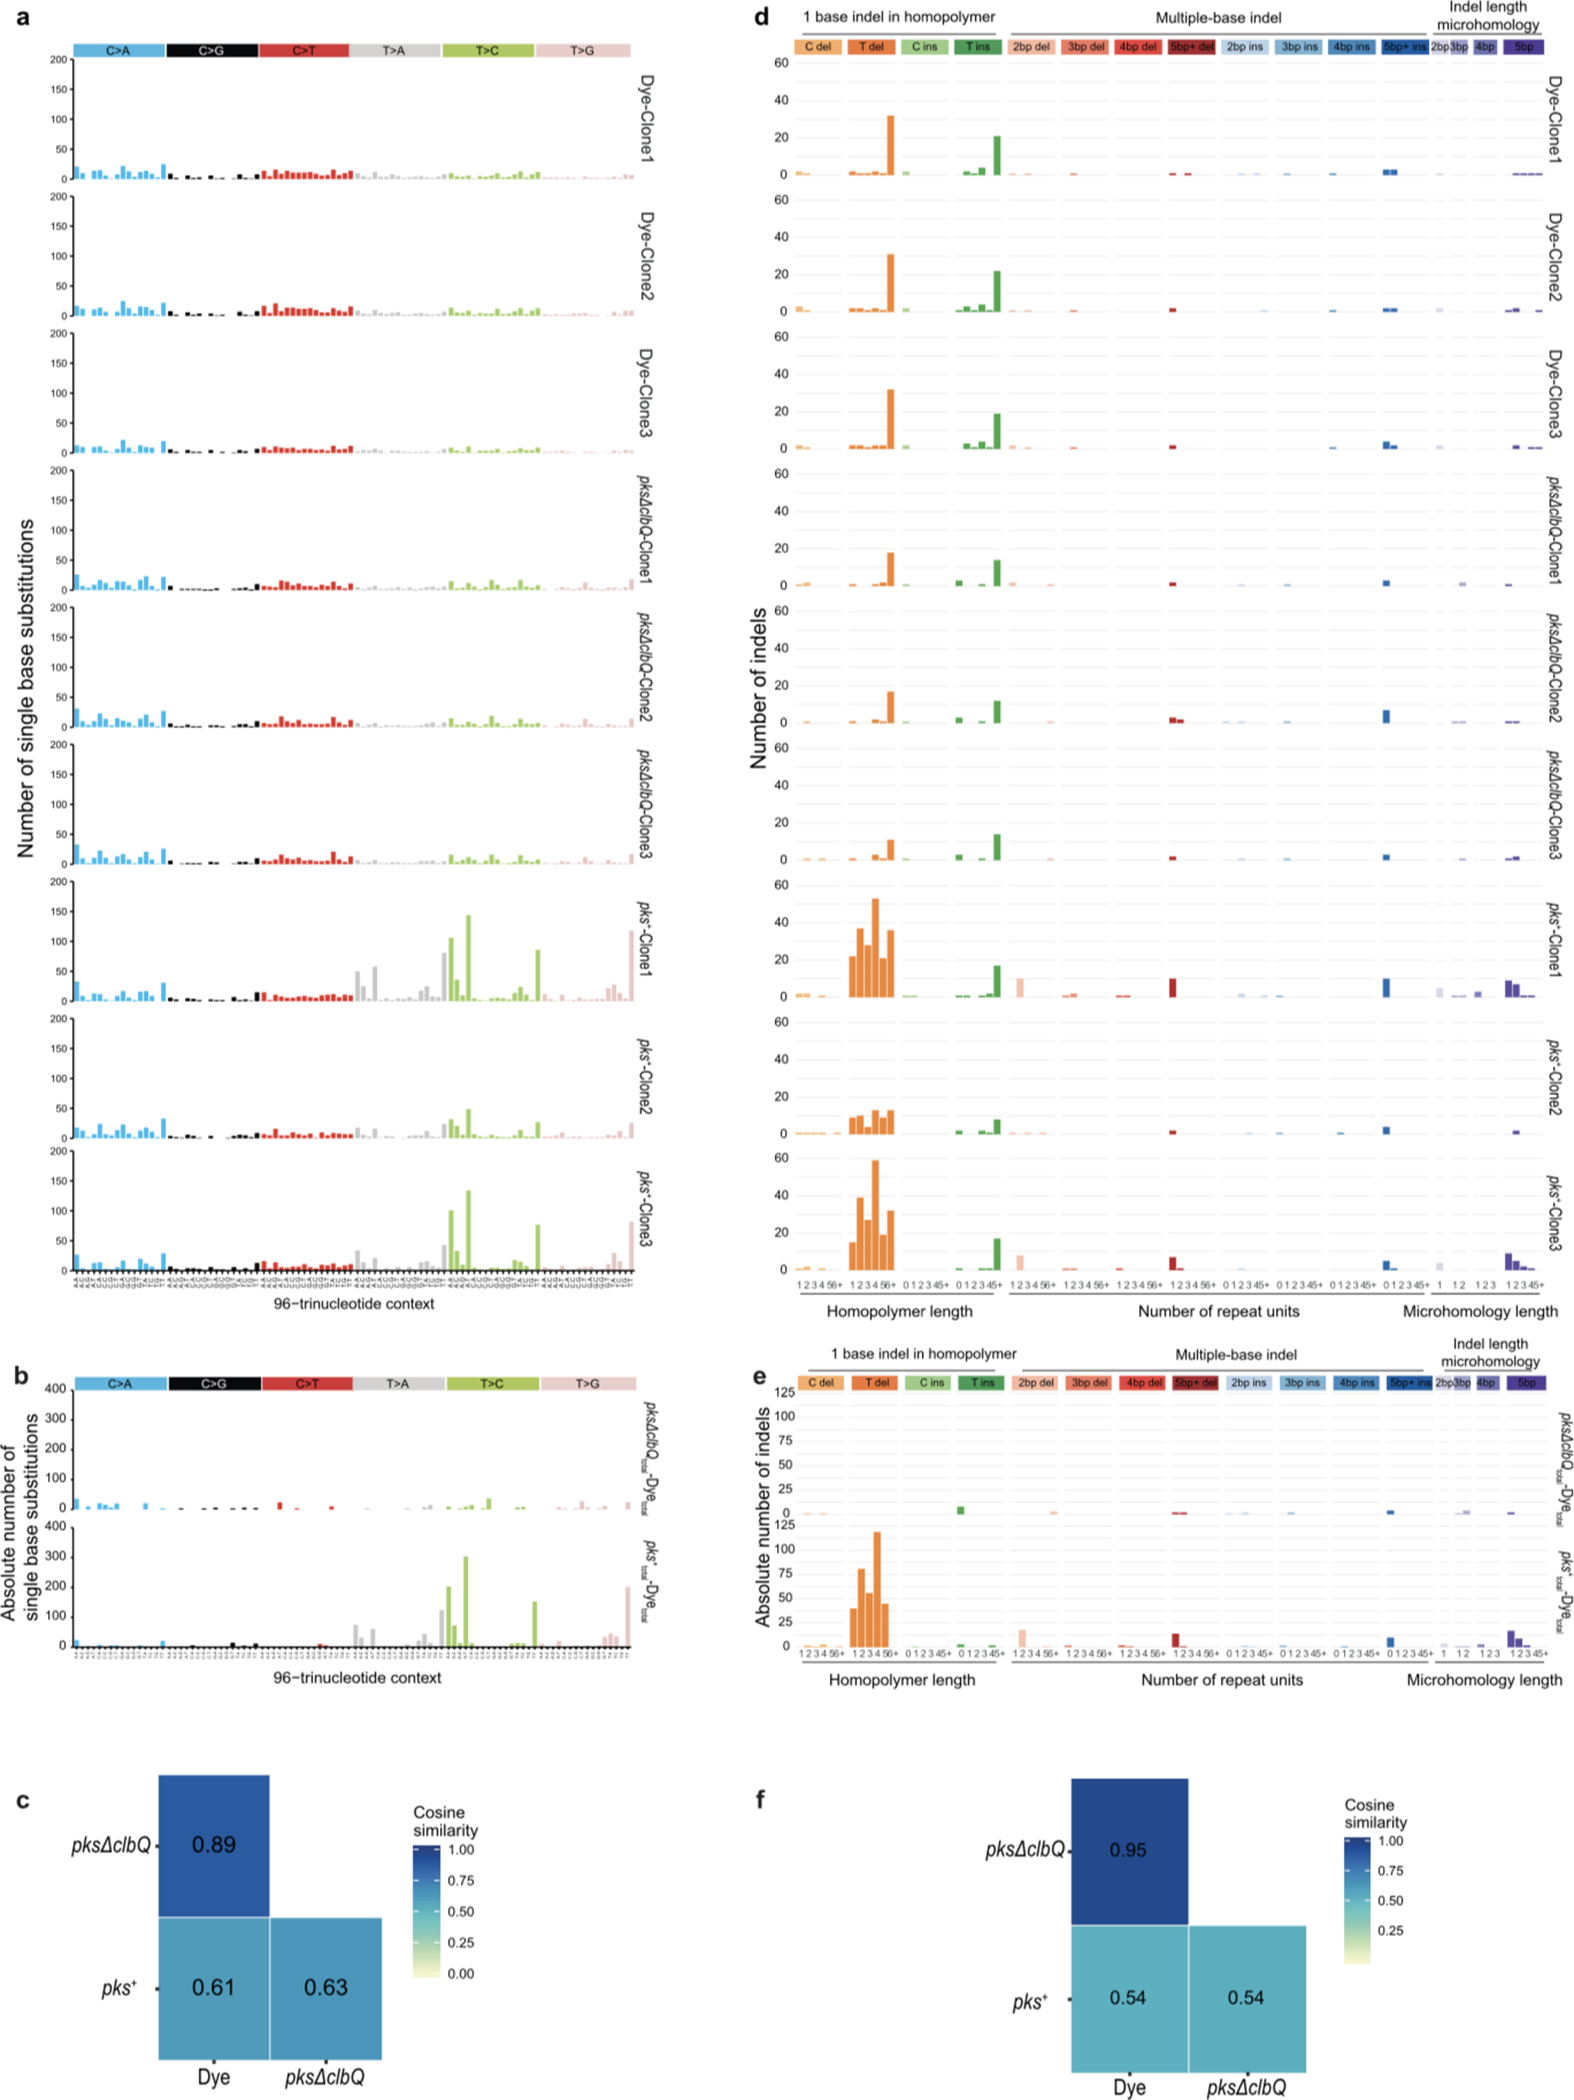
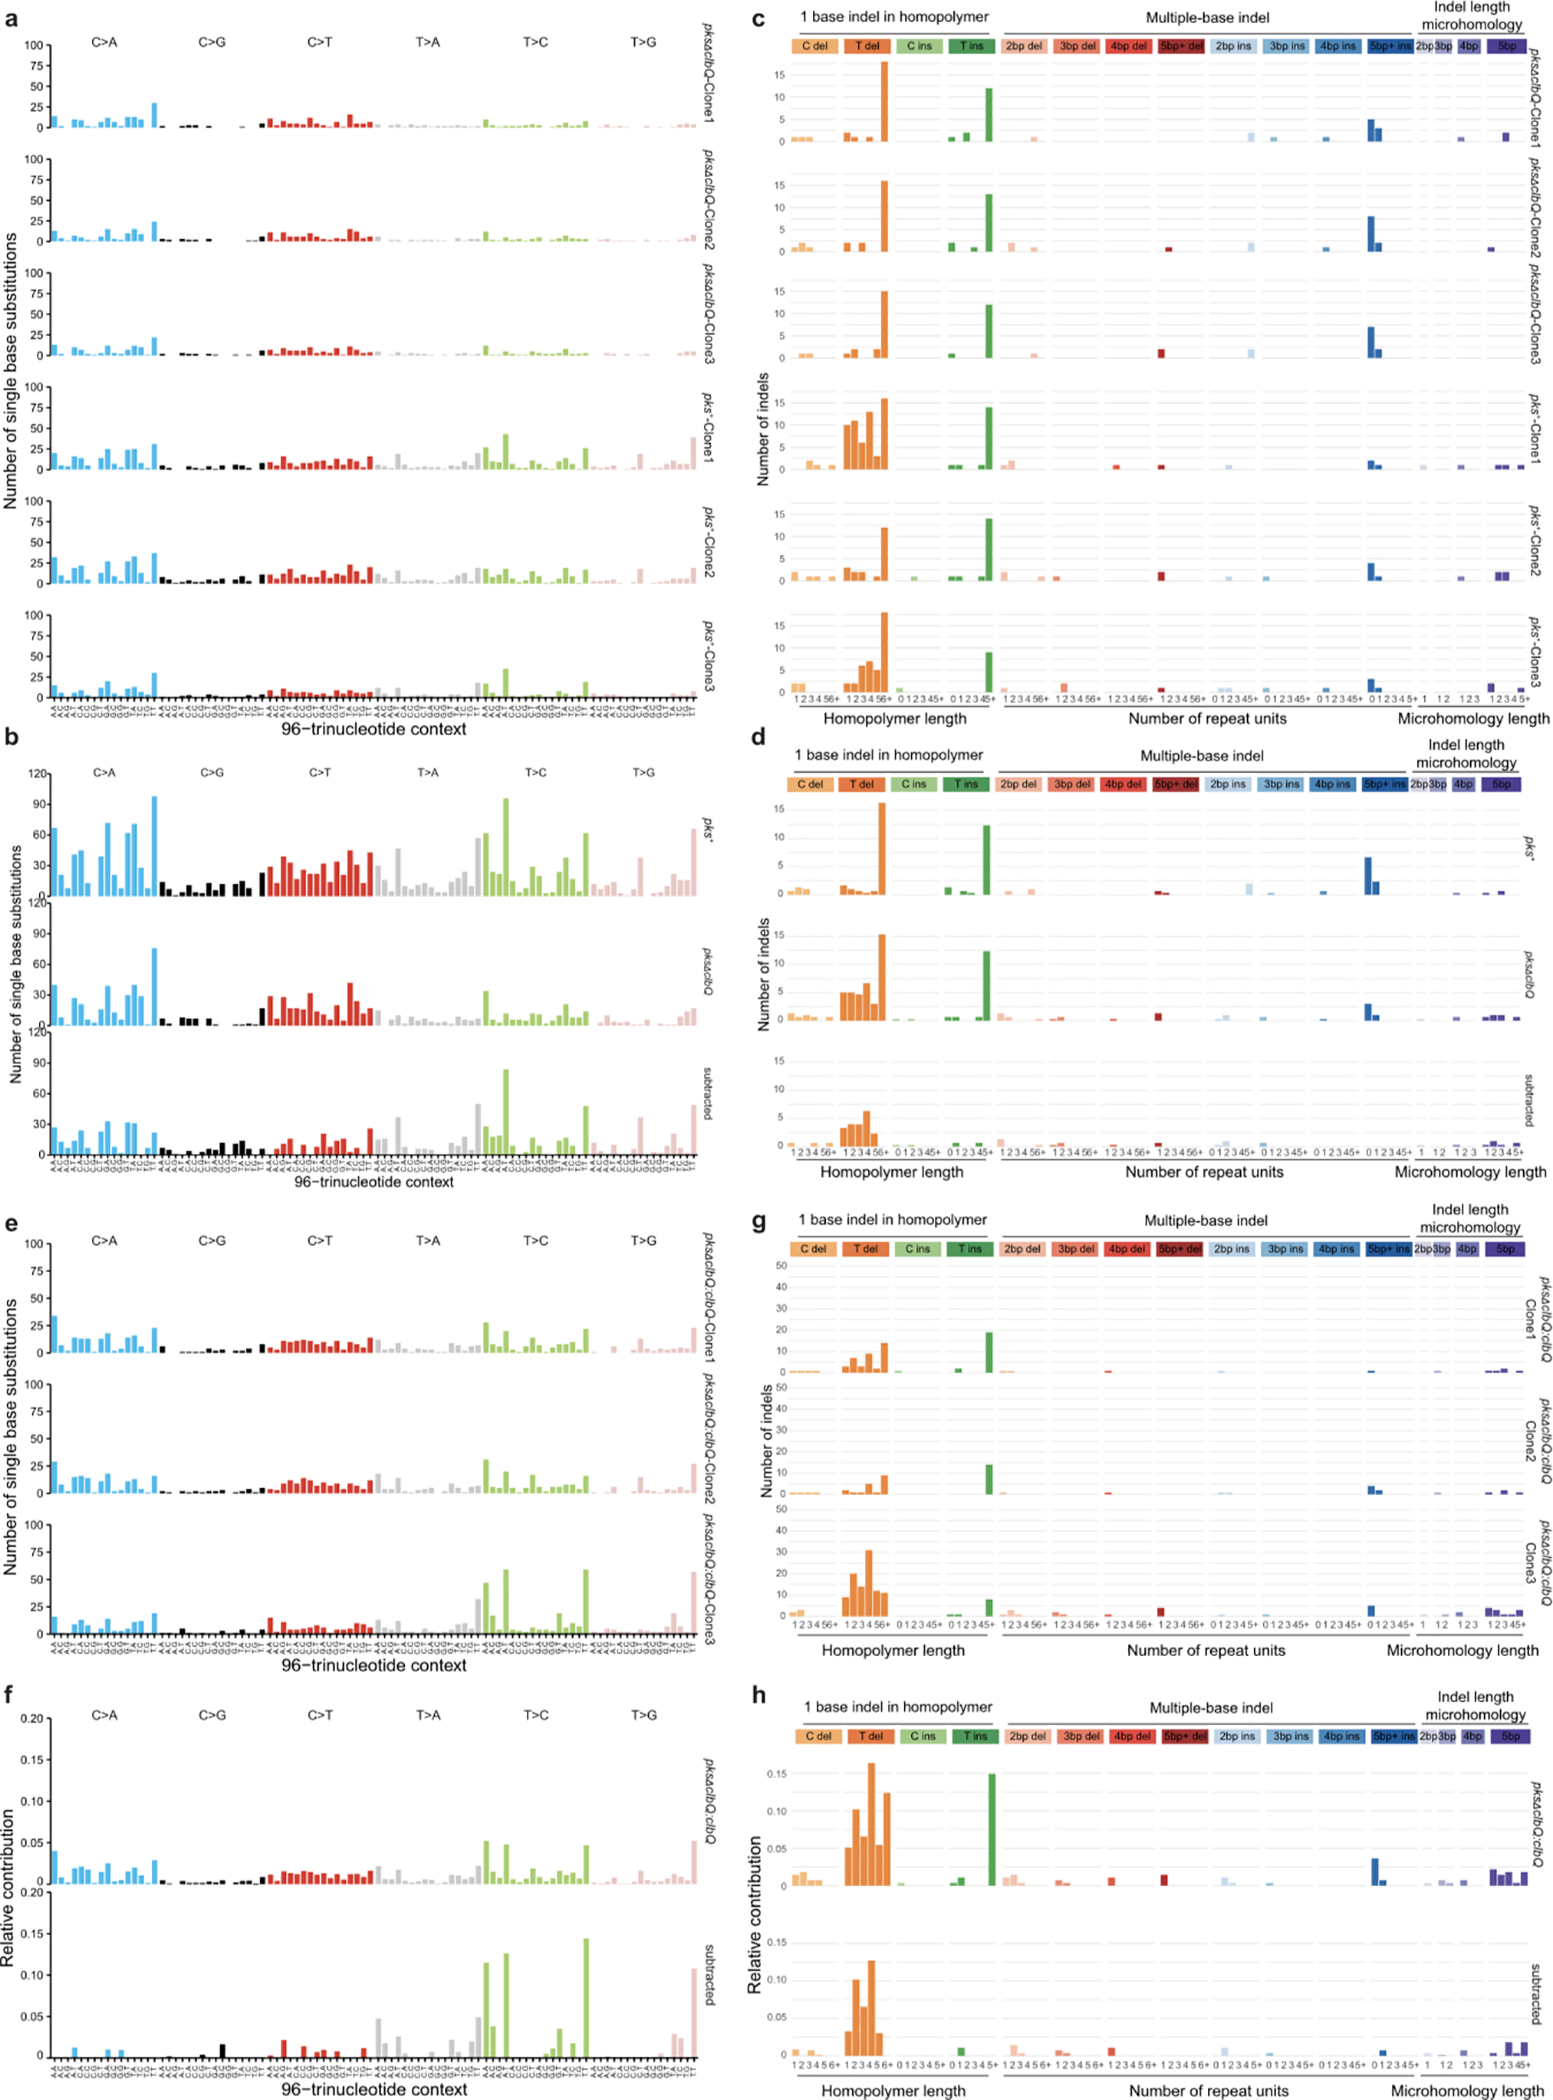
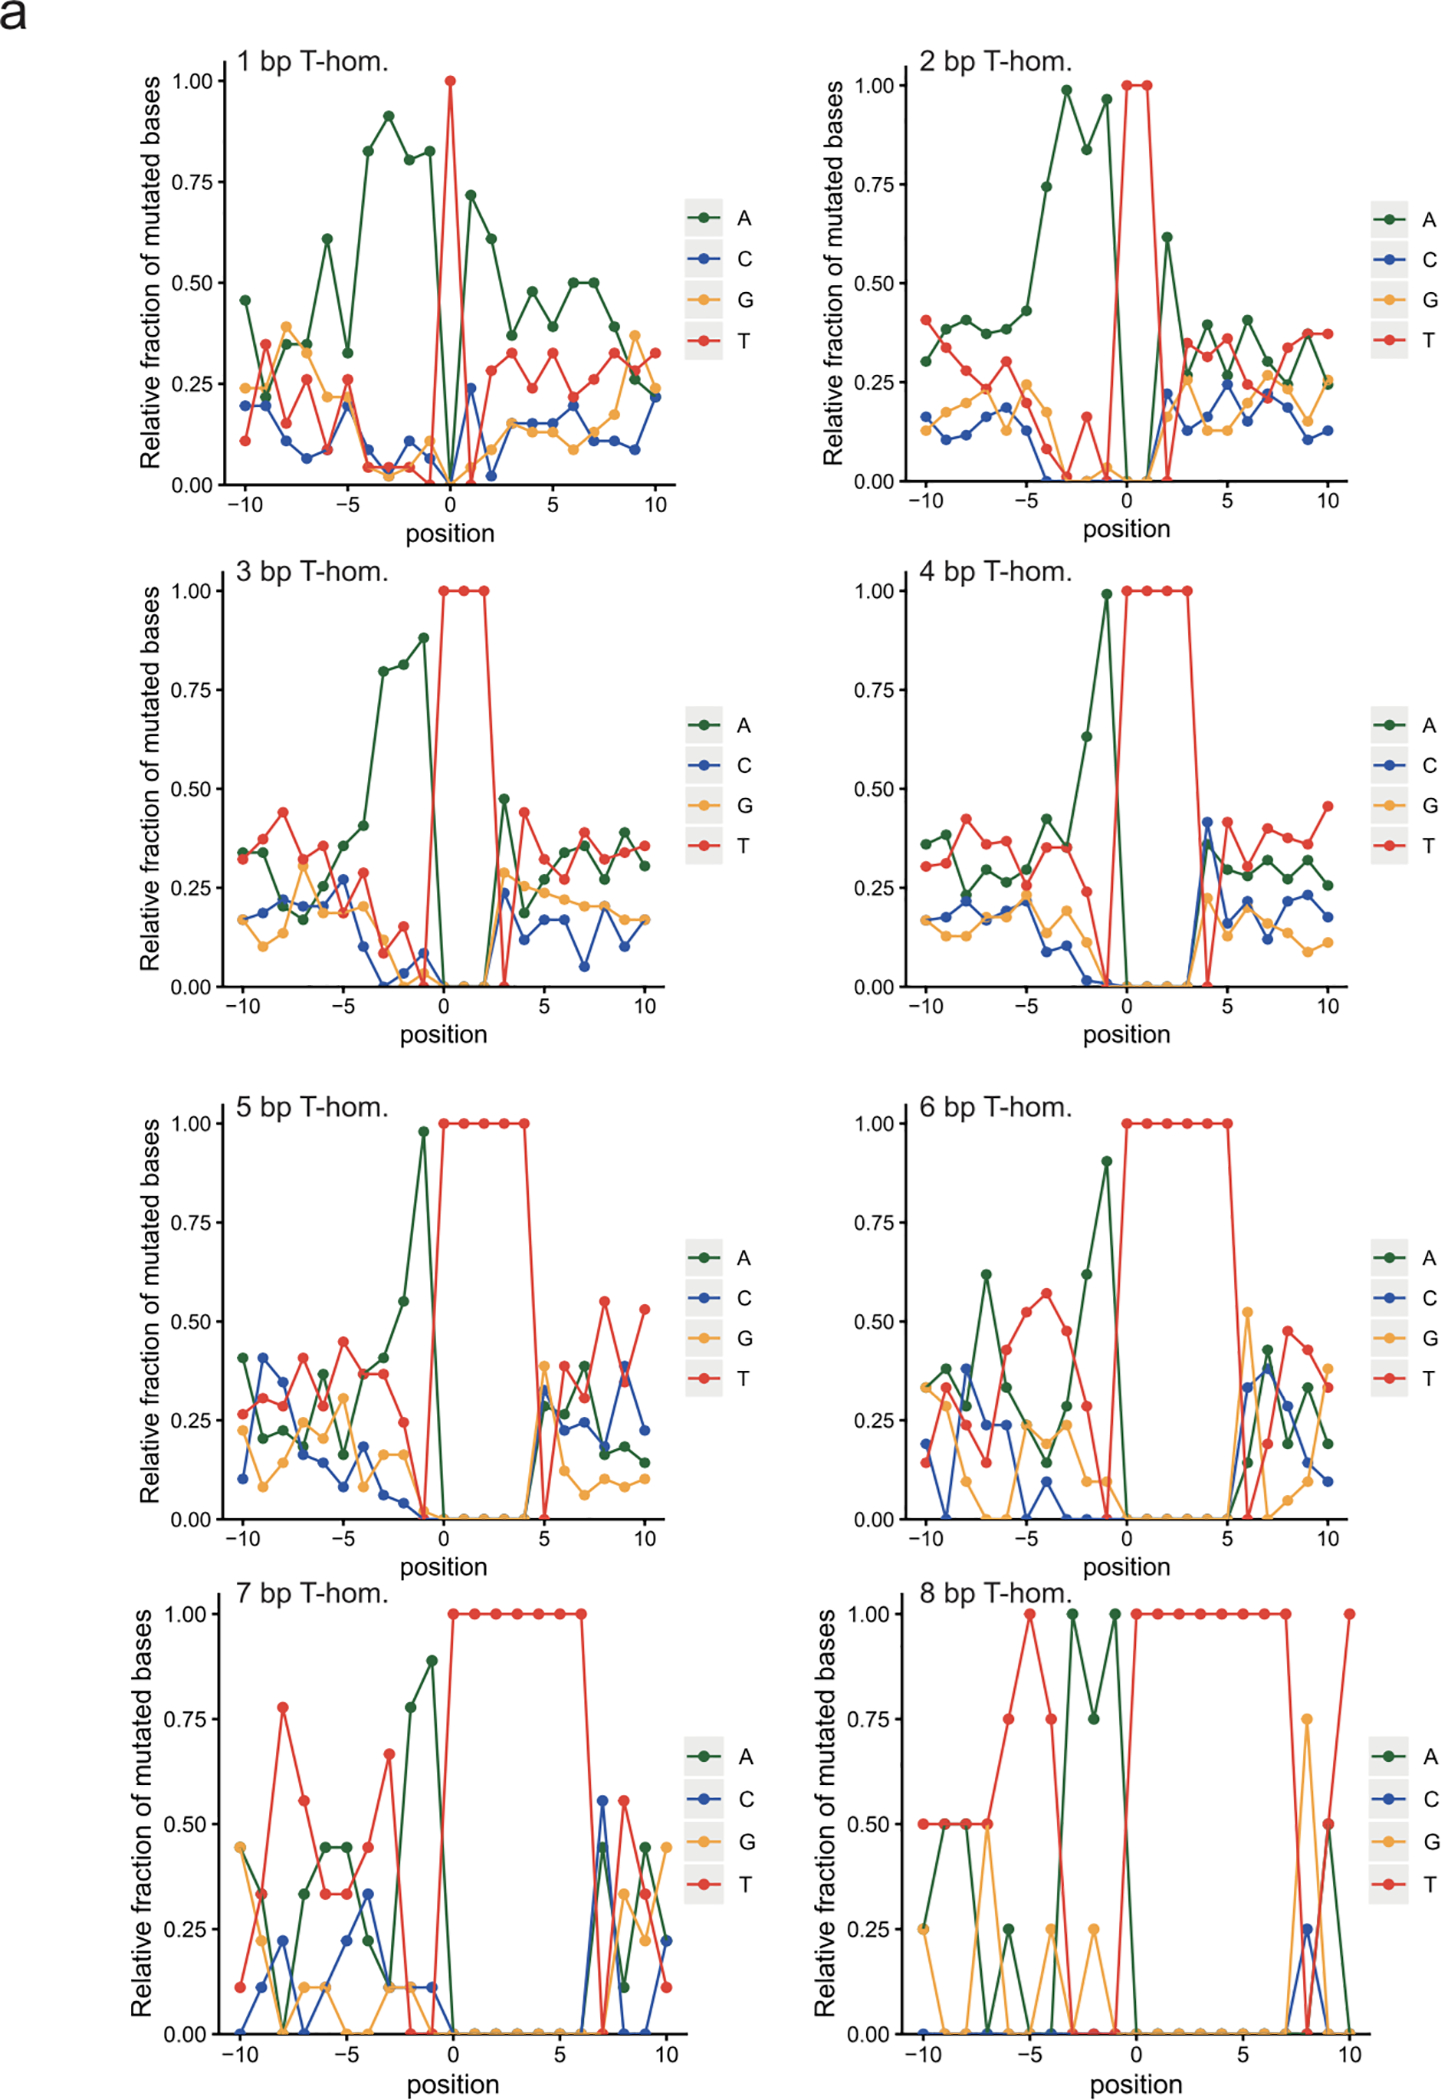
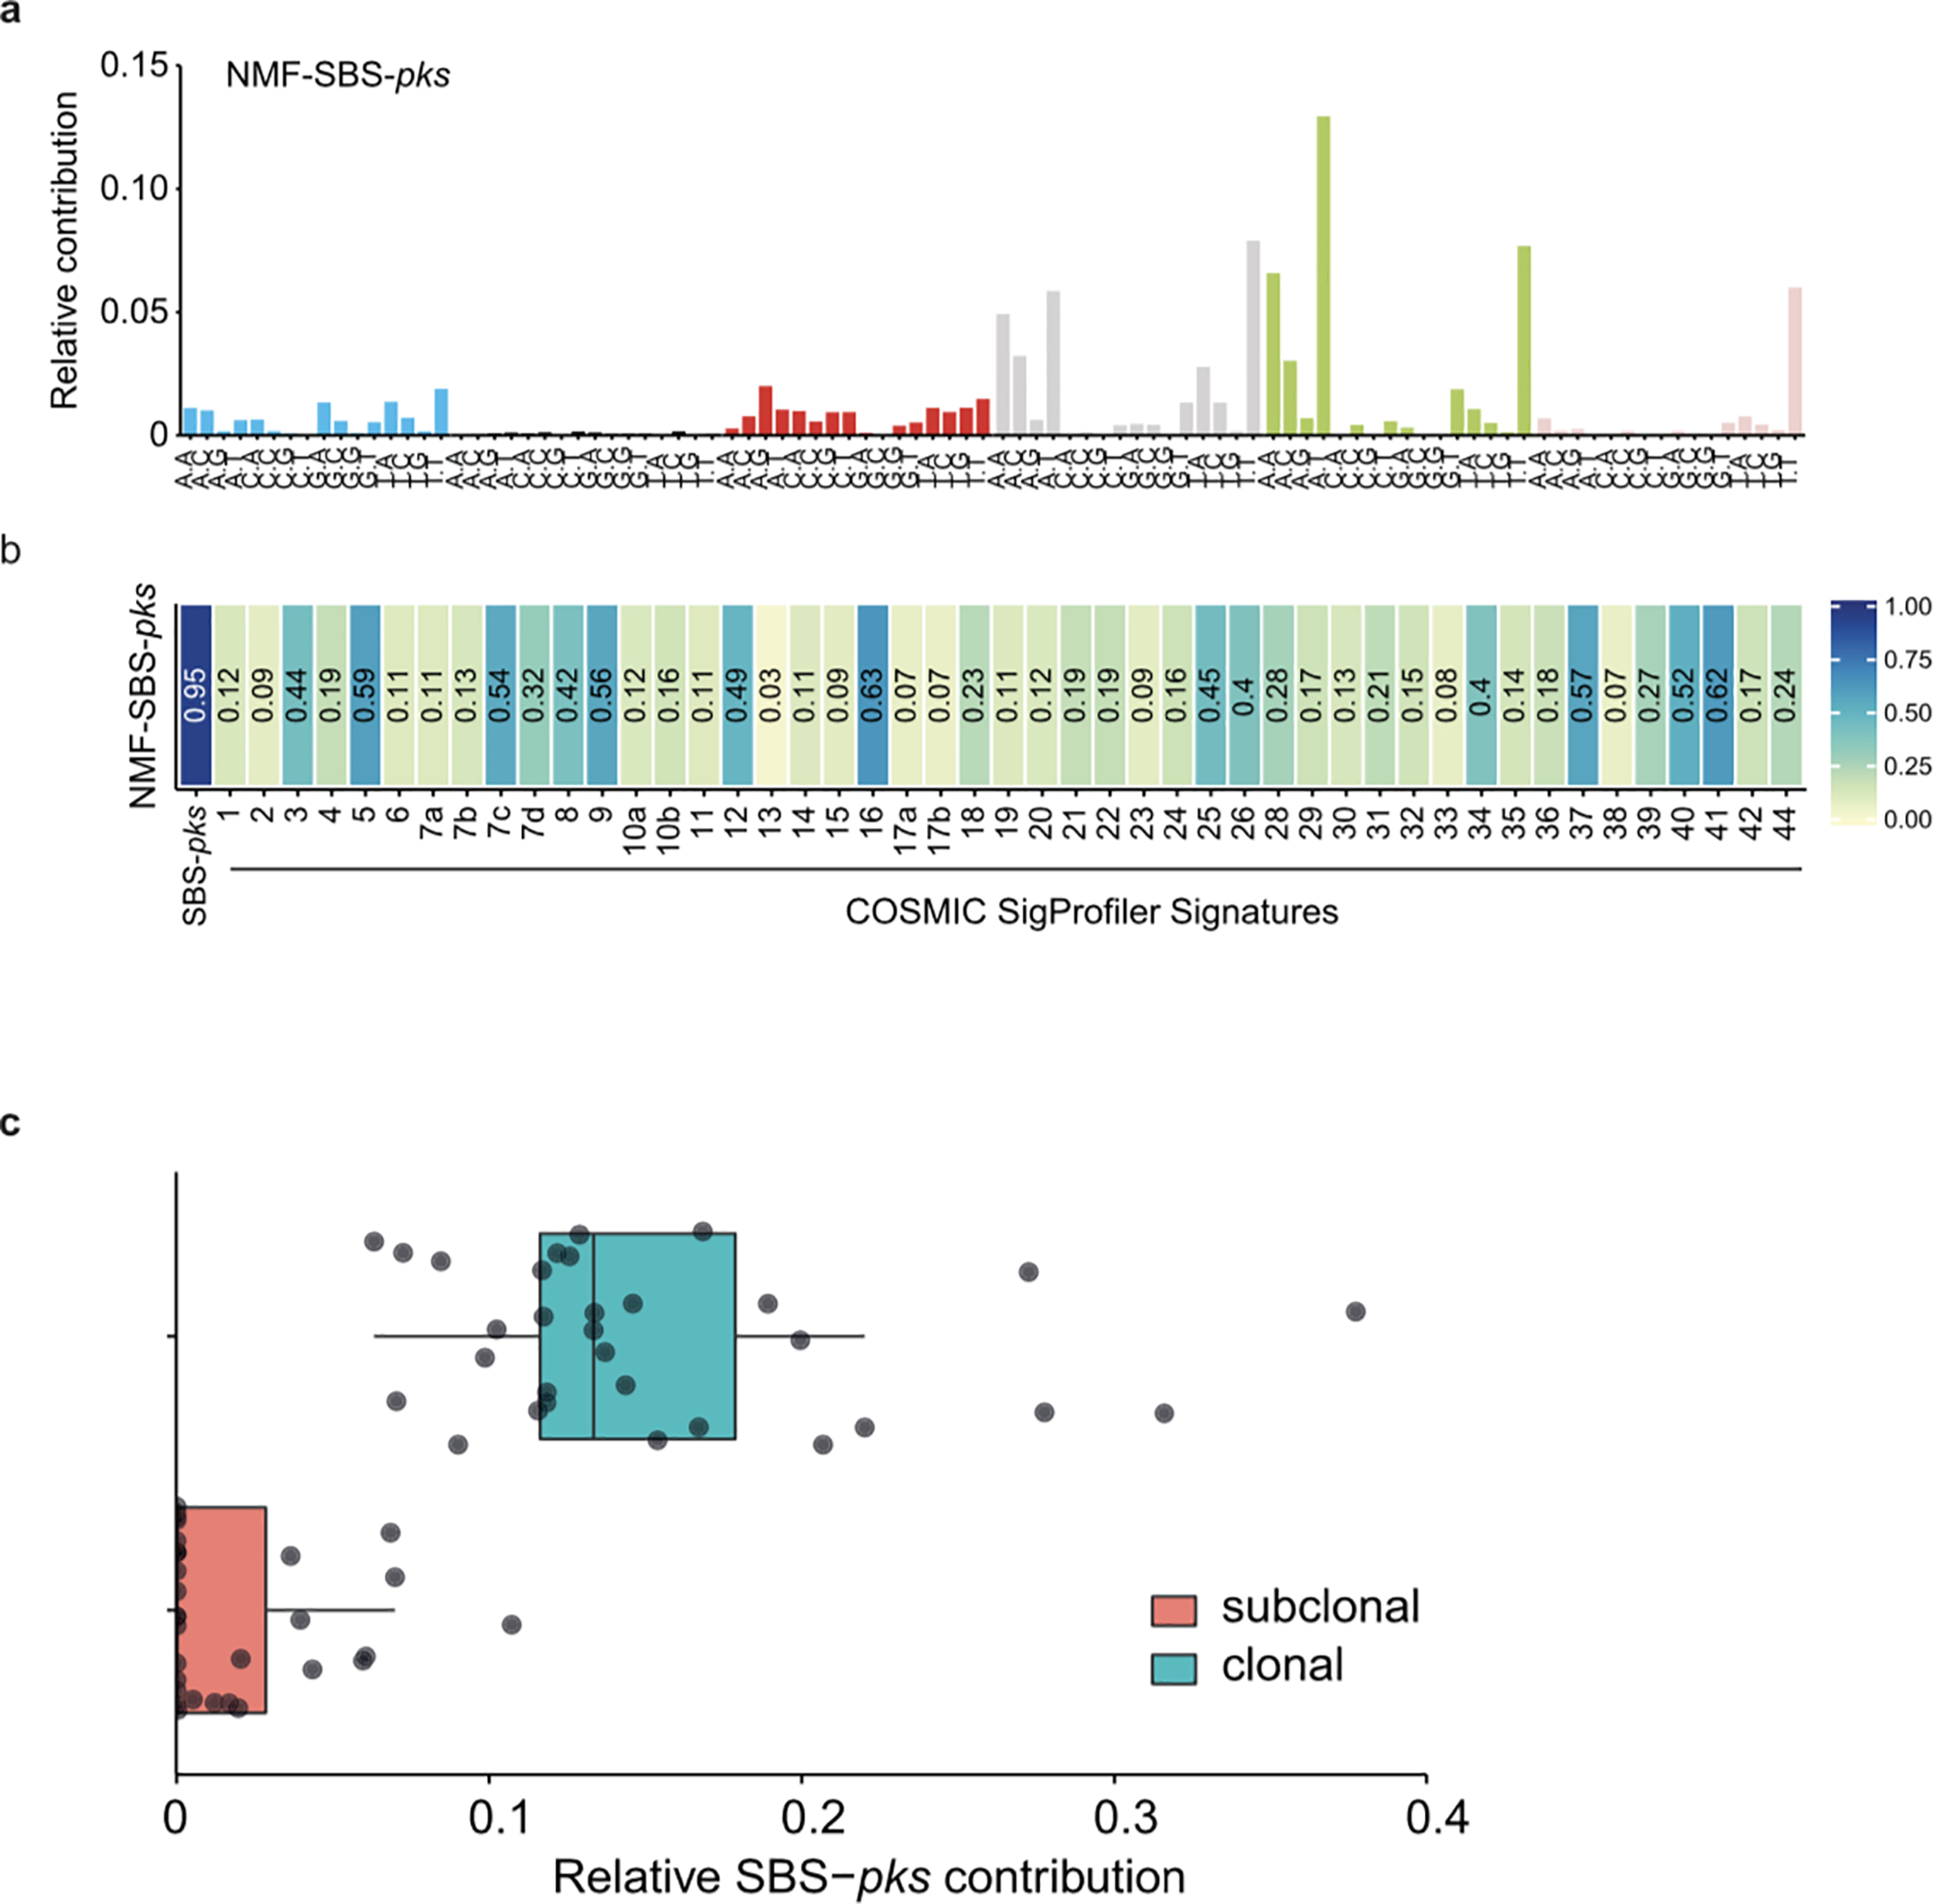
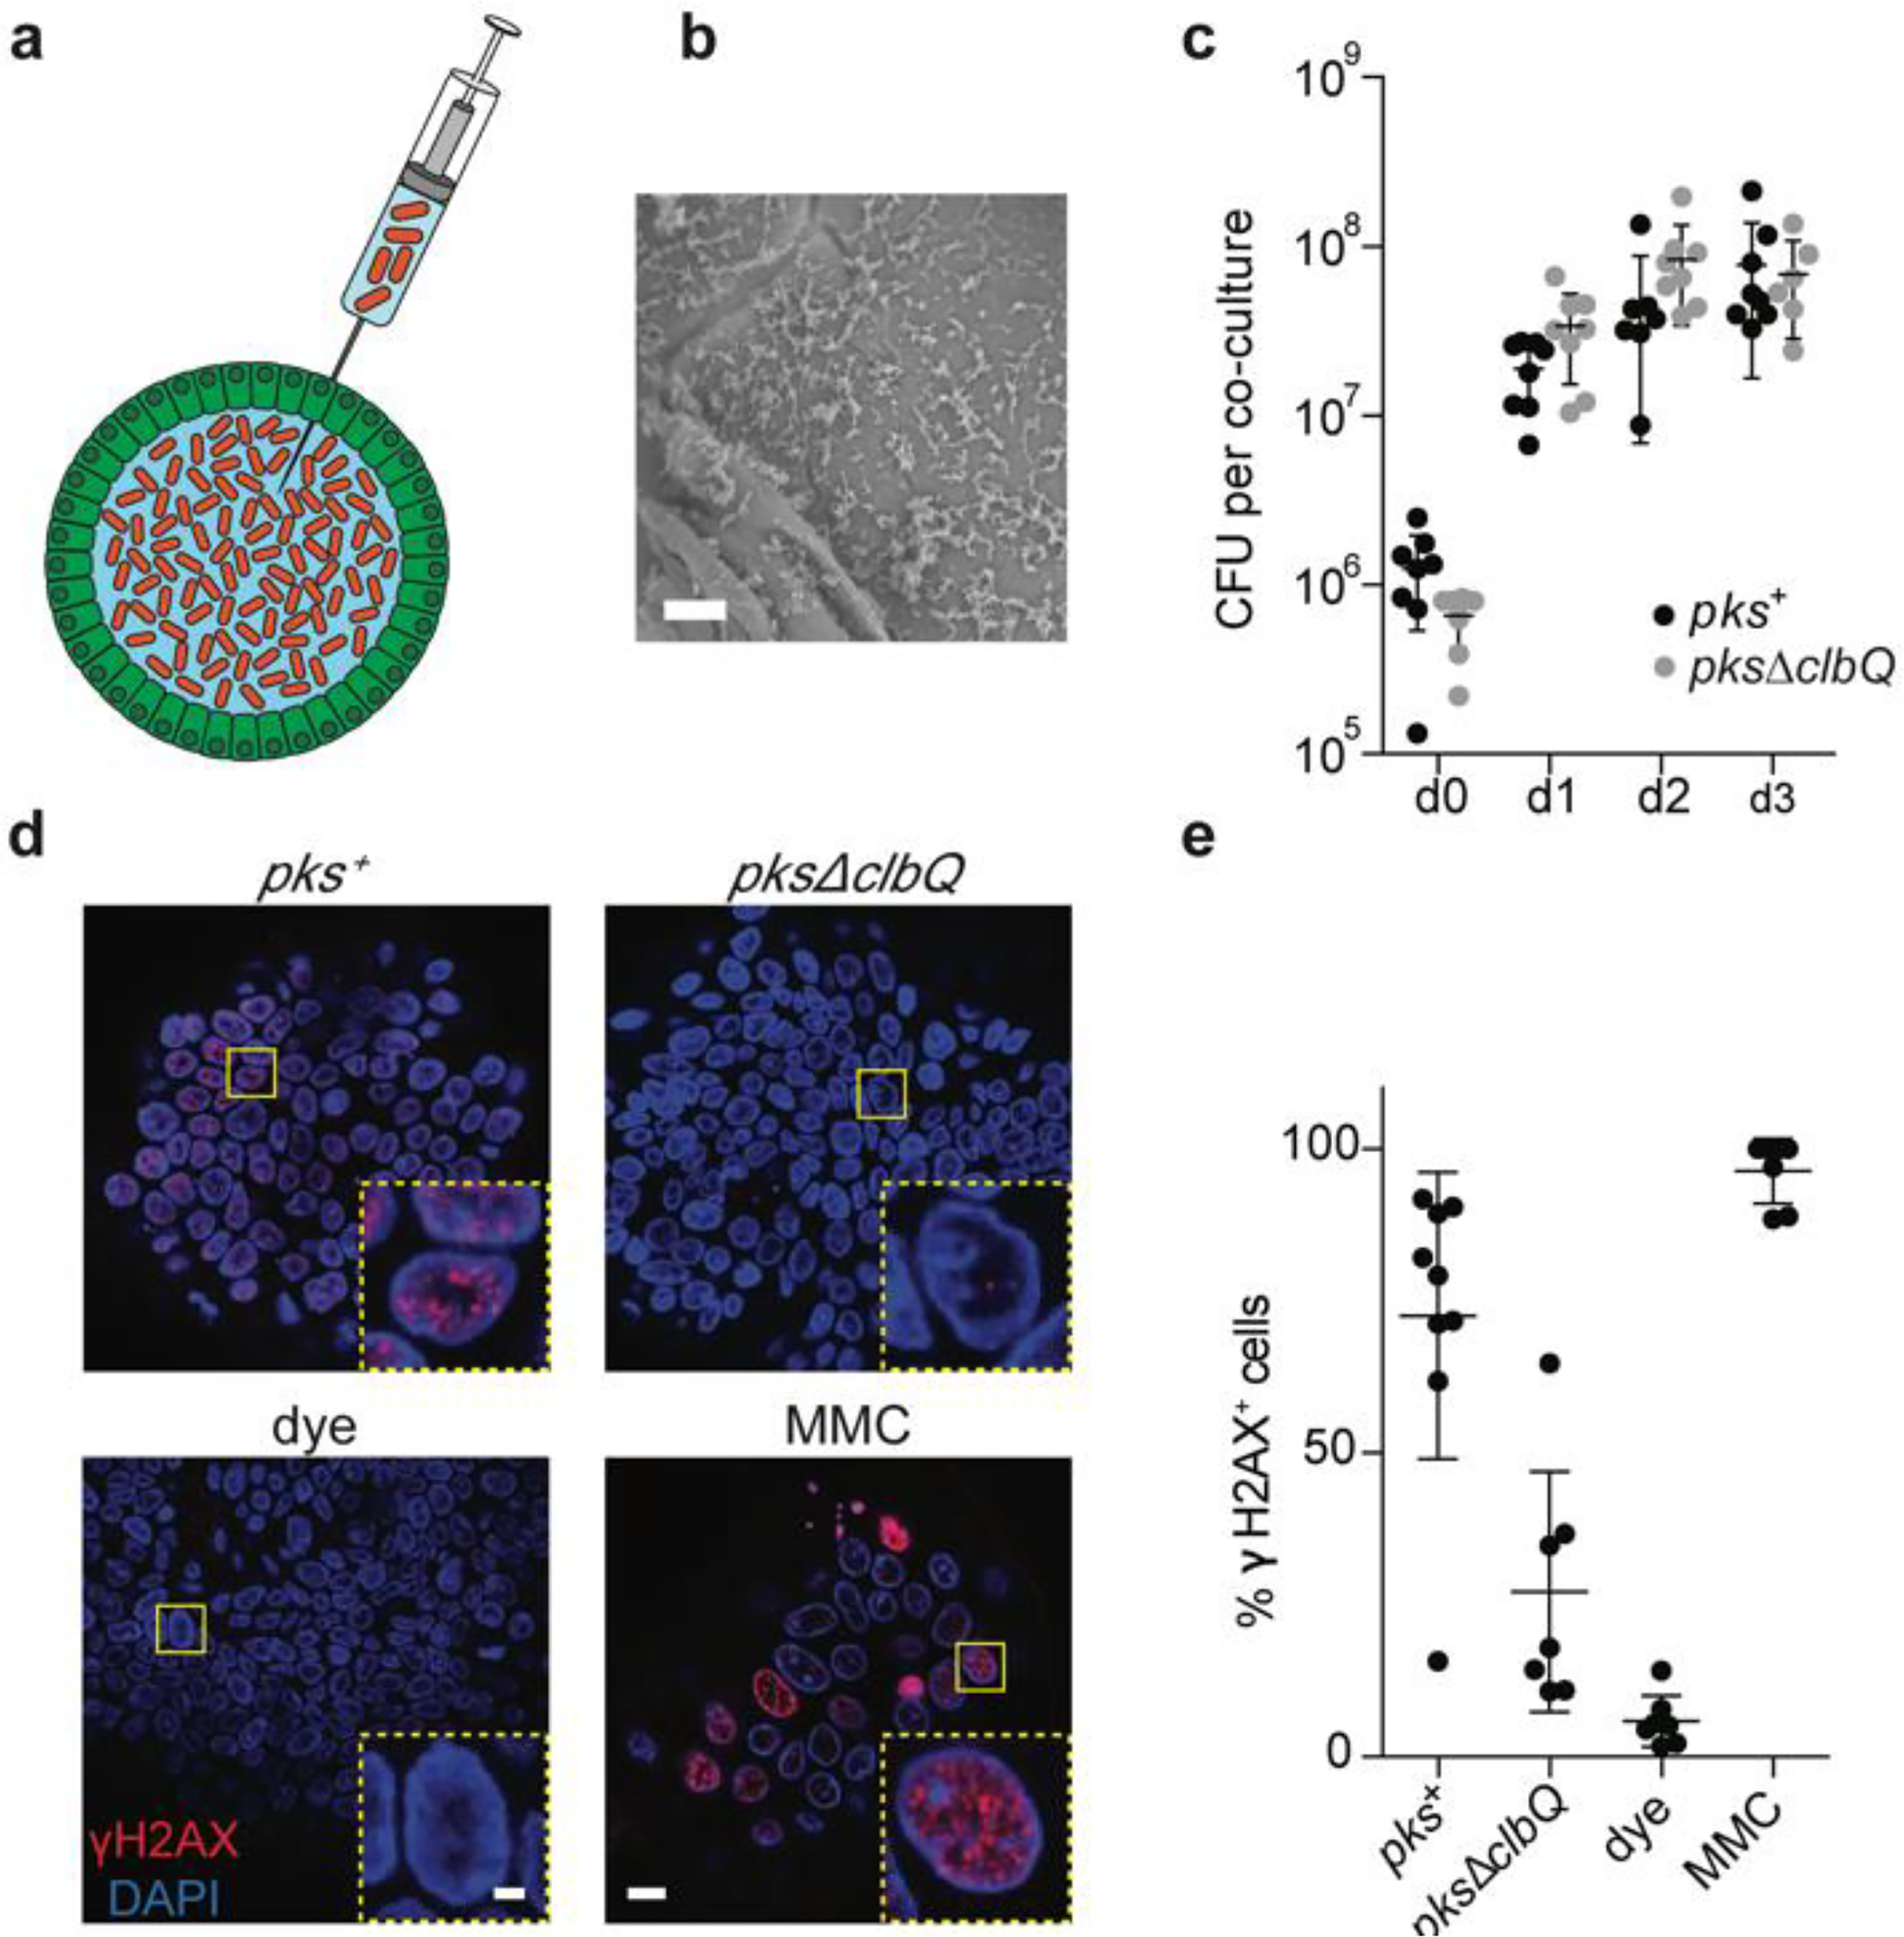
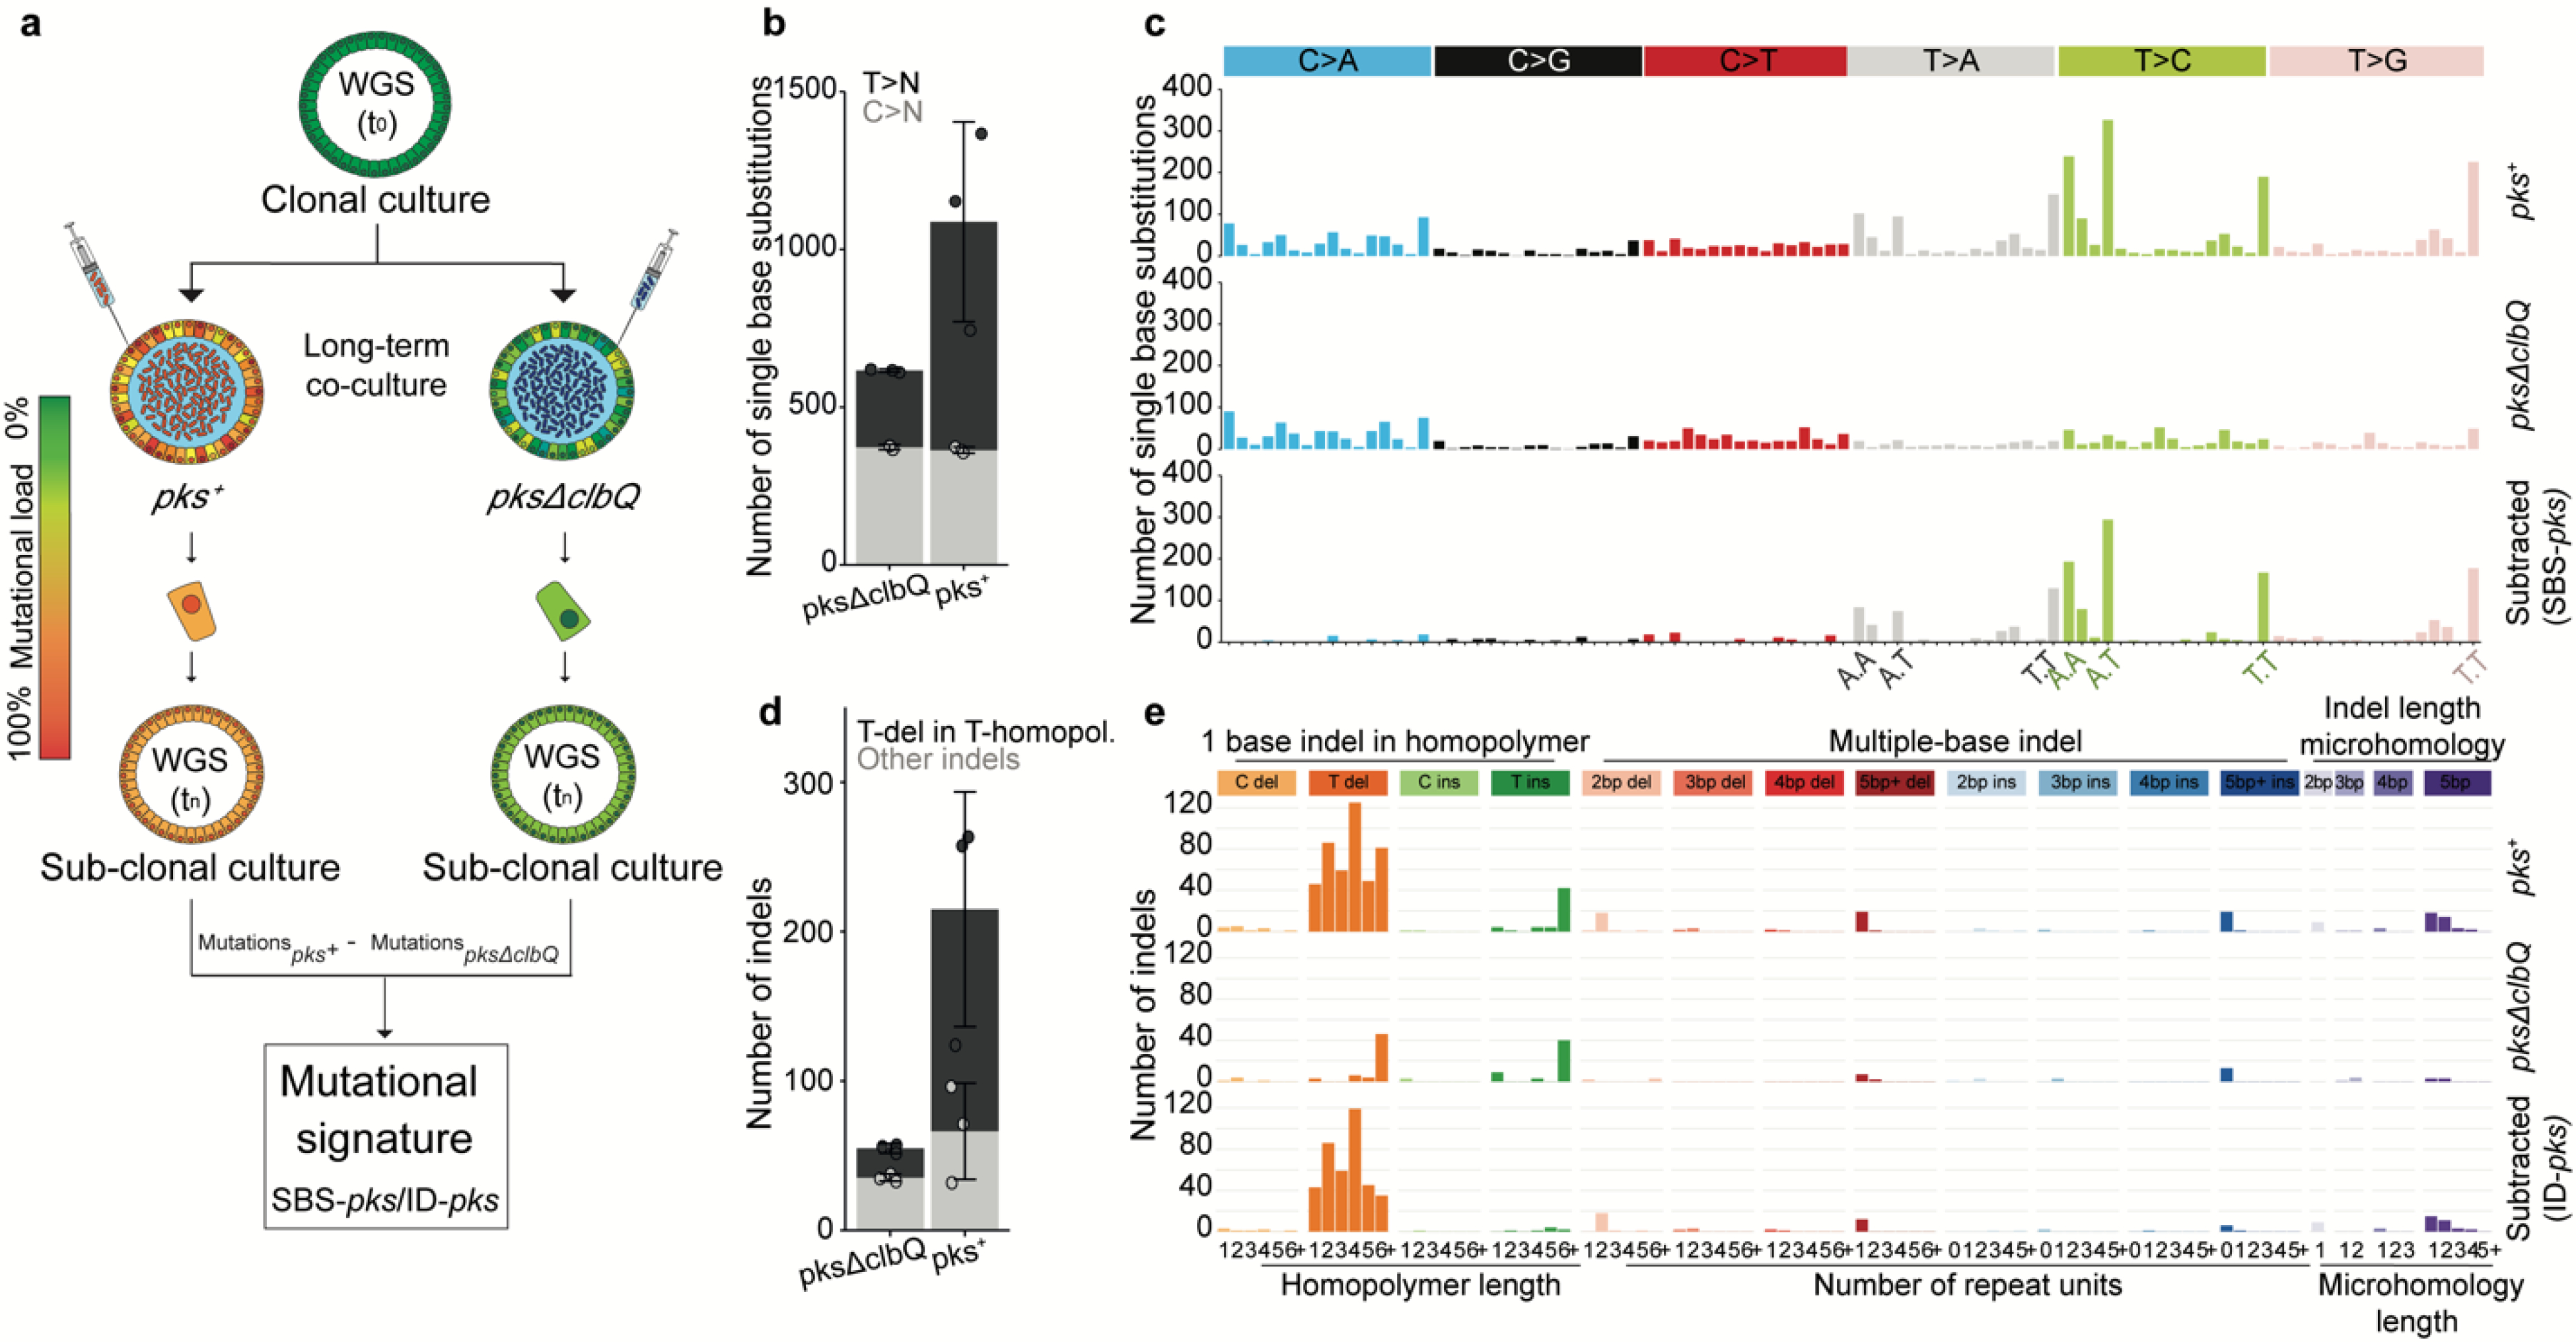
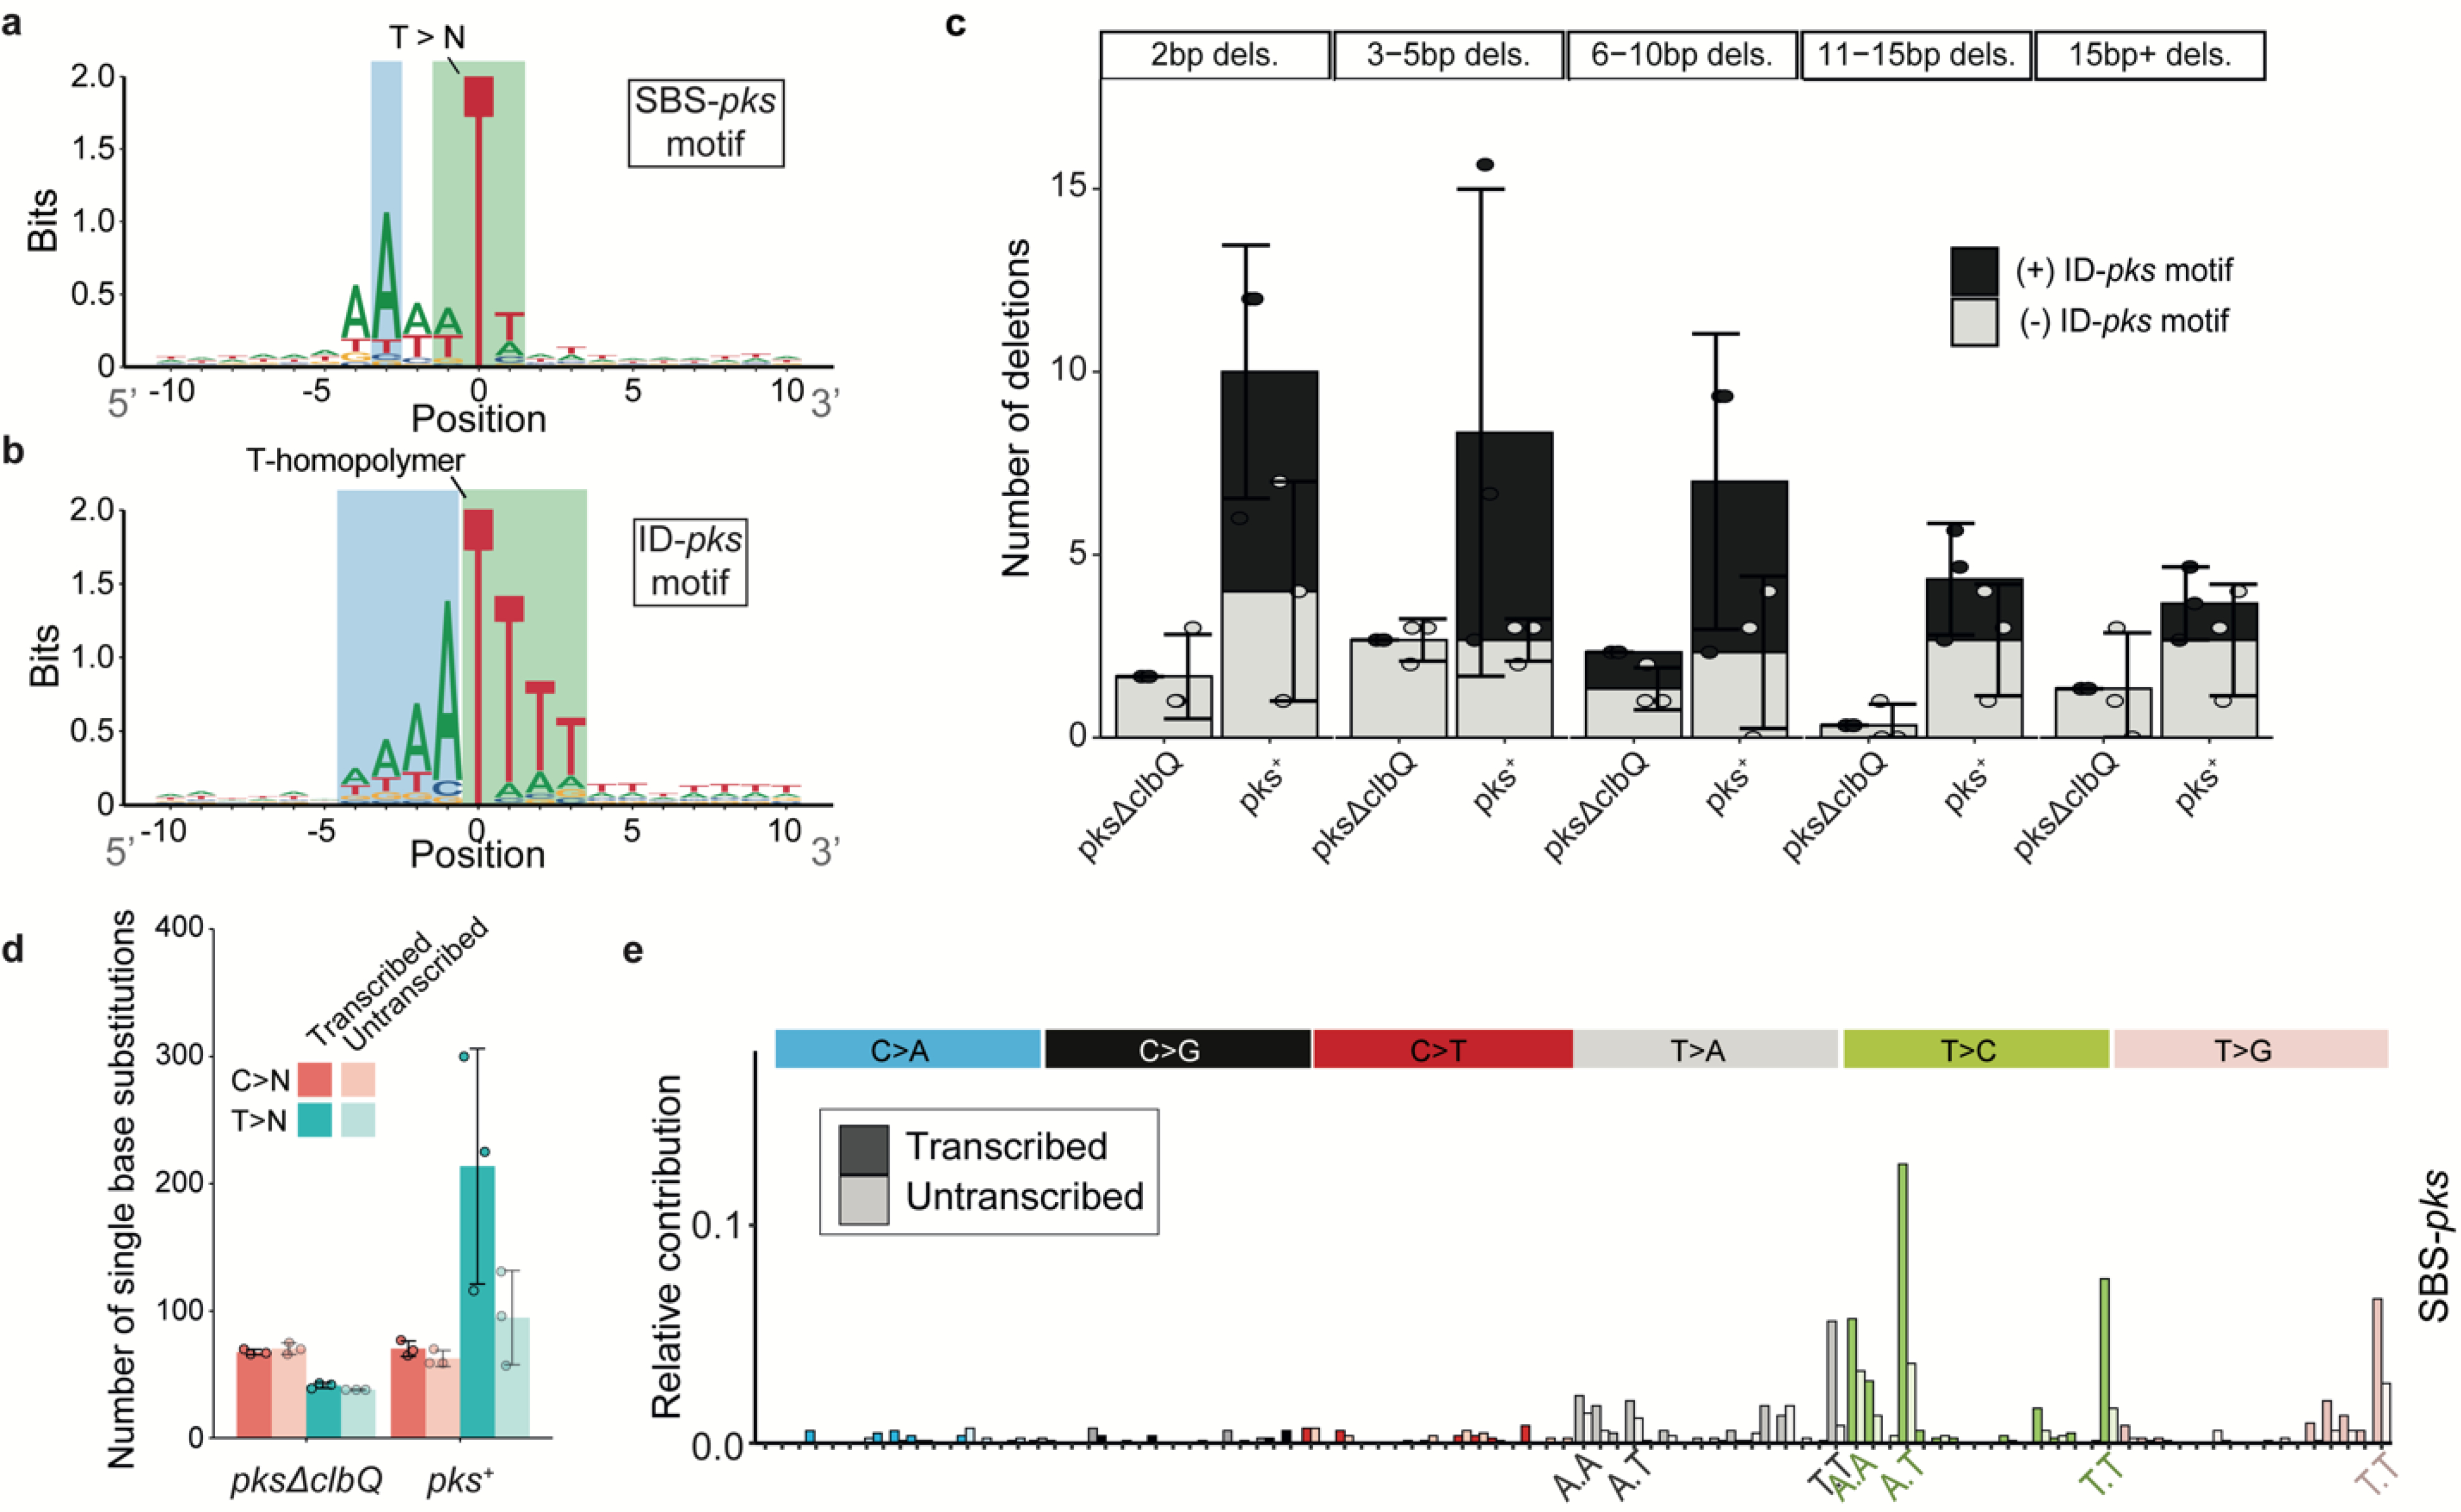
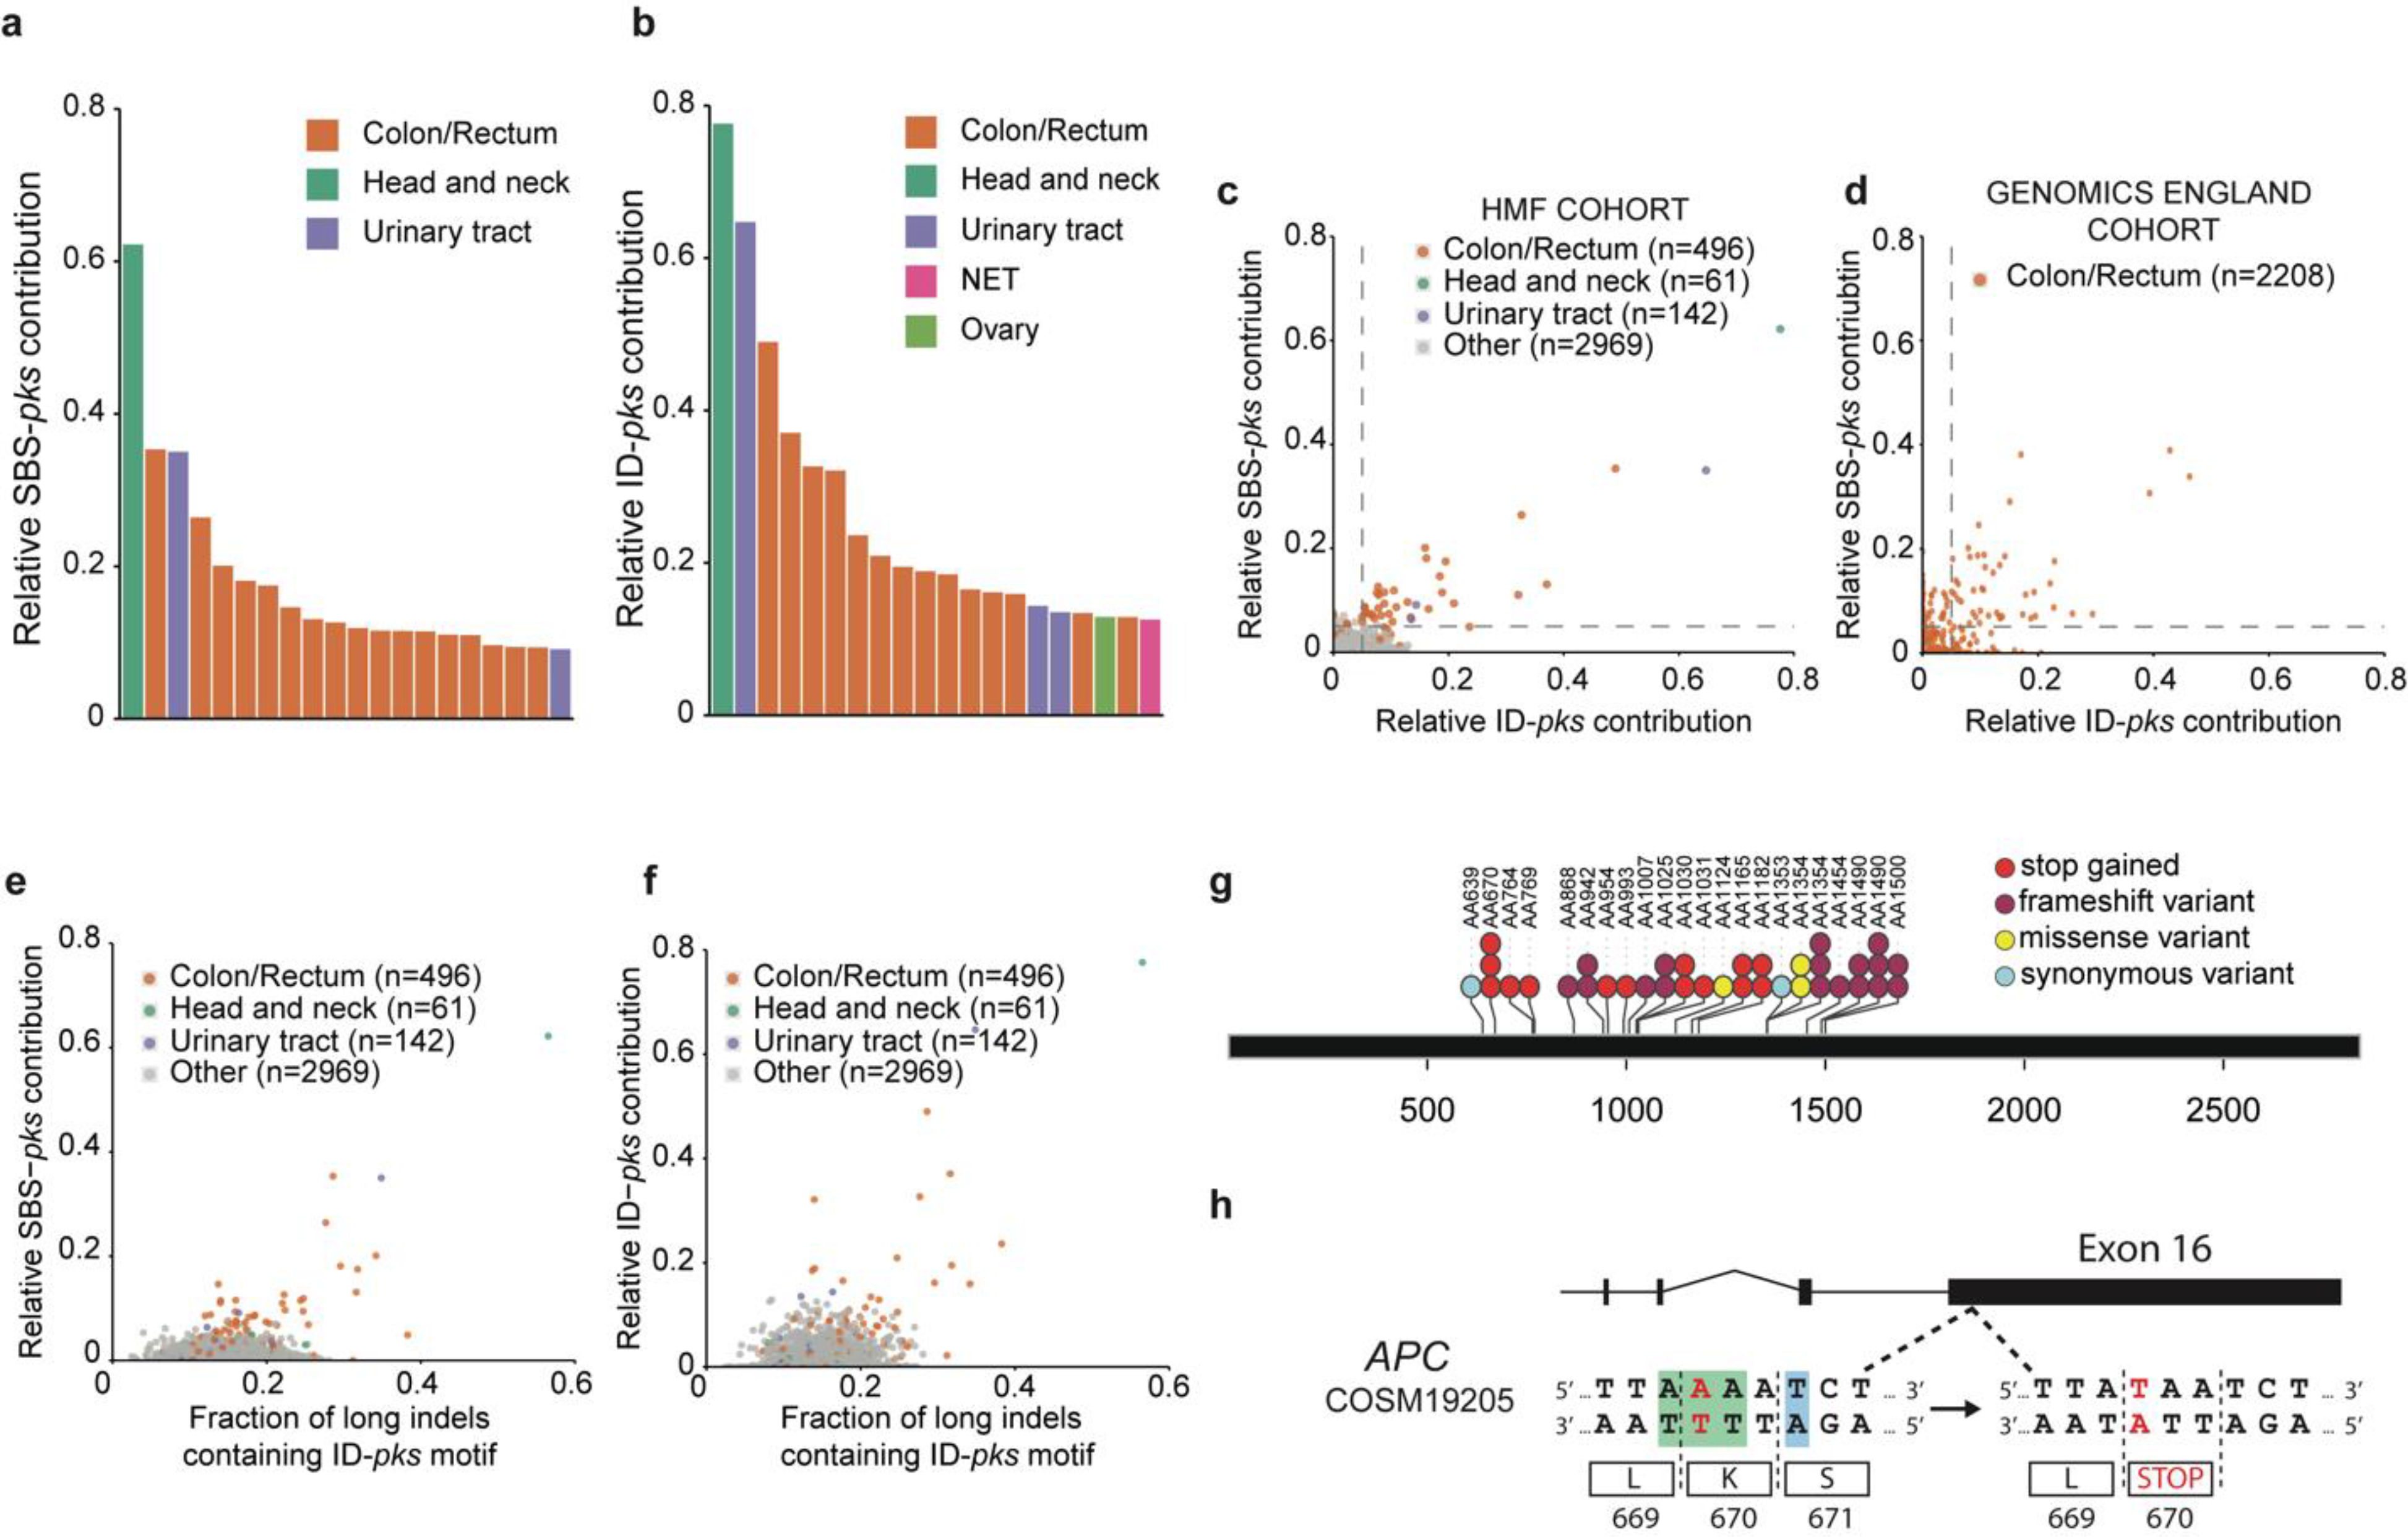
Various species of the intestinal microbiota have been associated with the development of colorectal cancer1,2, but it has not been demonstrated that bacteria have a direct role in the occurrence of oncogenic mutations. Escherichia coli can carry the pathogenicity island pks, which encodes a set of enzymes that synthesize colibactin3. This compound is believed to alkylate DNA on adenine residues4,5 and induces double-strand breaks in cultured cells3. Here we expose human intestinal organoids to genotoxic pks+ E. coli by repeated luminal injection over five months. Whole-genome sequencing of clonal organoids before and after this exposure revealed a distinct mutational signature that was absent from organoids injected with isogenic pks-mutant bacteria. The same mutational signature was detected in a subset of 5,876 human cancer genomes from two independent cohorts, predominantly in colorectal cancer. Our study describes a distinct mutational signature in colorectal cancer and implies that the underlying mutational process results directly from past exposure to bacteria carrying the colibactin-producing pks pathogenicity island.


Conflict of interest statement

CONFLICT OF INTEREST

The authors declare no conflict of interest.

Figures

Extended Data Fig. 1.
Extended Data Fig. 1.. Co-culture with genotoxic pks+ E. coli induces DNA interstrand crosslinks in healthy human intestinal organoids.
a, Representative images (out of n = 5 organoids per group) of DNA interstrand crosslink formation after 1d of co-culture, measured by FANCD2 immunofluorescence (green). Nuclei were stained with DAPI (blue). Yellow boxes represent inset area. Scale bars represent 50 μm (large image) and 10 μm (inset). Experiment was repeated independently twice with similar results. b, Gating strategy to select epithelial cells (left) and to quantify viable cells (right). c, Viability of intestinal organoid cells after 1, 3 and 5 days of co-culture (n = 3 technical replicates) (bacteria eliminated after 3 days of co-culture). Points are independent replicates, center line indicates mean, error bars represent SD.
Extended Data Fig. 2.
Extended Data Fig. 2.. Genotoxic pks+ E. coli induce SBS-pks and ID-pks mutational signatures after long-term co-culture with wild-type intestinal organoids.
a, 96-trinucleotide mutational spectra of SBS in each of the 3 individual clones sequenced per condition. Top 3: dye; middle 3: pksΔclbQ E. coli; bottom 3: pks+ E. coli. b, Total 96-trinucleotide mutational spectra of pks+ and pksΔclbQ from which dye single base substitutions are subtracted. c, Heatmap depicting cosine similarity between dye, pks+ E. coli and pksΔclbQ E. coli 96-trinucleotide mutational profiles. d, Indel mutational spectra plots from each of the 3 individual clones sequenced per condition. Top 3: dye; middle 3: pksΔclbQ E. coli bottom 3: pks+ E. coli e, Total indel mutational spectra of values of pks+ E. coli and pksΔclbQ E. coli from which dye indels are subtracted. f, Heatmap depicting cosine similarity between dye, pks+ E. coli and pksΔclbQ E. coli indel mutational profiles.
Extended Data Fig. 3.
Extended Data Fig. 3.. Genotoxic pks+ E. coli and isogenic strain reconstituted with pksΔclbQ:clbQ induce SBS-pks and ID-pks mutational signatures after co-culture.
a, 96-trinucleotide mutational spectra of SBS in 3 individual clones from the independent human healthy intestinal organoid line ASC 6-a co-cultured for 3 rounds with pks+ or pksΔclbQ E. coli. b, Top: Total 96-trinucleotide mutational spectrum from the 3 clones from pks+ or pksΔclbQ E. coli shown in (a). Bottom: Resulting 96-trinucleotide mutational spectrum from ASC 6-a co-cultured with pks+ E. coli after the subtraction of background mutations from 3 parallel pksΔclbQ E. coli co-cultures (cosine similarity to SBS-pks = 0.77). c, Indel mutational spectra plots from the 3 independent ASC 6-a clones co-cultured for 3 rounds with pks+ or pksΔclbQ E. coli. d, Top: Total indel mutational spectrum from the 3 clones from pks+ or pksΔclbQ E. coli shown in (c). Bottom: Resulting indel mutational spectrum from the independent ASC 6-a co-cultured with pks+ E. coli after the subtraction of background mutations from 3 parallel pksΔclbQ E. coli co-cultures (cosine similarity to ID-pks = 0.93). e, 96-trinucleotide mutational spectrum from 3 individual clones of the ASC 5-a line co-cultured for 3 rounds with the isogenic recomplemented strain pksΔclbQ:clbQ. f, Top: Total 96-trinucleotide mutational spectrum from the 3 clones from pksΔclbQ:clbQ shown in (e). Bottom: Resulting mutational spectrum after subtracting pksΔclbQ background (cosine similarity to SBS-pks = 0.95). g, Indel mutational spectrum from 3 individual clones of the ASC 5-a line co-cultured for 3 rounds with the isogenic recomplemented strain pksΔclbQ:clbQ. h, Top: Total indel mutational spectrum from the 3 clones from pksΔclbQ:clbQ shown in (e). Bottom: Resulting mutational spectrum after subtracting pksΔclbQ background (cosine similarity to ID-pks = 0.95).
Extended Data Fig. 4.
Extended Data Fig. 4.. Detailed sequence context for ID-pks and longer deletions by length.
a, 10 base up- and downstream profile shows an upstream homopolymer of adenosines favoring induction of T-deletions. The length of the adenosine stretch decreases with increasing T-homopolymer length (1—8, top left to bottom right).
Extended Data Fig. 5.
Extended Data Fig. 5.. Signature extraction and clonal contribution of SBS-pks in CRC metastases.
a, De-novo extracted NMF-SBS-pks signature by non-negative matrix factorization (NMF) on all 496 CRC metastases in the HMF dataset. b, Cosine similarity scores between the de-novo extracted SBS signature in (a) and COSMIC SigProfiler signatures, including our experimentally defined SBS-pks signature (left). c, Relative contribution of SBS-pks to clonal (corrected variant allele frequency > 0.4, blue bar) and subclonal fraction (corrected variant allele frequency < 0.2, red bar) of mutations in the 31 SBS/ID-pks high CRC metastases from the HMF cohort. Box indicates upper and lower quartiles with the center line indicating the mean. Box whiskers: largest value no further than 1.5 times the interquartile range extending from the box. Points indicate individual CRC metastases.
Figure 1.
Figure 1.. Co-culture of healthy human intestinal organoids with genotoxic E. coli induces DNA damage.
a, Schematic representation of genotoxic E. coli microinjection into the lumen of human intestinal organoids. b, Scanning electron microscopy image illustrating direct contact between organoid apical side and pks+ E. coli after 24h co-culture. Scale bar = 10 μm. c, Bacterial load of pks+ or pksΔclbQ at 0, 1, 2 and 3 days after co-culture establishment (n = 8 co-cultures per condition and timepoint, except pks+ d2 (n = 7) and pksΔclbQ d3 (n = 6)). CFU, colony forming units. Center line indicates mean, error bars represent SD. d, Representative images of DNA damage induction after 1 day of co-culture, measured by γH2AX immunofluorescence. One organoid is shown per image with one nucleus in the inset. Yellow boxes indicate inset area. Scale bars represent 10 μm (large image) and 2 μm (inset). e, Quantification of (d): Percentage of nuclei positive for γH2AX foci in pks+ (n= 9 organoids), pksΔclbQ (n=7 organoids), dye (n=7 organoids) and mitomycin C (MMC) (n=7 organoids) after 1 day of co-culture. Center line indicates mean, error bars represent SD.
Figure 2.
Figure 2.. Long-term co-culture of pks+ E. coli induces SBS-pks and ID-pks mutational signatures.
a, Schematic representation of the experimental setup. b, The number of single base substitutions (SBS) that accumulated in organoids co-cultured with either pks+ or pksΔclbQ E. coli (n = 3 clones). Box height indicates mean number of events, error bars represent SD. c, SBS 96-trinucleotide mutational spectra in organoids exposed to either pks+ (top) or pksΔclbQ (middle) E. coli. The bottom panel depicts the SBS-pks signature, which was defined by subtracting pksΔclbQ from pks+ SBS mutations. d, The number of small insertions and deletions (indels) that accumulated in organoids co-cultured either with pks+ or pksΔclbQ E. coli (n = 3 clones). Box height indicates mean number of events, error bars represent SD. e, Indel mutational spectra observed in organoids exposed to either pks+ (top) or pksΔclbQ (middle) E. coli. The bottom panel depicts the ID-pks signature, which was defined by subtracting pksΔclbQ from pks+ indel mutations.
Figure 3.
Figure 3.. Consensus motifs and extended features of SBS-pks and ID-pks mutational signatures.
a, 2-bit representation of the extended sequence context of T>N mutations observed in organoids exposed to pks+ E. coli. Sequence directionality indicated in grey. Green: Highlighted T>N trinucleotide sequence; Blue: Highlighted A-enriched position characteristic of the SBS-pks mutations. b, 2-bit representation of the extended sequence context of single T-deletions in T-homopolymers observed in organoids exposed to pks+ E. coli. Sequence directionality indicated in grey. Green: Highlighted T-homopolymer with deleted T; Blue: Highlighted characteristic poly-A stretch. c, Mean occurrence of < 1 base pair deletions in pks+ or pksΔclbQ exposed organoids. Black bars correspond to deletions matching the ID-pks extended motifs; Grey bars correspond to deletions where no ID-pks motif is observed. Box height indicates mean number of events, error bars represent SD (n = 3 clones). d, Transcriptional strand-bias of T>N and C>N mutations occurring in organoids exposed to pks+ E. coli and pksΔclbQ E. coli. Pink: C>N; Blue: T>N; Dark color: Transcribed strand; Bright color: Untranscribed strand. Box height indicates mean number of events, error bars represent SD (n = 3 clones). e, Transcriptional strand bias of the 96-trinucleotide SBS-pks mutational signature. Color: Transcribed strand; White: Untranscribed strand.
Figure 4.
Figure 4.. SBS-pks and ID-pks mutational signatures are present in a subset of CRC samples from 2 independent cohorts.
a, Top 20 out of 3668 metastases from the HMF cohort, ranked by the fraction of single base substitutions attributed to SBS-pks. CRC metastases (in orange) are enriched. Colors indicate tissue of origin. b, Top 20 out of 3668 metastases from HMF cohort. Samples are ranked by the fraction of indels attributed to ID-pks. CRC metastases (in orange) are also here enriched. NET indicates neuroendocrine tumor. Colors indicate tissue of origin. c, Scatterplot of fraction of single base substitutions and indels attributed to SBS-pks and ID-pks in 3668 metastases. Each dot represents one metastasis. Samples high for both SBS-pks and ID-pks (> 5% contribution, dashed lines) are enriched in CRC (orange). SBS-pks and ID-pks are correlated (R2 = 0.46; only CRC, R2 = 0.7). Colors indicate tissue of origin. d, Scatterplot of SBS-pks and ID-pks contribution in 2208 CRC tumor samples, predominantly of primary origin, from the Genomics England cohort. SBS-pks and ID-pks are correlated (R2 = 0.35). Each dot represents one primary tumor sample. Dashed lines delimitate samples with high SBS-pks or ID-pks contribution (> 5%). e, Scatterplot of SBS-pks and > 1 bp indels with ID-pks pattern in the HMF cohort. Colors indicate tissue of origin. f, Scatterplot of ID-pks and >1 bp indels with ID-pks pattern in the HMF cohort. Colors indicate tissue of origin. g, Exonic APC driver mutations found in the IntOGen collection matching the colibactin target SBS-pks or ID-pks motifs. h, Schematic representation of a driver mutation in APC causing a premature stop codon matching the SBS-pks motif, found in the IntOGen collection and in two independent SBS/ID-pks high patients from the HMF cohort.

Comment in

References

    1. Allen J & Sears CL Impact of the gut microbiome on the genome and epigenome of colon epithelial cells: contributions to colorectal cancer development. Genome Med. 11, 11 (2019). - PMC - PubMed
    1. Gagnaire A, Nadel B, Raoult D, Neefjes J & Gorvel J-P Collateral damage: insights into bacterial mechanisms that predispose host cells to cancer. Nat. Rev. Microbiol. 15, 109–128 (2017). - PubMed
    1. Nougayrède J-P et al. Escherichia coli Induces DNA Double-Strand Breaks in Eukaryotic Cells. Science 313, 848–851 (2006). - PubMed
    1. Wilson MR et al. The human gut bacterial genotoxin colibactin alkylates DNA. Science 363, eaar7785 (2019). - PMC - PubMed
    1. Xue M et al. Structure elucidation of colibactin and its DNA cross-links. Science 365, eaax2685 (2019). - PMC - PubMed

REFERENCES FROM METHODS SECTION

    1. Blokzijl F et al. Tissue-specific mutation accumulation in human adult stem cells during life. Nature 538, 260–264 (2016). - PMC - PubMed
    1. Heo I et al. Modelling Cryptosporidium infection in human small intestinal and lung organoids. Nat. Microbiol. 3, 814–823 (2018). - PMC - PubMed
    1. Pace P et al. FANCE: the link between Fanconi anaemia complex assembly and activity. EMBO J. 21, 3414–3423 (2002). - PMC - PubMed
    1. Li H & Durbin R Fast and accurate long-read alignment with Burrows-Wheeler transform. Bioinforma. Oxf. Engl. 26, 589–595 (2010). - PMC - PubMed
    1. Osorio FG et al. Somatic Mutations Reveal Lineage Relationships and Age-Related Mutagenesis in Human Hematopoiesis. Cell Rep. 25, 2308–2316.e4 (2018). - PMC - PubMed

Publication types