. 2020 Feb 27;15(2):e0229104.
doi: 10.1371/journal.pone.0229104. eCollection 2020.

Adaptive phenotypic modulations lead to therapy resistance in chronic myeloid leukemia cells

Affiliations

Adaptive phenotypic modulations lead to therapy resistance in chronic myeloid leukemia cells

Seda Baykal-Köse et al. PLoS One. .

Abstract

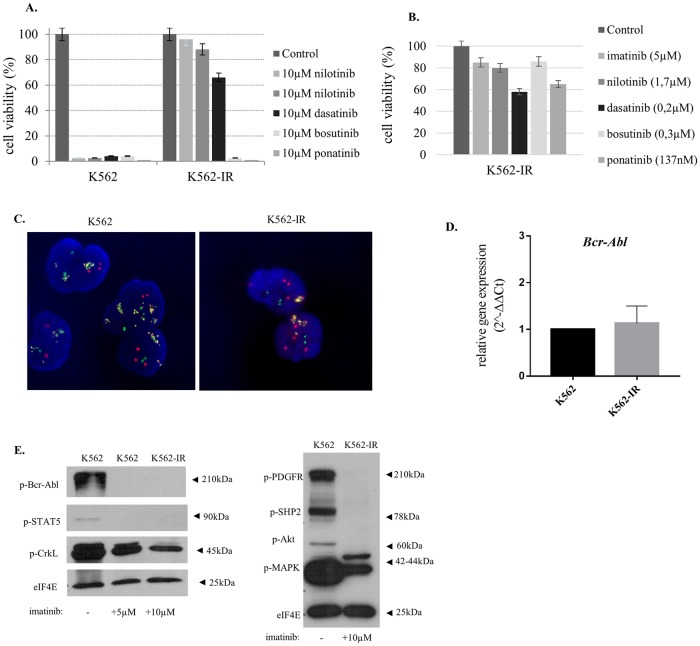
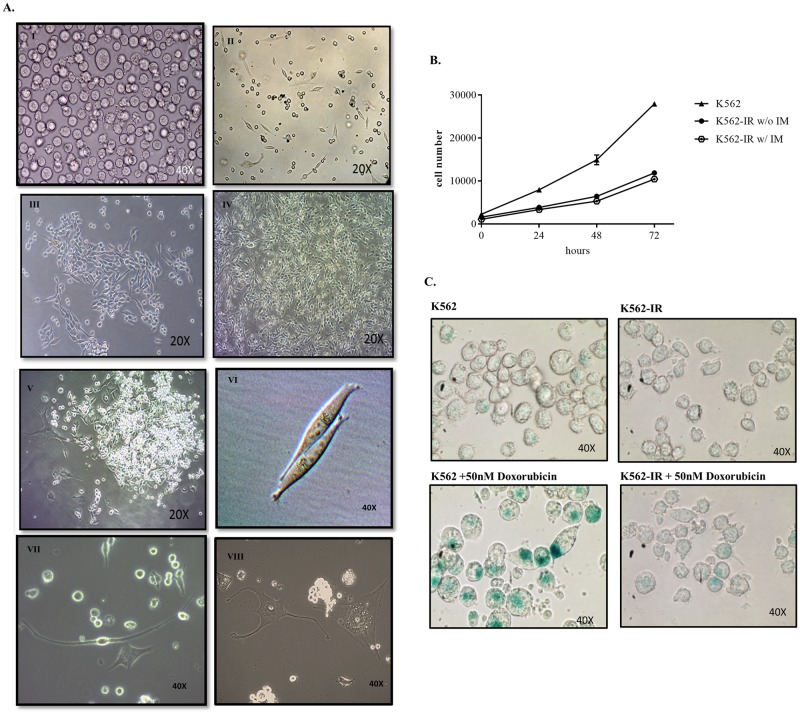
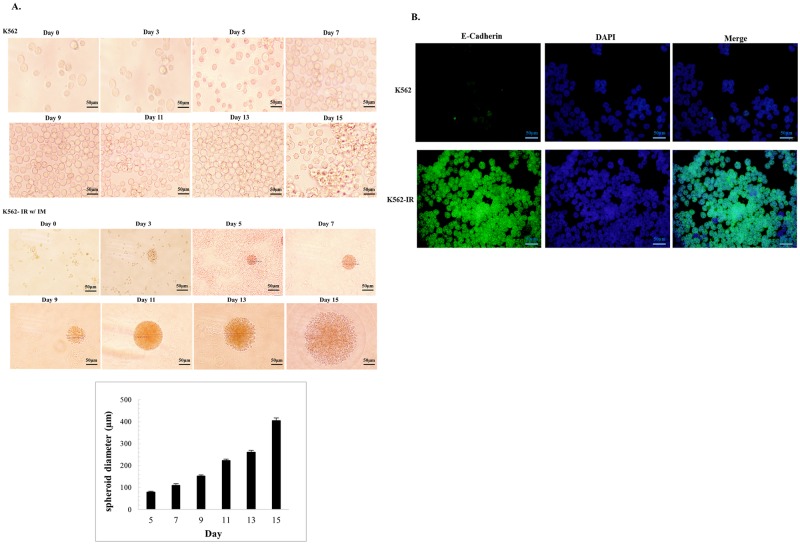
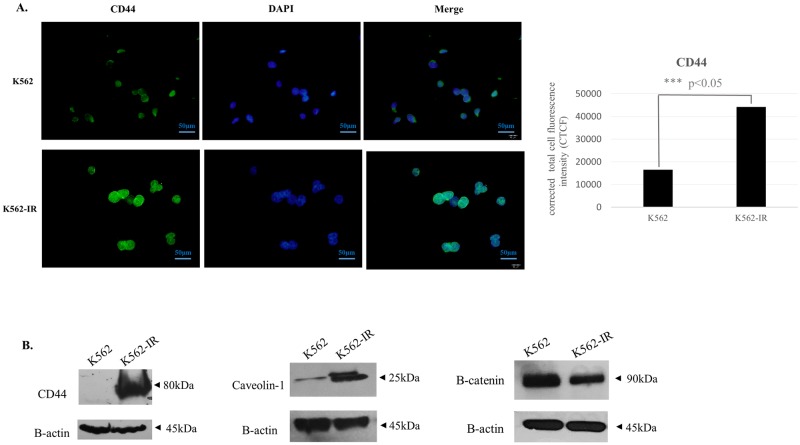
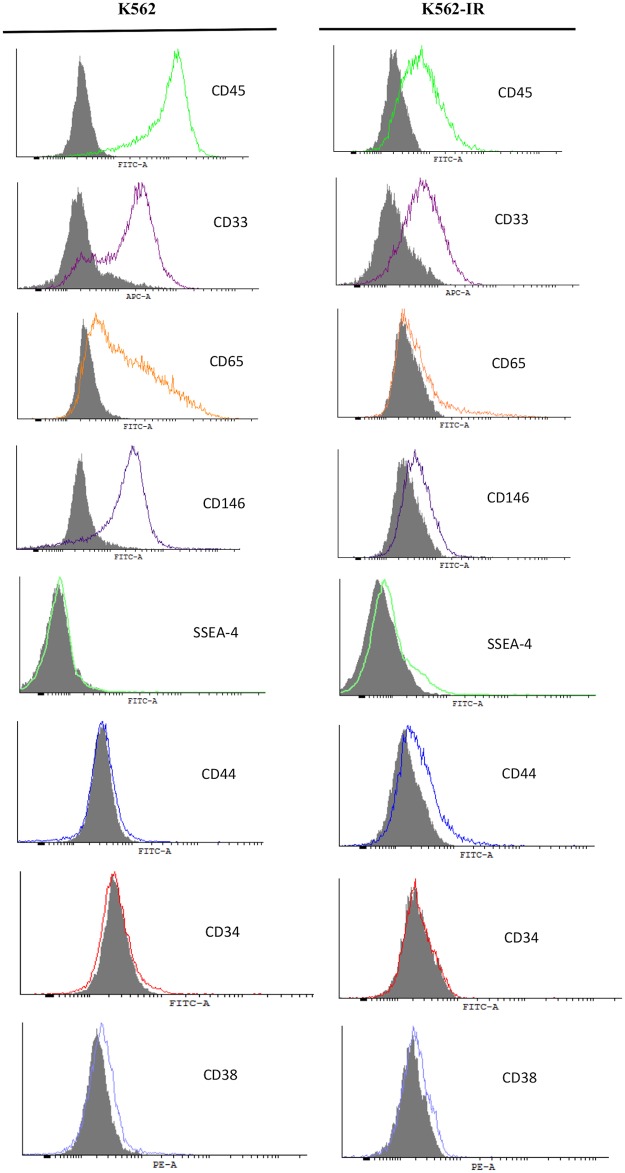
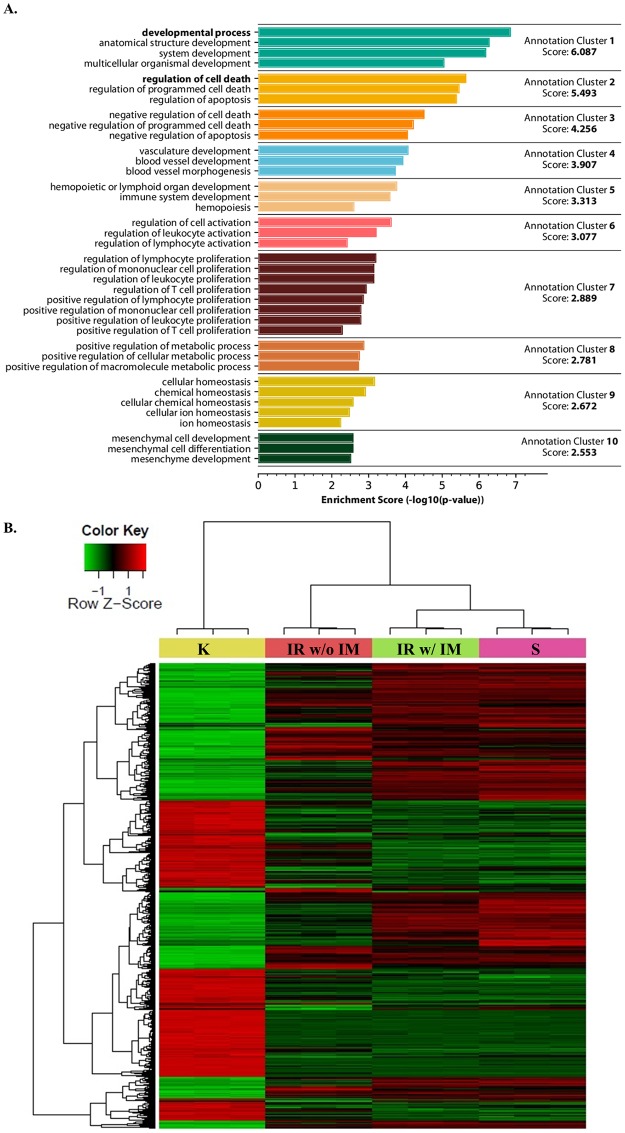
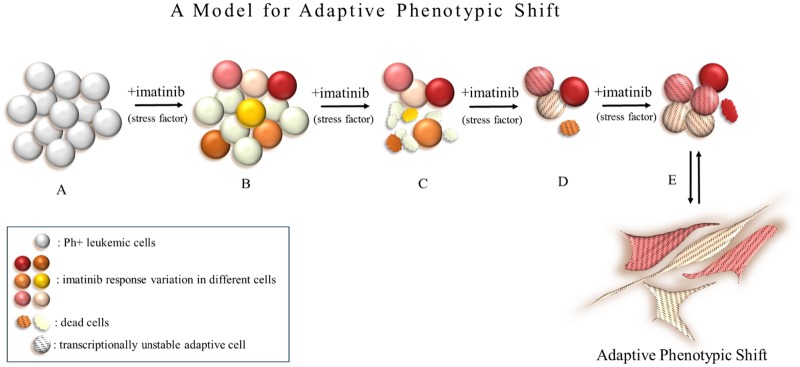
Tyrosine kinase inhibitor (TKI) resistance is a major problem in chronic myeloid leukemia (CML). We generated a TKI-resistant K562 sub-population, K562-IR, under selective imatinib-mesylate pressure. K562-IR cells are CD34-/CD38-, BCR-Abl-independent, proliferate slowly, highly adherent and form intact tumor spheroids. Loss of CD45 and other hematopoietic markers reveal these cells have diverged from their hematopoietic origin. CD34 negativity, high expression of E-cadherin and CD44; decreased levels of CD45 and β-catenin do not fully confer with the leukemic stem cell (LSC) phenotype. Expression analyses reveal that K562-IR cells differentially express tissue/organ development and differentiation genes. Our data suggest that the observed phenotypic shift is an adaptive process rendering cells under TKI stress to become oncogene independent. Cells develop transcriptional instability in search for a gene expression framework suitable for new environmental stresses, resulting in an adaptive phenotypic shift in which some cells partially display LSC-like properties. With leukemic/cancer stem cell targeted therapies underway, the difference between treating an entity and a spectrum of dynamic cellular states will have conclusive effects on the outcome.


Conflict of interest statement

The authors have declared that no competing interests exist.

Figures

Fig 1
Fig 1. K562-IR cells are resistant to TKIs and do not conform to known TKI resistance mechanisms.
A. Cell viability of K562 and K562-IR cell treated with 10μM TKIs B. Cell viability of K562-IR cells treated with Cmax (daily clinical dose) concentrations. Flow cytometry analyses results were shown in the S1 Results of S1 Fig. Cells were treated with TKIs for 24, 48 and 72h followed by trypan blue staining and flow cytometry analyses for assessing cell viability. Only 72h results are presented. Viability was measured by counting live cells via hemocytometer after staining. Non-TKI treated cells were used for normalizing viability percentages. C. FISH analysis of K562 and K562-IR cell lines. Randomly selected 300 cells were analyzed for Bcr (green), Abl (red) and fusion (yellow) signals and amplification feature (cluster/disperse). The comparison of the two cell lines showed no significant difference. D. BCR-ABL q-RT-PCR gene expression levels revealed no significant difference between two cell lines (p>0.05) (n = 3 biological, 2 technical replicates in each). E. BCR-Abl and PDGFR pathway Western Blot analysis. Activation of proteins involved in BCR-Abl and PDGFR signaling pathway was studied using phospho-antibodies cocktails. eIF4E is loading control. BCR-Abl pathway was studied in cell lysates of K562, K562 grown in complete media supplemented with 5μM imatinib for 24h and K562-IR cells which were continuously incubated in complete media with 10μM imatinib. PDGFR pathway was studied using lysates of K562 as control and K562-IR cell which were continuously incubated in complete media with 10μM imatinib. Imatinib inhibits effectively BCR-Abl and PDGFR signaling in the K562-IR cells. Full-length blots and visualisation are presented in, S1 Raw image.
Fig 2
Fig 2. Cellular morphology and proliferative properties of K562-IR cells.
A. K562 parental cells (I). K562-IR cells 24h day after of a new passage. A few adherent cells are observed. (II). The proliferation of adherent K562-IR cells (III). Monolayer of K562-IR cells after long-term culture and continuous removal of cells in suspension (IV). Adherent K562-IR cells forming colonies (V). Adherent K562-IR cells displaying different morphologies (VI-VIII) (Euromex inverted microscope, OX.2053 and DC5 optical imager). B. Comparison of the proliferation rates between K562, K562-IR w/o imatinib and K562-IR w/ imatinib. Cells at 24,48 and 72h time points using WST-8. The proliferation rate of K562-IR cells is approximately 4-fold slower than K562 at 72h (student t-test p≤0.01) (n = 3 biological replicates) C. ß-galactosidase senescence assay of K562 and K562-IR growing in media with imatinib. 50nm doxorubicin was added for 24h as positive control (upper right-lower right). The presence of imatinib does not trigger senescence in K562-IR cells. While doxorubicin induces senescence in K562 cells, K562-IR cells are resistant to this effect. (Euromex inverted microscope, OX.2053 and DC5 optical imager).
Fig 3
Fig 3. K562-IR cells form intact tumor spheroids and express E-cadherin.
A. Spheroid formation assay of K562 and K562-IR w/ IM (10μM) cells in agarose culture for 15 days. K562 cells do not form tumor spheroids whereas K562-IR cells show extensive spheroid formation (n = 3 biological replicate). Spheroid diameter measurements of K562-IR cells were performed every two days using an Olympus BX-51 microscope. B. E-cadherin immunofluorescence staining of K562 (upper row) and K562-IR (lower row) cells (Olympus BX-51 and the Olympus C-5050 digital test). K562-IR cells display high expression levels of E-cadherin.
Fig 4
Fig 4. Protein expressions of CD44, Caveolin-1, and B-catenin in K562 and K562-IR cells.
A. CD44 immunofluorescence staining. DAPI was used for nuclear visualization. Total corrected cellular fluorescence (TCCF) intensity of CD44 immunofluorescence images (right). (TCCF = Integrated Density–area of selected cell X mean fluorescence of background readings). Measurements were performed using the ImageJ software 40. K562-IR cells express CD44 protein higher than K562 (student t-test p ≤ 0.001) B. Western blot analyses of CD44, Caveolin-1, and B-catenin show that these proteins are highly expressed in K562-IR. B-catenin expression has decreased in K562-IR cells when compared to K562. B-actin and eIF4E were used as loading controls. (n = 3 biological replicates). Full-length blots and visualisation are presented in S1 Raw image.
Fig 5
Fig 5. Flow cytometry of cell surface markers of K562 and K562-IR cells.
CD45, CD33, CD65, CD146 hematologic marker expressions are reduced in K562-IR cells. CD44 and SSEA-4 have increased expression while no difference was observed in CD34 and CD38. Grey area in the histograms is background signal from isotype control. (n = 3 biological replicates).
Fig 6
Fig 6. Gene Ontology and heatmap analysis of transcriptome data.
A. Functional annotation cluster analysis based on Gene Ontology (GO) Biological Process (BP) terms. Analysis was performed using DAVID 6.7 database for differentially expressed genes (FDR < 0.05 and fold change > 2 or < 2) of IR w/ IM vs. K comparison. B. Heatmap generated from triplicate microarray analyses of differentially expressed genes considering a FDR adjusted p-value less than 0.05 as statistically significantly changed. Abbreviations: “K”, K562 cells incubated in complete media; “IR w/o IM”, floating K562-IR cells in suspension incubated in complete media without imatinib for four weeks; “IR w/ IM”, floating K562-IR cells in suspension continuously incubated in complete media with 10μM imatinib; “S”, spindle-shaped K562-IR cells continuously incubated in complete media with 10μM imatinib.
Fig 7
Fig 7. Adaptive phenotypic shift model as a TKI-resistance mechanism in CML cells.
(A) Ph+ leukemic cell population. (B) Imatinib susceptibility in Ph+ cells is not homogenous and is shown in different colors. (C) The most susceptible cells will die off immediately while imatinib response of other cells in the same population will differ and cell death will occur over time. (D) Cells with the ability to acquire a transcriptional instable state in search of an adaptive landscape that confers higher fitness, some cells will die during this while others survive by breaking through the BCR-Abl-driven life cycle. (E) Cells exhibiting adaptive phenotypic plasticity will survive under selective conditions, may dominate the population or stay dormant in a primitive adherent state within the niche until the environmental stressor (imatinib) is removed.

References

    1. Quintás-Cardama A, Cortes J. Molecular biology of bcr-abl1-positive chronic myeloid leukemia. Blood. 2009;113: 1619–30. 10.1182/blood-2008-03-144790 - DOI - PMC - PubMed
    1. Deininger MWN, Goldman JM, Melo JV, Dc W, Deininger MWN, Goldman JM, et al. The molecular biology of chronic myeloid leukemia Review article The molecular biology of chronic myeloid leukemia. 2000;96: 3343–3356. - PubMed
    1. Hochhaus A, Larson RA, Guilhot F, Radich JP, Branford S, Hughes TP, et al. Long-Term Outcomes of Imatinib Treatment for Chronic Myeloid Leukemia. N Engl J Med. 2017;376: 917–927. 10.1056/NEJMoa1609324 - DOI - PMC - PubMed
    1. Assouline S, Lipton JH. Monitoring response and resistance to treatment in chronic myeloid leukemia. Curr Oncol. 2011;18: e71–83. Available: http://www.ncbi.nlm.nih.gov/pubmed/21505592 - PMC - PubMed
    1. Jabbour EJ, Cortes JE, Kantarjian HM. Resistance to tyrosine kinase inhibition therapy for chronic myelogenous leukemia: a clinical perspective and emerging treatment options. Clin Lymphoma Myeloma Leuk. 2013;13: 515–29. 10.1016/j.clml.2013.03.018 - DOI - PMC - PubMed

Publication types

MeSH terms