. 2020 May 4;217(5):e20190834.
doi: 10.1084/jem.20190834.

A population of proinflammatory T cells coexpresses αβ and γδ T cell receptors in mice and humans

Affiliations

A population of proinflammatory T cells coexpresses αβ and γδ T cell receptors in mice and humans

Sarah C Edwards et al. J Exp Med. .

Abstract

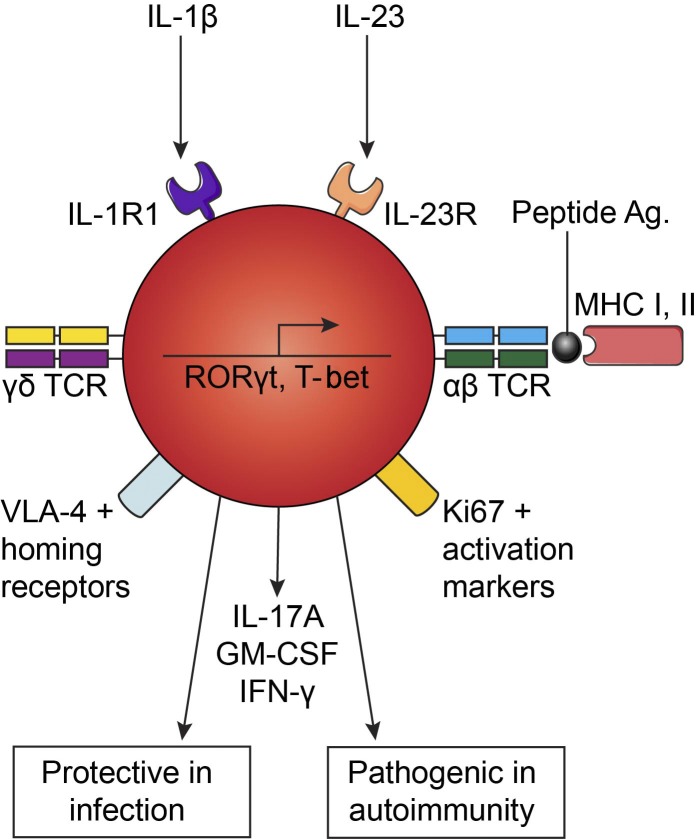
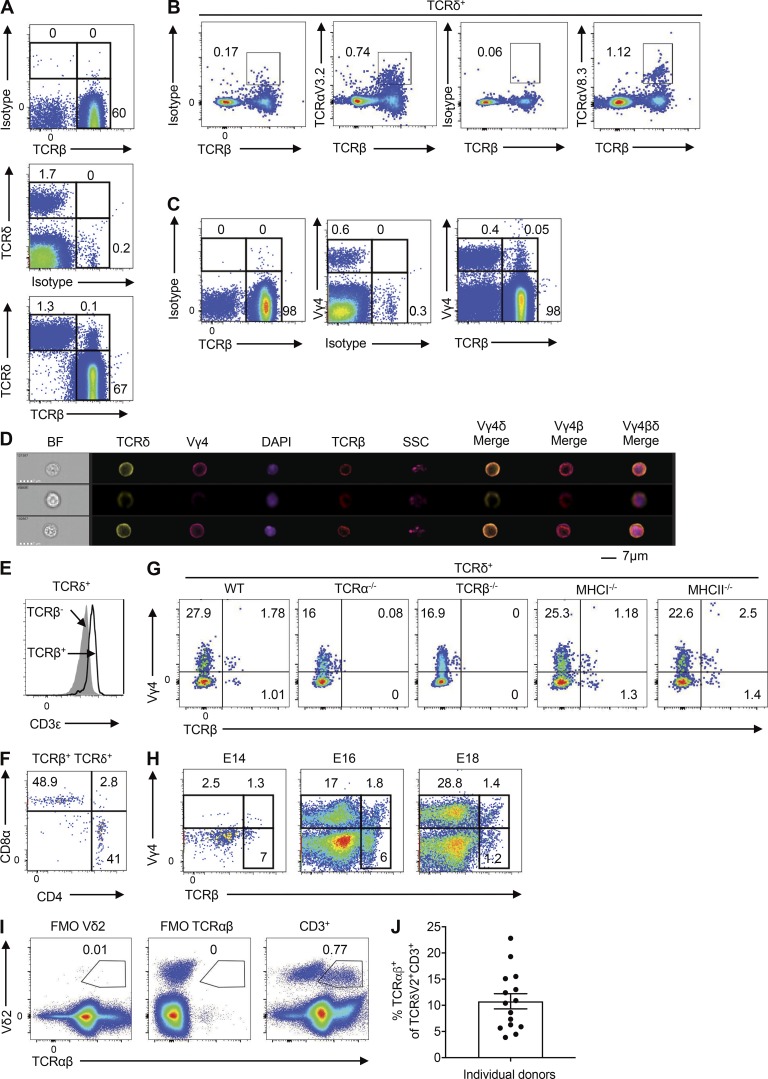
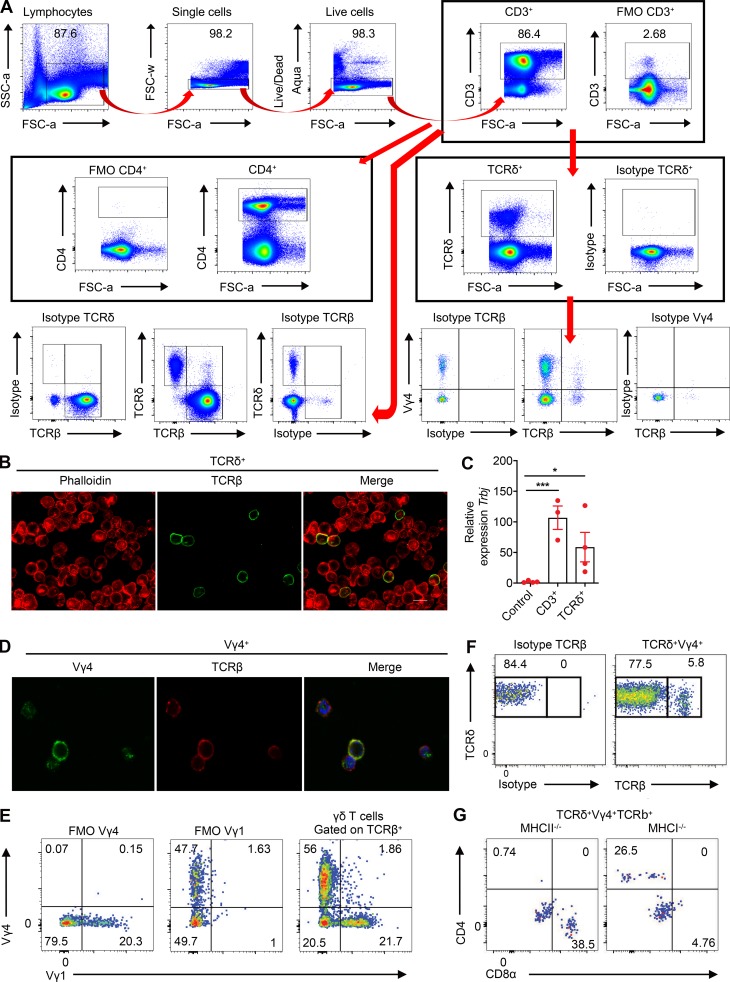
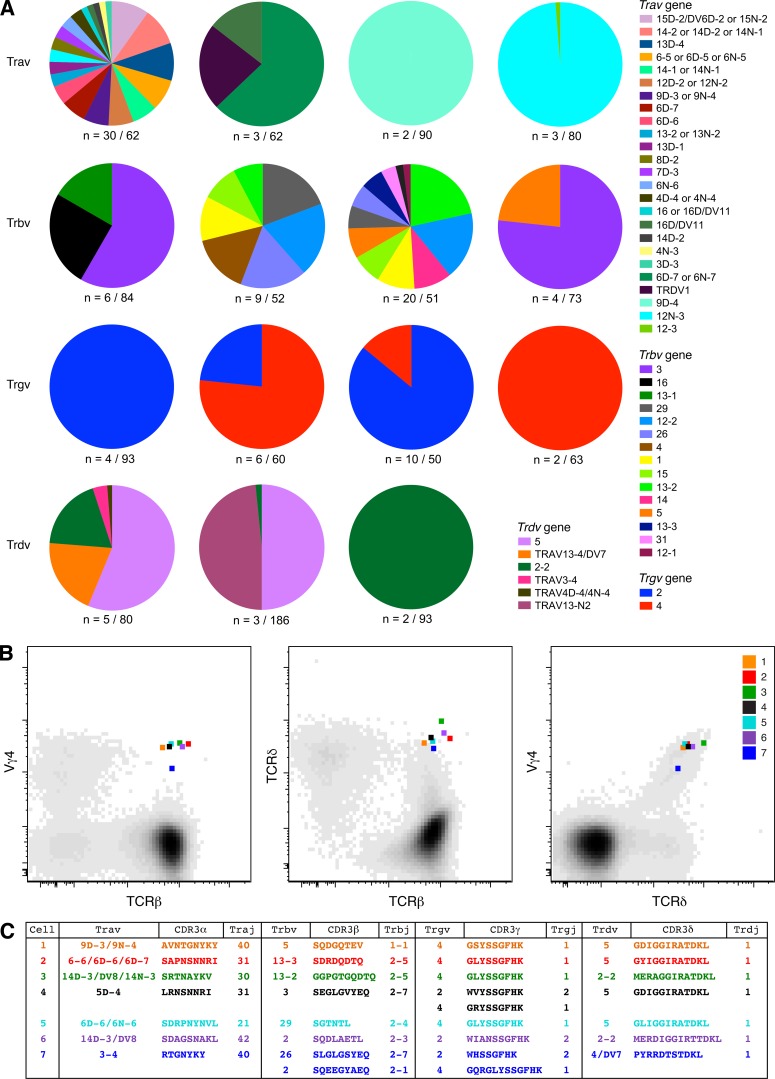
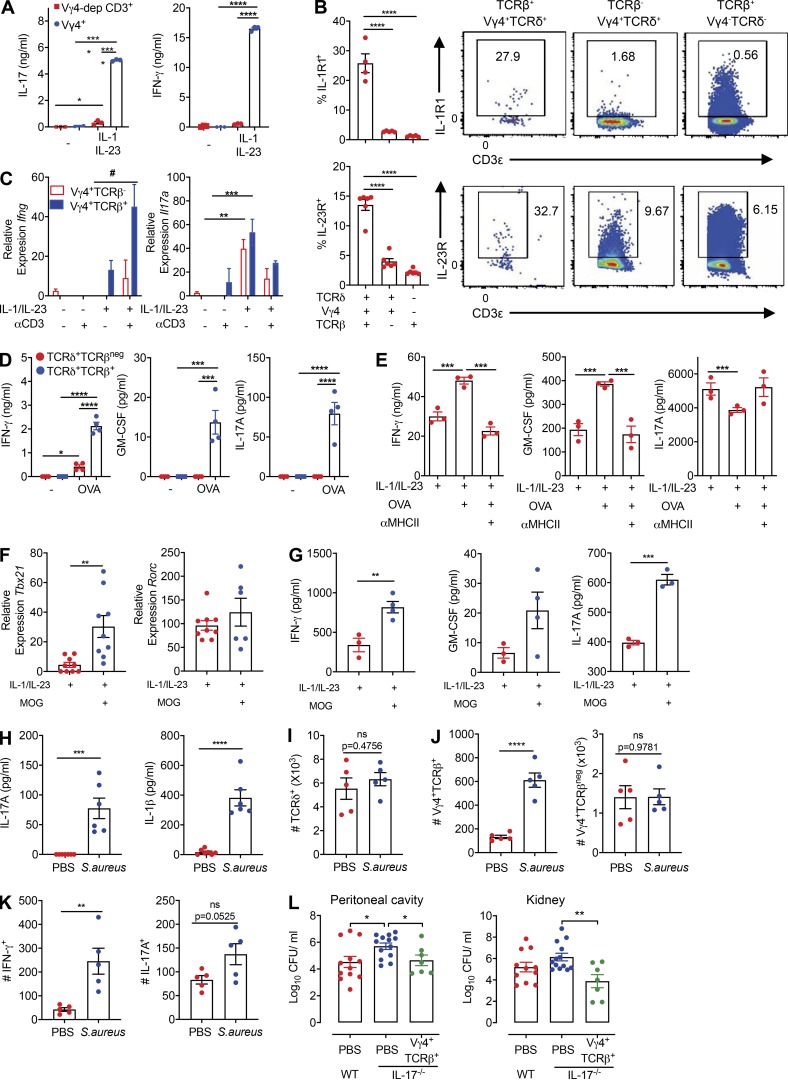
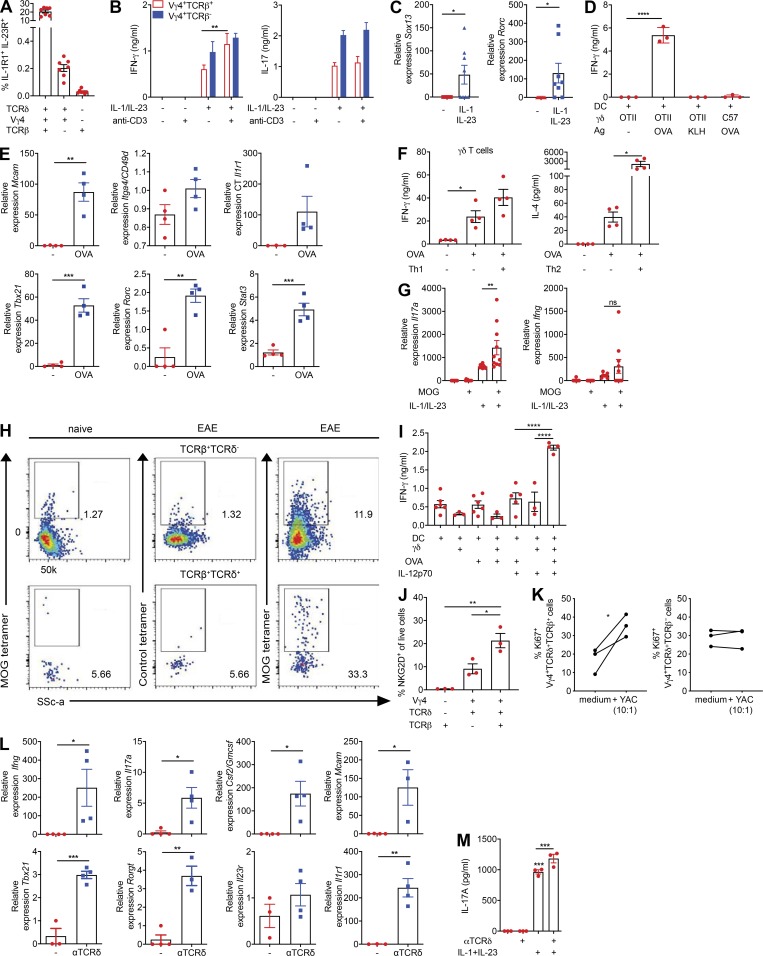
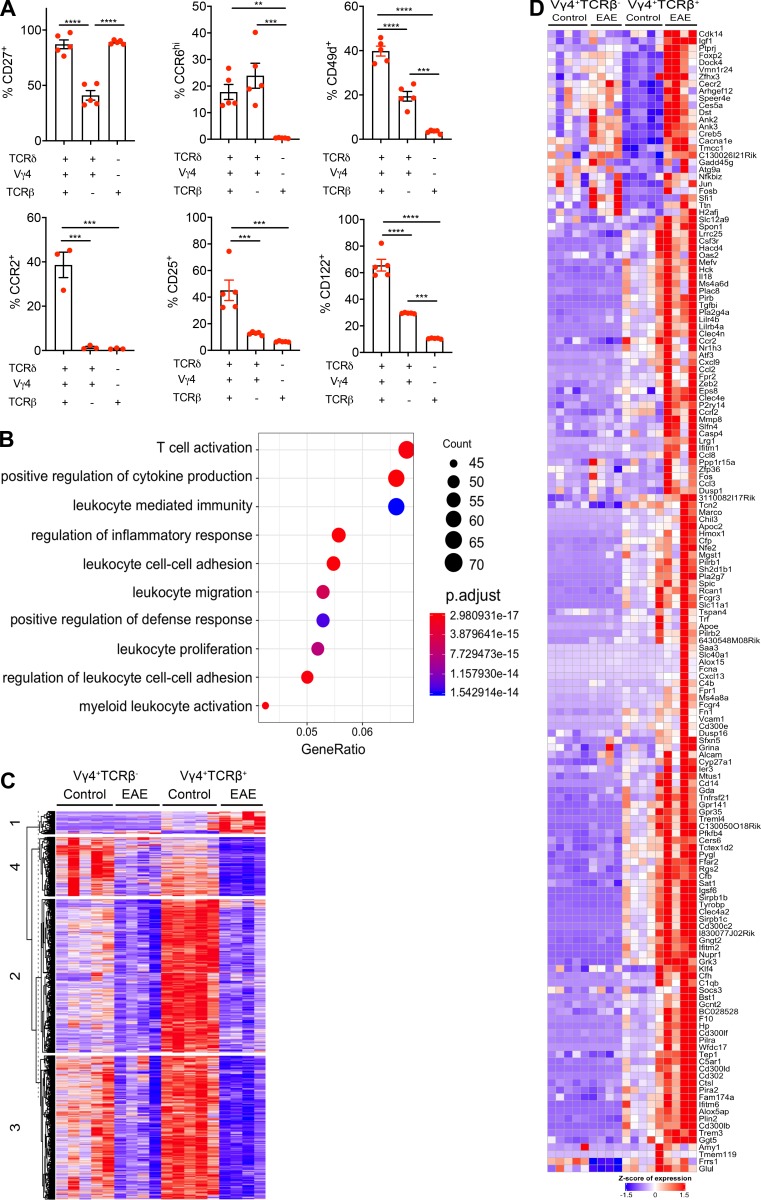
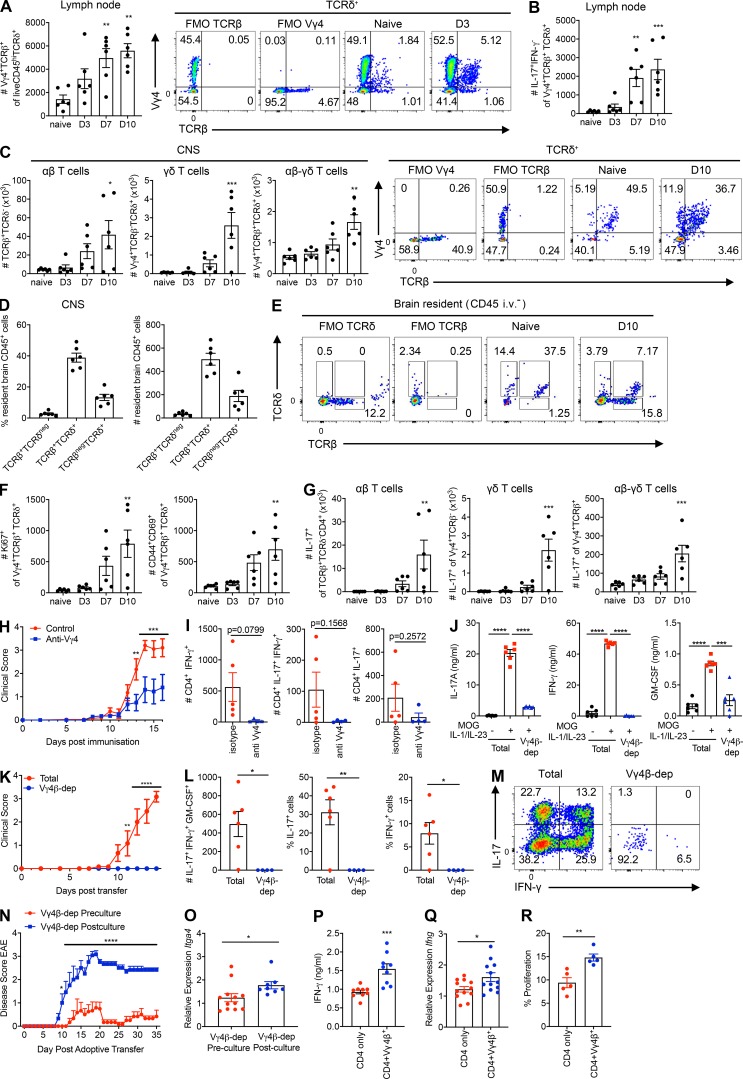
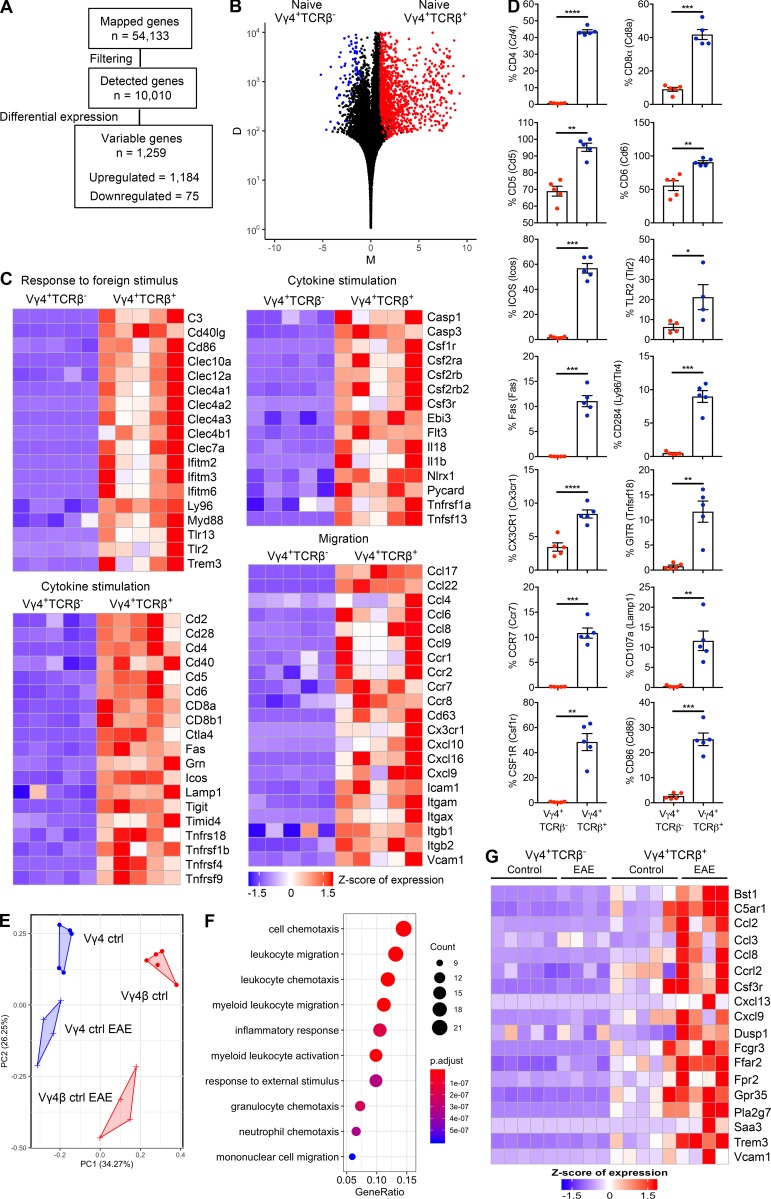
T cells are classically recognized as distinct subsets that express αβ or γδ TCRs. We identify a novel population of T cells that coexpress αβ and γδ TCRs in mice and humans. These hybrid αβ-γδ T cells arose in the murine fetal thymus by day 16 of ontogeny, underwent αβ TCR-mediated positive selection into CD4+ or CD8+ thymocytes, and constituted up to 10% of TCRδ+ cells in lymphoid organs. They expressed high levels of IL-1R1 and IL-23R and secreted IFN-γ, IL-17, and GM-CSF in response to canonically restricted peptide antigens or stimulation with IL-1β and IL-23. Hybrid αβ-γδ T cells were transcriptomically distinct from conventional γδ T cells and displayed a hyperinflammatory phenotype enriched for chemokine receptors and homing molecules that facilitate migration to sites of inflammation. These proinflammatory T cells promoted bacterial clearance after infection with Staphylococcus aureus and, by licensing encephalitogenic Th17 cells, played a key role in the development of autoimmune disease in the central nervous system.


Conflict of interest statement

Disclosures: Dr. Edwards reported grants from Abbvie during the conduct of the study. Dr. Thomas reported a patent to PCT/US2016/064735 pending. Dr. Mills reported grants from Abbvie during the conduct of the study and personal fees from Pieris outside the submitted work. In addition, Dr. Mills had a patent on IL-17 inhibitors pending. No other disclosures were reported.

Figures

None
Graphical abstract
Figure 1.
Figure 1.
Identification of unconventional T cells that coexpress αβ and γδ TCRs. (A and B) Flow cytometric analysis of LN cells from WT mice, stained for TCRδ and TCRβ, gated on live CD3+ T cells (A), or stained for Vα2, Vα8.3, and TCRβ, gated on live CD3+TCRδ+ cells (B). (C) Flow cytometric analysis of LN cells from WT mice, stained for Vγ4 and TCRβ, gated on live CD3+ T cells. (D) ImageStream analysis of LN cells from WT mice, stained for Vγ4, TCRδ, and TCRβ, and costained with DAPI. (E and F) Flow cytometric analysis of LN cells from WT mice, showing mean fluorescence intensity (MFI) for CD3ε expression, gated on live CD3+TCRδ+TCRβ or CD3+TCRδ+TCRβ+ cells (E), or stained for CD4 and CD8α, gated on live CD3+TCRδ+TCRβ+ cells (F). (G) Flow cytometric analysis of LN cells from WT, TCRα−/−, TCRβ−/−, MHCI−/−, or MHCII−/− mice, stained for Vγ4 and TCRβ, gated on live CD3+TCRδ+ cells. (H) Flow cytometric analysis of thymocytes isolated from WT mice on E14, E16, and E18, stained for Vγ4 and TCRβ, gated on live CD3+ cells. The gating strategy (A–H) is shown in Fig. S1 A. (I) Flow cytometric analysis of human PBMCs showing expression of TCRαβ and Vδ2, gated on live CD3+ cells. (J) Percent expression of TCRαβ among Vδ2+ cells in human PBMCs (n = 15 healthy donors), gated on live CD3+ cells. Data are representative of two independent experiments. Flow cytometry plots are representative of at least three independent experiments (n = 18 samples). BF, brightfield; FMO, fluorescence minus one; SSC, side scatter.
Figure S1.
Figure S1.
A novel population of T cells that coexpresses αβ and γδ TCRs. (A) Gating strategy for the analysis of T cell subsets, including hybrid αβ-γδ T cells, conventional γδ T cells, and CD4+ T cells. (B) Confocal images of purified TCRδ+ cells costained for TCRβ. (C) Trbj expression in purified CD3+ or TCRδ+ cells quantified by RT-PCR. Control: heart cells. *, P < 0.05, ***, P < 0.001. (D) Confocal images of purified CD3+Vγ4+ cells costained for TCRβ. (E) Flow cytometry plots showing expression of Vγ1 versus Vγ4 on TCRδ+ cells, gated on live TCRβ+ cells. (F) Flow cytometry plots showing expression of TCRδ versus TCRβ on LN cells, gated on live CD3+Vγ4+TCRδ+ cells. (G) Flow cytometry plots showing CD4 versus CD8α on LN cells from MHCI−/− or MHCII−/− mice, gated on live TCRδ+ Vγ4+ TCRβ+ cells. Data are representative of at least three independent experiments. Results are shown as mean ± SEM. P values were calculated using a one-way ANOVA with Tukey's test for multiple comparisons (C). FSC, forward scatter.
Figure 2.
Figure 2.
Molecular analysis of TCR expression in flow-purified Vγ4+TCRβ+ cells. Viable CD3+Vγ4+TCRβ+ cells were flow purified from WT mice. (A) Pie charts display relative population-level frequencies for the Trav, Trbv, Trgv, and Trdv genes depicted in the key (IMGT nomenclature), with the total number of sequences indicated below. Concatenated data are shown (n = 4 mice). (B) Flow cytometry plots showing index-sorted Vγ4+TCRδ+TCRβ+ cells superimposed on cloud plots depicting the overall distribution of Vγ4 versus TCRβ (left panel), TCRδ versus TCRβ (middle panel), and Vγ4 versus TCRδ (right panel) in one mouse with EAE. (C) TCR sequences amplified from the single cells shown in B. Cells and sequences are color matched in B and C.
Figure 3.
Figure 3.
Hybrid αβ-γδ T cells can be activated innately or via αβ or γδ TCRs. (A) Purified Vγ4+ cells or Vγ4-depleted CD3+ cells were stimulated for 3 d with IL-1β and IL-23 or with medium alone. Data show cytokine production measured by ELISA. (B) Flow cytometric analysis of IL-1R1 and IL-23R expression on Vγ4+TCRδ+TCRβ+, Vγ4+TCRδ+TCRβ, or Vγ4TCRδTCRβ+ cells, gated on live CD3+ cells. (C) Relative Ifng and Il17a expression in purified Vγ4+TCRβ+ or Vγ4+TCRβ cells stimulated for 3 d with IL-1β, IL-2, and IL-23 in the presence or absence of plate-bound anti-CD3. (D and E) IFN-γ, IL-17, and GM-CSF production by TCRδ+TCRβ+ or TCRδ+TCRβ cells (D), or TCRδ+TCRβ+ cells (E), isolated from OT-II mice and stimulated for 3 d with or without OVA-pulsed DCs in the presence or absence of IL-1β and IL-23 and/or anti-MHCII. Cytokines were measured by ELISA. (F and G) Vγ4+TCRβ+ cells were isolated from MOG-immunized mice on day 7 and cultured for 3 d with DCs in the presence or absence of MOG and/or IL-1β and IL-23. Relative gene expression was measured by RT-PCR (F), and cytokines were measured by ELISA (G). PECs were isolated from naive mice or 3 h after i.p. challenge with S. aureus. (H) Cytokine levels in PEC culture supernatants measured by ELISA. (I) Flow cytometric quantification of TCRδ+ cells, gated on live CD3+ cells. (J) Flow cytometric quantification of Vγ4+TCRδ+TCRβ+ or Vγ4+TCRδ+TCRβ cells, gated on live CD3+TCRδ+ cells. (K) Flow cytometric quantification of IFN-γ and IL-17 production by Vγ4+TCRδ+TCRβ+ cells. (L) Bacterial loads in the peritoneal cavity and kidneys of WT mice 3 d after S. aureus infection or IL-17−/− mice 3 d after adoptive transfer of Vγ4+TCRβ+ cells from WT mice or mock transfer (PBS). Data are representative of three independent experiments (n = 4–6 in A–K) or combined from two experiments (n = 8 or 12 in L). Flow cytometry plots in B are representative of six samples. Results are shown as mean ± SEM; *, P < 0.05, **, P < 0.01, ***, P < 0.001, ****, P < 0.0001, #,P < 0.05; ns, not significant; two-way ANOVA with Tukey's test for multiple comparisons (A, D, and E), one-way ANOVA with Tukey's test for multiple comparisons (B and L), three-way ANOVA with Tukey's test for multiple comparisons (C), or unpaired t test (F–K).
Figure S2.
Figure S2.
Hybrid αβ-γδ T cells can be activated innately or via αβ or γδ TCRs. (A) Coexpression of IL-1R1 and IL-23R on Vγ4+ hybrid αβ-γδ, Vγ4+ γδ T cells, or αβ T cells. (B) Production of IFN-γ and IL-17 by purified Vγ4+TCRβ+ or Vγ4+TCRβ cells (3,000 cells/well) stimulated for 3 d with IL-1β and IL-23 in the presence or absence of plate-bound anti-CD3. (C) Expression of Sox13 and Rorc mRNA in purified Vγ4+TCRβ+ cells stimulated for 2 d with IL-1β and IL-23. (D) Production of IFN-γ by TCRδ+ cells isolated from OT-II or C57BL/6 mice and cultured for 2 d with DCs pulsed for 5 h with OVA peptide or KLH. (E) Gene expression in TCRδ+TCRβ+ cells isolated from OT-II mice and cultured for 3 d with DCs in the presence or absence of OVA peptide. (F) Cytokine production by γδ T cells isolated from OT-II mice stimulated for 3 d with or without OVA peptide in the presence or absence of IL-12p70 + IL-18 (Th1) or IL-4 + anti–IFN-γ + anti–IL-17 (Th2). (G) Gene expression in Vγ4+TCRβ+ cells isolated from MOG-immunized mice on day 7 and cultured for 3 d with DCs in the presence or absence of MOG and/or IL-1β and IL-23. (H) LN cells isolated from 7 d MOG + CFA immunized or naive mice incubated with MOG-tetramer-Pe or control tetramer-Pe, gated on CD3+CD4+CD44+ cells, examining TCRβ+TCRδ+ and TCRβ+TCRδ populations. (I) γδ T cells from OT-I mice incubated for 3 d with DCs ± OVA peptide ± IL-12p70 and IFN-γ quantified in supernatants by ELISA. (J) Flow cytometry analysis of NKG2D expression on naive CD3+ T cells gating on TCRβ+ and TCRδ+ populations. (K) CD3+ T cells were incubated with and without YAC-1 cells (10:1) for 48 h. Proliferation was measured through expression of Ki67 by Vγ4+TCRδ+TCRβ+ versus Vγ4+TCRδ+TCRβ cells, gated on live CD3+TCRδ+ cells. (L) Gene expression in TCRδ+TCRβ+ cells stimulated for 2 d with anti-TCRδ. (M) Gene expression in CD3+ cells cultured for 3 d with IL-1β and IL-23 in the presence or absence of anti-TCRδ. Data are representative of at least two independent experiments. Results are shown as mean ± SEM. P values were calculated using a one-way ANOVA with Tukey's test for multiple comparisons (B, D, F, G, I–K, and M) or an unpaired t test (C, E, and L). *, P < 0.05, **, P < 0.01, ***, P < 0.001, and ****, P < 0.0001. ns, not significant.
Figure S3.
Figure S3.
Hybrid αβ-γδ T cells are transcriptomically distinct from conventional γδ T cells and express Th17-associated markers. (A) Enriched T cells isolated from the spleens and LNs of WT mice were stained ex vivo for CCR2, CCR6, CD25, CD27, CD49d, and CD122. Expression was determined on live CD3+ cells coexpressing various combinations of Vγ4, TCRδ, and TCRβ. Data are representative of at least two independent experiments. Results are shown as mean ± SEM. P values were calculated using a one-way ANOVA with Tukey's test for multiple comparisons. (B) Dot plot of the top 15 significantly enriched biological processes inferred from differentially up-regulated genes in Vγ4+TCRβ+ versus Vγ4+TCRβ cells. Dot color represents the P-adjusted enrichment value, and dot size represents the number of genes within each enriched ontology. (C) Heatmap of all protein-coding genes that are differentially expressed in Vγ4+TCRβ+ or Vγ4+TCRβ cells from mice with EAE versus naive mice (n = 2,686). Genes are clustered using k-means clustering and a cluster size of 4. (D) Heatmap of all protein-coding genes that are up-regulated in either Vγ4+TCRβ+ or Vγ4+TCRβ cells from naive mice or mice with EAE (cluster 1 from Fig. S3 C, n = 158 genes). **, P < 0.01, ***, P < 0.001, and ****, P < 0.0001.
Figure 4.
Figure 4.
Hybrid Vγ4+ αβ-γδ T cells promote CD4+ T cell homing to the CNS and drive the development of EAE. (A) Absolute numbers of Vγ4+TCRδ+TCRβ+ cells in the LNs of WT mice on days 0, 3, 7, and 10 of EAE. Right: representative flow cytometry plots. (B) Absolute numbers of IL-17-producing Vγ4+TCRδ+TCRβ+ cells in the LNs of WT mice on days 0, 3, 7, and 10 of EAE. (C) Absolute numbers of Vγ4+TCRδ+TCRβ, Vγ4+TCRδ+TCRβ+, or Vγ4TCRδTCRβ+ cells in the brains of WT mice on days 0, 3, 7, and 10 of EAE. Right: representative flow cytometry plots. (D) Absolute numbers and frequencies of brain-resident TCRδTCRβ+, TCRδ+TCRβ+, or TCRδ+TCRβ cells after gating on CD45 i.v. cells from naive mice injected with anti-CD45 10 min before euthanasia. (E) Representative flow cytometry showing expression of TCRβ versus TCRδ on tissue-resident (CD45 i.v.) T cells from naive mice or mice with EAE (day 10). (F) Absolute numbers of Ki67+ or CD44+CD69+ Vγ4+TCRδ+TCRβ+ cells in the CNS of WT mice on days 0, 3, 7, and 10 of EAE. (G) Absolute numbers of IL-17–producing Vγ4+TCRδ+TCRβ+, Vγ4+TCRδ+TCRβ, or CD4+ Vγ4TCRδTCRβ+ cells in the CNS of WT mice on days 0, 3, 7, and 10 of EAE. (H and I) WT mice were treated on days –1, 2, 5, 7, 11, and 14 with Vγ4-depleting or isotype control antibodies. (H) Clinical scores for EAE. (I) Absolute numbers of cytokine-producing CD4+ T cells in the spinal cords on day 21 of EAE. (J–M) Total spleen and LN cells or Vγ4+TCRβ+ flow-depleted (Vγ4β-dep) spleen and LN cells from MOG-immunized mice (day 7) were cultured for 3 d with MOG, IL-1β, and IL-23. (J) IL-17, IFN-γ, and GM-CSF concentrations in culture supernatants quantified by ELISA. (K) Cultured T cells were transferred to naive mice and clinical scores were recorded for EAE. (L) Absolute numbers and frequencies of cytokine-producing cells in the brains of recipient mice on day 10 of EAE. (M) Representative flow cytometry plots showing production of IFN-γ versus IL-17, gated on live CD3+ cells. (N and O) Vγ4+ TCRβ+ T cells were depleted from a culture of LN and spleen cells from MOG-immunized mice before or after culture with MOG, IL-1β, and IL-23. (N) Cultured T cells were transferred to naive mice and clinical scores were recorded for EAE. (O) Itga4 mRNA was quantified by RT-PCR in cultured cells before transfer. (P–R) CD4+ T cells were isolated from the spleens and LNs of mice immunized with MOG and CFA (day 7) and cultured for 3 d with IL-1β, IL-23, and MOG, either in the presence or absence of Vγ4+TCRβ+ cells. (P) IFN-γ in culture supernatants quantified by ELISA. (Q) Ifng expression in purified CD4+ T cells. (R) Proliferation of CD4+ T cells measured by CFSE dilution. Data are representative of three independent experiments (n = 6 for A–N) or combined from two experiments (n = 6 for O–R). Results are shown as mean ± SEM; *, P < 0.05, **, P < 0.01, ***, P < 0.001, ****, P < 0.0001; one-way ANOVA with Tukey's test for multiple comparisons (A–C, F, and G), two-way ANOVA with Tukey's test for multiple comparisons (J), repeated measures (H, K, and N), or unpaired t test (I, L, and O–R).
Figure 5.
Figure 5.
Hybrid αβ-γδ T cells are transcriptionally distinct from conventional γδ T cells. RNA sequencing analysis of Vγ4+TCRδ+TCRβ+ (Vγ4+TCRβ+) or Vγ4+TCRδ+TCRβ (Vγ4+TCRβ) cells flow sorted from the spleens and LNs of naive WT mice or WT mice on day 3 of EAE. (A) Summary of the data preprocessing and filtering workflow. (B) NOISeq MD plot of genes passing the low-level filtering cutoff (n = 10,010), highlighting DEGs (n = 1,259) between naive Vγ4+TCRβ+ and Vγ4+TCRβ cells. Red dots: genes up-regulated in Vγ4+TCRβ+ cells (n = 1,184). Blue dots: genes down-regulated genes in Vγ4+TCRβ+ cells (n = 75). M represents the log2-fold change in normalized expression values between Vγ4+TCRβ+ and Vγ4+TCRβ cells. D represents the absolute value of the difference in expression between Vγ4+TCRβ+ and Vγ4+TCRβ cells. D values are displayed on a log10 scale. Increasing D values represent increasing differences in expression levels between Vγ4+TCRβ+ and Vγ4+TCRβ cells. (C) Heatmaps of selected genes from enriched biological processes derived using gene ontology enrichment analysis of up-regulated genes between naive Vγ4+TCRβ+ and Vγ4+TCRβ cells. Expression values were z-transformed for visualization. (D) Flow cytometric analysis of purified CD3+ cells, comparing naive Vγ4+TCRβ+ and Vγ4+TCRβ cells, gated on live CD3+TCRδ+ cells. Results are shown as mean ± SEM. (E) Reduced dimensionality representation of four cell populations via a principal-component analysis plot, where the Vγ4+TCRβ+ and Vγ4+TCRβ populations separate along the first principal component (PC1) and the equivalent populations in naive mice or mice with EAE separate along the second principal component (PC2). (F) Dot plot of the top 10 significantly enriched biological processes inferred from differentially up-regulated genes in Vγ4+TCRβ+ or Vγ4+TCRβ cells from mice with EAE versus naive mice (cluster 1 in Fig. S3 C; n = 158 genes). Dot color represents the P-adjusted enrichment value, and dot size represents the number of genes within each enriched gene ontology. (G) Heatmap of genes associated with chemotaxis/migration among all four populations derived using the gene ontology enrichment analysis in F. Expression values were z-transformed for visualization. Most of the data are shown for individual mice (n = 4 or 5 mice per group), except in D, where the data are representative of two experiments (n = 5 mice). *, P < 0.05, **, P < 0.01, ***, P < 0.001, ****, P < 0.0001; unpaired t test.

References

    1. Ahmed R., Omidian Z., Giwa A., Cornwell B., Majety N., Bell D.R., Lee S., Zhang H., Michels A., Desiderio S., et al. . 2019. A Public BCR Present in a Unique Dual-Receptor-Expressing Lymphocyte from Type 1 Diabetes Patients Encodes a Potent T Cell Autoantigen. Cell. 177:1583–1599.e16. 10.1016/j.cell.2019.05.007 - DOI - PMC - PubMed
    1. Bosco N., Engdahl C., Bénard A., Rolink J., Ceredig R., and Rolink A.G.. 2008. TCR-beta chains derived from peripheral gammadelta T cells can take part in alphabeta T-cell development. Eur. J. Immunol. 38:3520–3529. 10.1002/eji.200838668 - DOI - PubMed
    1. Bowen S., Sun P., Livak F., Sharrow S., and Hodes R.J.. 2014. A novel T cell subset with trans-rearranged Vγ-Cβ TCRs shows Vβ expression is dispensable for lineage choice and MHC restriction. J. Immunol. 192:169–177. 10.4049/jimmunol.1302398 - DOI - PMC - PubMed
    1. Bray N.L., Pimentel H., Melsted P., and Pachter L.. 2016. Near-optimal probabilistic RNA-seq quantification. Nat. Biotechnol. 34:525–527. 10.1038/nbt.3519 - DOI - PubMed
    1. Cai Y., Shen X., Ding C., Qi C., Li K., Li X., Jala V.R., Zhang H.G., Wang T., Zheng J., and Yan J.. 2011. Pivotal role of dermal IL-17-producing γδ T cells in skin inflammation. Immunity. 35:596–610. 10.1016/j.immuni.2011.08.001 - DOI - PMC - PubMed

Publication types

MeSH terms

Substances