. 2020 Feb 10;20(2):12.
doi: 10.1167/jov.20.2.12.

Exploration of the functional consequences of fixational eye movements in the absence of a fovea

Affiliations

Exploration of the functional consequences of fixational eye movements in the absence of a fovea

Mehmet N Agaoglu et al. J Vis. .

Abstract

A recent theory posits that ocular drifts of fixational eye movements serve to reformat the visual input of natural images, so that the power of the input image is equalized across a range of spatial frequencies. This "spectral whitening" effect is postulated to improve the processing of high-spatial-frequency information and requires normal fixational eye movements. Given that people with macular disease exhibit abnormal fixational eye movements, do they also exhibit spectral whitening? To answer this question, we computed the power spectral density of movies of natural images translated in space and time according to the fixational eye movements (thus simulating the retinal input) of a group of observers with long-standing bilateral macular disease. Just as for people with normal vision, the power of the retinal input at low spatial frequencies was lower than that based on the 1/f2 relationship, demonstrating spectral whitening. However, the amount of whitening was much less for observers with macular disease when compared with age-matched controls with normal vision. A mediation analysis showed that the eccentricity of the preferred retinal locus adopted by these observers and the characteristics of ocular drifts are important factors limiting the amount of whitening. Finally, we did not find a normal aging effect on spectral whitening. Although these findings alone cannot form a causal link between macular disease and spectral properties of eye movements, they suggest novel potential means of modifying the characteristics of fixational eye movements, which may in turn improve functional vision for people with macular disease.


Conflict of interest statement

Commercial relationships: none.

Figures

Figure 1.
Figure 1.
Sample eye movement traces from the three groups of observers: (black) young adults, (red) older adults, and (blue) macular disease groups. Solid and dashed lines represent horizontal and vertical eye positions, respectively.
Figure 2.
Figure 2.
Power spectra of (A) drifts-only and (B) drifts + microsaccades for different observer groups. Each power spectrum represents the average across all observers of a given group. Black color represents young adults, red color represents older adults, and blue color represents the macular disease group. Shaded regions represent ±1 standard error. (C) Histogram of the slope of power spectra of the natural scene images (N = 87) used in this study.
Figure 3.
Figure 3.
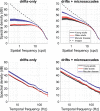
Two-dimensional average power spectra for all observer groups for (top) drifts-only and (bottom) drifts + microsaccades. Note that the power distributions in nonzero temporal frequencies are highly similar in the young and older adults with normal vision and that the power spectra are more spread out along the temporal frequency axis in the macular disease group.
Figure 4.
Figure 4.
Average (top) spatial and (bottom) temporal power spectra for drifts-only (left) and drifts + microsaccades (right). Shaded regions represent ±1 standard error. Dashed lines in the top panels represent the average spatial frequency content of all images in the natural scene database that we used. This also corresponds to the hypothetical power spectra of retinal images had there not been any fixational eye movements. Note that whitening occurs only along the spatial axis and that it is more complete when microsaccades are excluded. Most importantly, observers with macular disease also demonstrated whitening, although the effect is smaller when compared with the whitening demonstrated by the other two observer groups.
Figure 5.
Figure 5.
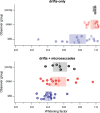
Whitening factors are plotted for individual observers for the three observer groups. Each observer is represented by a number (young adults), a lowercase letter (older adults), or an uppercase letter. Unfilled symbols represent the drifts-only condition (top panel), and filled symbols represent the drifts + microsaccades condition (bottom panel). Vertical lines (dashed lines for drifts-only condition and solid lines for drifts + microsaccade condition) represent the mean of the respective group, with the shaded regions representing the 95% confidence intervals. MD = macular disease.
Figure 6.
Figure 6.
Whitening factors are plotted as a function of (A) estimated diffusion constant of ocular drifts, (B) fixation instability (computed using the 68% isoline area; see Castet & Crossland, 2012), (C) PRL eccentricity, and (D) visual acuity. Only observers with macular disease are plotted in (C) and (D). Letter codes representing individual observers in (C) and (D) are the same as those plotted in Figure 5.
Figure 7.
Figure 7.
(A) Three goodness-of-fit metrics (R2, Pearson's ρ, and root mean square error) for approximating ocular drifts with Brownian motion. (B) Scatterplots showing how estimated diffusion constants co-vary with the goodness-of-fit metrics.

References

    1. Ağaoğlu M. N., Sheehy C. K., Tiruveedhula P., Roorda A., & Chung S. T. L. (2018). Suboptimal eye movements for seeing fine details. Journal of Vision, 18(5), 8, 10.1167/18.5.8. - DOI - PMC - PubMed
    1. Amore F. M., Fasciani R., Silvestri V., Crossland M. D., de Waure C., Cruciani F., & Reibaldi A. (2013). Relationship between fixation stability measured with MP-1 and reading performance. Ophthalmic and Physiological Optics, 33(5), 611–617, 10.1111/opo.12048. - DOI - PubMed
    1. Barlow H. B. (1961). Possible principles underlying the transformations of sensory messages. In Rosenblith W. A. (Ed.), Sensory communication (pp. 217–234). Cambridge, MA: MIT Press.
    1. Bernard J.-B., & Chung S. T. L. (2018). Visual acuity is not the best at the preferred retinal locus in people with macular disease. Optometry and Vision Science, 95(9), 829–836, 10.1097/OPX.0000000000001229. - DOI - PMC - PubMed
    1. Burton G. J., & Moorhead I. R. (1987). Color and spatial structure in natural scenes. Applied Optics, 26(1), 157–170. - PubMed

Publication types